INTERNATIONAL JOURNAL OF PHARMACEUTICAL, CHEMICAL AND BIOLOGICAL SCIENCES
Available online at
www.ijpcbs.com
DEVELOPMENT AND VALIDATION OF AN ACCURATE AND
PRECISE LC-MS/MS METHOD FOR DETERMINATION OF
TENOFOVIR AND EMTRICITABINE IN HUMAN PLASMA
Amit Patel
1,
Ami Patel
2and Ashlesha Makwana
11
Pharmaceutical Chemistry Department, Kadi Sarva Vishwavidyalaya,
Gandhinagar – 382015, Gujarat, India.
2
Analytical Research & Development, Amneal Pharmaceticals
,
Ahmedabad – 382213, Gujarat, India.
Research Article
ABSTRACT
A simple, accurate and precise LC-MS/MS analytical method was developed and validated for the simultaneous assay of tenofovir and emtricitabine which are used for the treatment of HIV-infected patients. Extraction from human plasma was performed on Oasis MCX cartridges. The chromatographic separation was performed with Chromolith Speedrod RP18 column. The total chromatographic run time is 2.8 minutes. Both of the tenofovir and emtricitabine were monitored through positive ESI mode by MRM transitions 288.1>176.2 and 248.1>130.1 respectively. The validated linearity of this method was in the range of 3.030-1512.901ng/mL and 5.050-2521.999ng/mL for tenofovir and emtricitabine respectively. Lower limit of quantitation (LLOQ) for both tenofovir and emtricitabine was achieved up to 3.030ng/mL and 5.050ng/mL respectively with a better signal to noise ratio. The correlation co-efficient (r) value for both the calibration curve was higher than 0.9992 for five precision and accuracy batches.
1. INTRODUCTION
Tenofovir disoproxil fumarate (TDF or PMPA1),
(({[(2R)-1-(6-amino-9H-purin-9-yl) propan-2-yl] oxy} methyl) phosphonic acid) marketed by Gilead Sciences under the trade name Viread, belongs to a class of antiretroviral drugs known as nucleotide analogue reverse transcriptase inhibitors (NRTIs), which block reverse transcriptase, a crucial virus enzyme in human immunodeficiency virus 1 (HIV-1) and hepatitis B virus infections2.
Tenofovir is indicated in combination with other antiretroviral agents for the treatment of HIV-1 infection in adults and pediatric patients 2 years of age and older2. It was found that both tenofovir
alone, as well as the tenofovir/ emtricitabine combination, significantly decreased the risk of contracting HIV3.
The initial form of tenofovir used in these studies had limited potential for widespread use because it was not absorbed when administered orally. A medicinal chemistry team at Gilead developed a modified version of tenofovir, tenofovir disoproxil fumarate4. This version of tenofovir, which is the
only version used clinically today, is often referred to simply as "tenofovir". In this version of the drug, the two negative charges of the tenofovir phosphonic acid group are masked, thus enhancing oral absorption.
Since these anti-viral drugs do not interact pharmacokinetically, and have moderate elimination half-lives in plasma, a once-daily combination therapy is possible5. Furthermore,
the combination of TDF and FTC can result in a greater HIV RNA suppression than either drug alone6.
Emtricitabine (FTC) (4-amino-5-fluoro-1-[(2R,5S )-2-(hydroxymethyl)-1, 3-oxathiolan-5-yl]-1,2-dihydropyrimidin-2-one), with trade name Emtriva (formerly Coviracil), is a nucleoside reverse transcriptase inhibitor (NRTI) for the treatment of HIV infection in adults and children7.
Fig. 1: illustrates chemical structure tenofovir disoproxil fumarate (A) an Emtricitabine (B)
Tenofovir/emtricitabine, trademark Truvada by Gilead Sciences, is a fixed dose combination of two antiretroviral drugs used for the treatment of HIV. It consists of 300 milligrams of tenofovir disoproxil fumarate (of which 245mg tenofovir) and 200 milligrams of emtricitabine. Emtricitabine/tenofovir DF 200 mg/300 mg once daily was an effective backbone for boosted protease inhibitor (PI) based regimens in the initial treatment of HIV-1 infection7, 8.
Different methods have been reported in the literature for monitoring plasma levels of tenofovir and emtricitabine individually. Some other techniques used in individual analysis of tenofovir from plasma include HPLC with mass spectrometric9, 10, spectrofluorimetric11, UV and
single mass spectrometric12 and simple UV
detection13.
Takahashi et al. also report a conventional LC–MS method for quantifying tenofovir individually from human plasma in the concentration range of 0.019–1.567µg/ml14. Emtricitabine has been
quantified in presence of other antiretroviral drugs, by Notari et al.15 and Rebiere et al.16.
Sparidans et al. have quantified emtricitabine individually in human plasma using a validated LC–MS/MS method with a detection limit of up to 5 ng/ml17.
This paper expresses a marvelous method for the quantification of Tenofovir and Emtricitabine in a human plasma sample, using an optimized solid phase extraction (SPE) procedure using HPLC and triple quad MS/MS detector. This method significantly increases high sample throughput with reproducible and accurate results.
2. EXPERIMENTAL
2.1. Reagents & chemicals
standards of clonazepam (99.4%) was obtained from Clearsynth Pvt. Ltd. (Mumbai, India). HPLC grade methanol and formic acid, ammonia were procured from Merck Specialties Pvt. Ltd. (Mumbai, India). Ammonium acetate of purity ≥99% were purchased from Sigma-Aldrich (St. Louis, MO, USA). HPLC grade acetic acid was purchased from Spectrochem (Mumbai, India). Oasis-MCX extraction cartridges were occupied from Waters (Bangalore, India). Water used in the entire analysis was collected from Milli-Q water purification system from Millipore (Bangalore, India). Blank human plasma with K3EDTA as
anticoagulant was obtained from Prathama Blood Centre (Ahmedabad, India) and was stored at −20 ºC until use.
2.2. Instruments & software
The LC–MS/MS instrument used was a UFLC system (Shimadzu, Japan), with binary prominence pump model LC-20AD with DGU-20A3 degasser, SIL-HTc auto-sampler, CTO-10ASVp column oven and triple quad API 4000 mass detector with ESI interface (Applied Biosystems, MDS Sciex, Canada). Analyst software (version 1.6.2, AB Sciex, Canada) was used for acquiring the chromatographic data.
Peak response area ratio of the analyte to IS was used for construction of the calibration curve. A weighting factor of 1/x2 using linear regression
was used for curve fitting. The same regression equation was used to back-calculate the quality control samples and results were compared with the theoretical concentration to obtain the accuracy.
2.3. Calibration standard and quality control
sample preparation
Stock solution of tenofovir and emtricitabine were prepared by dissolving the precisely individually weighed compounds in water: methanol (75:25v/v) obtaining a final concentration of about 1.0mg/mL. This tenofovir and emtricitabine stock solutions were serially diluted with methanol: water (50:50v/v) to make a series of standard curve working solutions at 75645.033, 33662.040, 16831.020, 7573.959, 3786.979, 1514.792, 302.958, 151.479ng/mL for tenofovir and 126099.968, 56114.486, 28057.243, 12625.759, 6312.880, 2525.152, 505.030, 252.515ng/mL for emtricitabine.
Again tenofovir and emtricitabine stock solutions were serially serially diluted with methanol: water (50:50v/v) to make a series of quality control working solutions at 67240.030, 3765.442,
442.816, 154.986ng/mL for tenofovir and 112088.861, 6276.976, 738.172, 258.360ng/mL for emtricitabine as high, mid, low and LLOQ level respectively.
An eight point standard curve was prepared by spiking the previously screened blank plasma with appropriate amount of respective tenofovir and emtricitabine working standard solutions. The calibration curve ranged from 3.030-1512.901ng/ml and 5.050-2521.999ng/ml for tenofovir and emtricitabine respectively. Aliquots of 400µL were stored at -20°C prior to use. All the working standards, stock and working solutions were stored at refrigerator temperature 5°C. 1mg/mL stock solution of clonazepam internal standard (IS) was prepared in methanol and further diluted with methanol to obtain the working solution of IS of a concentration 100ng/mL.
2.4. Extraction procedure
To 300µL aliquoted human plasma, 50µL of IS (100ng/mL of Clonazepam in methanol) was added. Then 250µL of 10%v/v formic acid was added and mixed properly. Samples were centrifuged at 4000 RPM for 5 minutes at 5°C. Oasis-MCX, 30mg/1mL extraction cartridges pre-conditioned with 1.0mL methanol followed by 1.0mL of 1%v/v formic acid were used for extraction of analytes and IS. Centrifuged samples were loaded to the pre-conditioned cartridges. Then cartridges were washed with 1.0mL of 1%v/v formic acid followed by 1.0mL of methanol and dried completely by applying full nitrogen pressure. Analytes and IS were eluted with 600µL elution solution (10% ammonia (v/v): methanol (15:85)). Eluent was evaporated under nitrogen stream at 45°C. Dried samples were reconstituted with 400µL mobile phase and 10µL of the sample was injected to the column.
2.5. Chromatographic conditions and
LC-MS/MS parameters
For MS/MS, ESI with positive MRM was selected for ionization. Tenofovir & Emtricitabine were monitored by MRM transitions 288.1>176.2 and 248.1>130.1 respectively. IS was monitored by MRM transition 316.1>270.1. De-clustering Potential (DP) & Entrance Potential (EP) for Tenofovir, Emtricitabine and Clonazepam were 60.0V & 10.0V respectively. Collision Energy (CE) for Tenofovir, Emtricitabine and Clonazepam were 20.0V, 38.0V & 38.0V respectively. Collision Cell Exit Potential (CXP) for Tenofovir, Emtricitabine and Clonazepam were 12.0V, 16.0V & 14.0V respectively. Curtain Gas, Nebulizer Gas, Heater Gas, Capillary voltage, Temperature, Collision Gas for all the MRM transitions were maintained as 40psi, 50psi, 55psi, 5500V, 550ºC and 6psi. Dwell time for all the MRM transitions was 200msec.
3. DEVELOPMENT
Preliminary experiments were conducted to achieve the response and better chromatography to precisely quantitate the desired LOQ level. The choice of analytical column and mobile phase composition are playing a vital role in build-up and optimization of chromatography for simultaneous analysis. Various C18 columns with different length and internal diameters with different size of particle size were tried to achieve maximum peak separation from the suppression zone.
Extraction method was finalized after various experiments by changing the extraction buffers, extraction cartridges selection, cartridge conditioning solutions, washing solutions and elution solutions etc. After selection of best mobile phase, MS/MS parameters for both the analytes were tuned along with the mobile phase to optimize the detector response. The injection volume of sample was set so as to maximize the signal to noise ratio of LLOQ sample with adequate chromatography.
4. METHOD VALIDATION
The method validation procedure was based on the recommendations published online by the FDA [18].
4.1. System suitability & carryover
System suitability was performed by six consecutive runs of MQC sample. Carryover of the chromatographic system was evaluated in each experiment throughout the validation by injecting blank sample before and after highest concentration sample.
4.2. Specificity and selectivity
Interference from endogenous compounds was investigated by analysis of ten different blank plasma lots including haemolysed, lipidemic and heparinized plasma. The extracted blank and LLOQ plasma samples from each plasma lot were injected into the chromatographic system. Drug-drug reactivity effect was also examined for the enhancement or suppression in any of analyte.
4.3. Limits of quantification and limit of
detection
The lower limit of quantification (LLOQ) was defined as the lowest concentration of calibration curve for which the standard deviation (% CV) and the % bias from the nominal concentration were less than 20%. The upper limit of quantification (ULOQ) was defined as the highest concentration of calibration curve for which both the % CV and the % bias from the nominal concentration were less than 15%. The detection limit was defined as a signal-to-noise ratio of 3:1.
4.4. Linearity, accuracy and precision
Peak area of analyte(s) and IS ratios for the calibration standards were proportional to the concentration of analyte(s) in plasma over the range tested. The calibration curves were fitted by linear regression with weighted least-squares. The linear regression data for the calibration curves (n=5) for the method was determined throughout the validation. Intra-day and inter-day accuracy and precision were determined by assaying extracted samples (n=6) at four different concentrations (QCs) for each drug for 5 analytical batches.
4.5. Dilution integrity
This was especially for the subject samples which are found to contain concentrations exceeding the ULOQ. So, it was ascertained to confirm whether the dilution of these samples before analysis can modify the accuracy of the drug determination.
4.6. Matrix effect
Matrix effect was performed using six different blank plasma lots at LQC and HQC concentration in triplicate by calculating the % accuracy and precision (% CV) which should be in the range of 85-115% and ≤15% respectively.
4.7. Matrix factor
levels of QCs as the peak-area response of analyte(s) added to blank plasma extracts, divided by the peak-area response of standard solution of analyte(s). A value above or below 1 for the matrix factor indicates an ionization enhancement or suppression, respectively. The results were showing that co-eluting plasma matrix components do not appear to affect significantly the ionization of tenofovir and emtricitabine as well as IS.
4.8. Recovery
Extraction efficiency was established from the peak area of the extracted QC samples at low, medium and high levels and expressed as a percentage of peak area of equivalent un-extracted samples prepared in aqueous solution.
4.9. Ruggedness
Ruggedness of the method was evaluated using re-injection of one precision and accuracy batch samples using different columns of the same make and also with different analysts.
4.10. Stability
Six replicates of plasma extracted samples at each of the low and high QC concentrations were analyzed for each stability experiment against the freshly prepared calibration standards. All the
stability samples were considered stable if the % accuracy and % CV were found within the range 85-115% and ≤15% respectively.
Bench-top stability was assessed by keeping spiked plasma samples for 12 hours in a deep freezer at -20°C and then kept at ambient temperature (20°C) and then extracted and analyzed. Dry extract stability was assessed by keeping the dried samples after extraction in deep freezer at (-20°C) and then reconstituted and analyzed. Freeze and thaw stability was assessed after five freeze–thaw cycles (at -20°C & -70°C) and then plasma samples were extracted and analyzed. Extracted plasma samples were tested for wet extract stability, which included auto-sampler stability and re-injection reproducibility. In auto-sampler stability, samples were analyzed after being stored in the auto-sampler at 5°C. In re-injection reproducibility, the re-injections of previously injected samples were carried out. Long-term stability in plasma was established after the storage of samples in a deep freezer (at -20°C & -70°C).
Stock solutions of tenofovir, emtricitabine and clonazepam and working solutions of tenofovir and emtricitabine were assessed for short term stability at ambient temperature 20°C and for long term stability in a refrigerator at 5°C.
5. RESULTS
5.1. System suitability and carryover
The precision (% CV) of system suitability test was observed within 0.4% for the retention time and 1.9% for the area ratio of analyte(s)/IS. No significant carryover was observed for any of analyte(s) and IS in each experiment.
5.2. Specificity and selectivity
No endogenous substances were found to be interfered at the retention time of analyte(s) or internal standard in blank plasma extracts. It was also determined that there is no drug-drug reaction effect like enhancement or suppression for any analyte.
5.3. Limits of quantification and limit of
detection
The % mean accuracy of LLOQ at a concentration 3.030ng/mL and 5.050ng/mL was 99.0% and 100.6% with precision (% CV) of 1.9% and 1.9% for tenofovir and emtricitabine respectively. The mean signal to noise ratio of all LLOQ samples for both tenofovir and emtricitabine were found ≥24.0.
5.4. Linearity, accuracy and precision
The regression coefficient (r) of all five calibration curves was ≥ 0.9992 for both tenofovir and emtricitabine. The method was linear from 3.030-1512.901ng/mL and 5.050-2521.999ng/mL for tenofovir and emtricitabine respectively. Intra-day and inter-day accuracy and precision were determined by assaying six spiked plasma samples at four different concentrations (QCs) for each drug for 5 analytical batches. Accuracy was calculated as the percent deviation from the nominal concentration. Results of accuracy and precision of all 5 batches are shown in table 1 (a & b) and table 2 (a & b).
5.5. Dilution integrity
For dilution integrity, sample was further diluted to five-fold and ten-fold dilutions with drug free blank plasma to bring the concentration within the calibration range.
% accuracy and precision (% CV) of five and ten fold dilutions were 99.1% & 1.3% and 101.4% & 2.2% respectively for tenofovir. % accuracy and precision (% CV) of five and ten fold dilutions were 102.9% & 2.0% and 98.9% & 2.2% respectively for emtricitabine.
5.6. Matrix effect
The % mean accuracy and precision (% CV) of LQC and HQC samples for all 6 different lots were 101.3% & 3.3% and 100.6% & 1.3% respectively for tenofovir and 105.0 % & 2.2 % and 102.7 % & 3.1 % respectively for emtricitabine.
5.7. Matrix factor
A value above or below 1 for the matrix factor indicates an ionization enhancement or suppression, respectively. The mean IS normalized matrix factors for low, mid and high QCs were 1.03, 1.00, 1.01 & 1.01, 1.01, 1.02 for tenofovir and emtricitabine respectively. The results were showing that co-eluting plasma matrix components do not appear to affect significantly the ionization of tenofovir and emtricitabine as well as IS.
5.8. Recovery
The % extraction recoveries at low, medium and high QC levels against the un-extracted aqueous samples were 92.6%, 92.9%, 92.0% and 88.6%, 87.6%, 87.9% respectively for tenofovir and emtricitabine. % mean recovery of tenofovir, emtricitabine and clonazepam was found over 92.5%, 88.0% and 94.6% respectively.
5.9. Ruggedness
The precision (% CV) and % accuracy values for different column were ranging from 2.1% to 5.1% and 99.6% to 107.1% for tenofovir and 3.5% to 4.1% and 99.2% to 106.1% for emtricitabine respectively at all four QC levels. For experiment with different analysts, the results for precision (% CV) and % accuracy were ranging from 1.6% to 4.7% and 100.6% to 106.8% for tenofovir and 1.2% to 5.2% and 101.3% to 104.3% for emtricitabine respectively at all four QC levels.
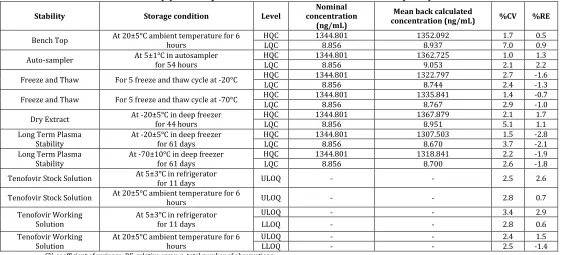
5.10. Stability
the same result during reinjection. Both tenofovir and emtricitabine were found stable in plasma for 61 days in deep freezer (at -20°C & -70°C).
Stock solutions of tenofovir, emtricitabine and clonazepam and working solutions of tenofovir and emtricitabine were stable for 6 hours at ambient temperature 20°C and for 11 days in refrigerator at 5°C respectively. The % CV were found ≤15% and % bias were found ±10%, when the stability samples peak area were compared with the peak area of fresh samples. Table 3 shows the complete summary of stability data for both analytes and IS.
6. CONCLUSION
LC-MS/MS is a powerful analytical tool with superior specificity and sensitivity, which is used in therapeutic drug monitoring. It offers a viable alternative to simple HPLC technology with UV detection and has the advantage of simultaneous measurement of drugs with high throughput. A relatively simple, accurate, precise and reproducible method suitable for use in pharmacokinetic/bioavailability/bioequivalence studies in human subjects to determine tenofovir and emtricitabine in plasma has been developed and validated.
Table 1(a): Summary of calibration curve with back calculated concentrations (Tenofovir)
Back calculated calibration curve concentrations (ng/mL)
r Value STD 1 STD 2 STD 3 STD 4 STD 5 STD 6 STD 7 STD 8
Nominal concentration
(ng/mL) 3.030 6.059 30.296 75.740 151.479 336.620 673.241 1512.901
1 3.033 6.076 29.611 76.333 147.201 340.220 686.482 1513.253 0.9998
2 2.999 6.215 29.300 77.016 148.434 342.948 691.893 1525.070 0.9997
3 3.040 6.031 28.544 75.077 144.723 334.415 674.708 1487.226 0.9999
4 3.021 6.198 29.010 76.161 146.732 338.943 683.755 1507.064 0.9996
5 2.901 5.904 28.512 75.239 145.177 335.662 677.378 1493.296 0.9993
Mean concentration
(ng/mL) 2.999 6.085 28.995 75.965 146.453 338.438 682.843 1505.182
SD 0.0568 0.1279 0.4768 0.8053 1.5152 3.4519 6.9286 15.2308
% CV 1.9 2.1 1.6 1.1 1.0 1.0 1.0 1.0
% Mean Accuracy 99.0 100.4 95.7 100.3 96.7 100.5 101.4 99.5
SD, standard deviation; CV, coefficient of variance
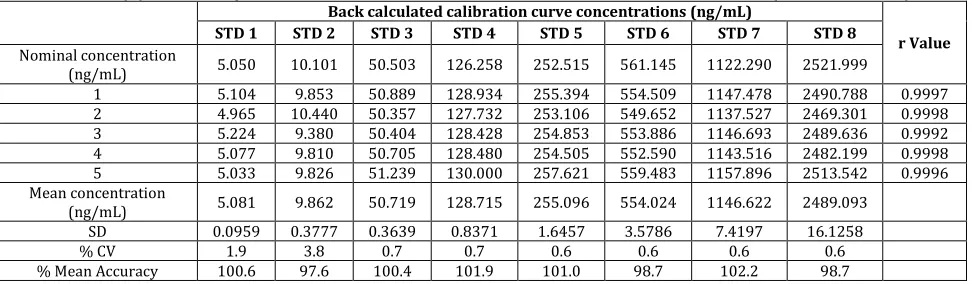
Table 1(b): Summary of calibration curve with back calculated concentrations (Emtricitabine)
Back calculated calibration curve concentrations (ng/mL)
r Value STD 1 STD 2 STD 3 STD 4 STD 5 STD 6 STD 7 STD 8
Nominal concentration
(ng/mL) 5.050 10.101 50.503 126.258 252.515 561.145 1122.290 2521.999
1 5.104 9.853 50.889 128.934 255.394 554.509 1147.478 2490.788 0.9997
2 4.965 10.440 50.357 127.732 253.106 549.652 1137.527 2469.301 0.9998
3 5.224 9.380 50.404 128.428 254.853 553.886 1146.693 2489.636 0.9992
4 5.077 9.810 50.705 128.480 254.505 552.590 1143.516 2482.199 0.9998
5 5.033 9.826 51.239 130.000 257.621 559.483 1157.896 2513.542 0.9996
Mean concentration
(ng/mL) 5.081 9.862 50.719 128.715 255.096 554.024 1146.622 2489.093
SD 0.0959 0.3777 0.3639 0.8371 1.6457 3.5786 7.4197 16.1258
% CV 1.9 3.8 0.7 0.7 0.6 0.6 0.6 0.6
% Mean Accuracy 100.6 97.6 100.4 101.9 101.0 98.7 102.2 98.7
Table 2(a): Summary of intra-batch and inter-batch precision and accuracy (Tenofovir)
Level Nominal Concentration (ng/mL) Intra-batch Inter-batch
n Mean back calculated concentration (ng/mL) a
%RE %CV n Mean back calculated concentration (ng/mL) b
%RE %CV
HQC 1344.801 6 1347.889 0.2 1.0 30 1356.979 0.9 1.1
MQC 75.309 6 75.233 -0.1 4.8 30 76.968 2.2 4.8
LQC 8.856 6 8.885 0.3 2.0 30 8.921 0.7 2.1
LLOQ QC 3.100 6 3.226 4.1 5.2 30 3.228 4.1 4.8
RE, relative error; CV, coefficient of variance; n, total number of observations. a Mean of 6 replicates at each concentration.
b Mean of 6 replicates for five precision and accuracy batches.
Table 2(b): Summary of intra-batch and inter-batch precision and accuracy (Emtricitabine)
Level Concentration Nominal
(ng/mL) Intra-batch Inter-batch
n
Mean back calculated concentration
(ng/mL) a
%RE %CV n
Mean back calculated concentration
(ng/mL) b
%RE %CV
HQC 1344.801 6 2309.799 3.0 4.0 30 2303.437 2.8 2.4
MQC 75.309 6 123.688 -1.5 5.5 30 125.304 -0.2 5.0
LQC 8.856 6 15.319 3.8 2.0 30 15.391 4.3 2.2
LLOQ QC 3.100 6 5.233 1.3 3.3 30 5.269 2.0 4.4
RE, relative error; CV, coefficient of variance; n, total number of observations. a Mean of 6 replicates at each concentration.
b Mean of 6 replicates for five precision and accuracy batches.
Table 3(a): Stability of Tenofovir under different conditions (n = 6)
Stability Storage condition Level concentration Nominal (ng/mL)
Mean back calculated
concentration (ng/mL) %CV %RE
Bench Top At 20±5°C ambient temperature for 6 hours HQC LQC 1344.801 8.856 1352.092 8.937 1.7 7.0 0.5 0.9
Auto-sampler At 5±1°C in autosampler for 54 hours HQC LQC 1344.801 8.856 1362.725 9.053 1.0 2.1 1.3 2.2
Freeze and Thaw For 5 freeze and thaw cycle at -20°C HQC LQC 1344.801 8.856 1322.797 8.744 2.7 2.4 -1.6 -1.3
Freeze and Thaw For 5 freeze and thaw cycle at -70°C HQC 1344.801 1335.841 1.4 -0.7
LQC 8.856 8.767 2.9 -1.0
Dry Extract At -20±5°C in deep freezer for 44 hours HQC LQC 1344.801 8.856 1367.879 8.951 2.1 5.1 1.7 1.1
Long Term Plasma
Stability At -20±5°C in deep freezer for 61 days
HQC 1344.801 1307.503 1.5 -2.8
LQC 8.856 8.670 3.7 -2.1
Long Term Plasma
Stability At -70±10°C in deep freezer for 61 days HQC LQC 1344.801 8.856 1318.841 8.700 2.2 2.6 -1.9 -1.8
Tenofovir Stock Solution At 5±3°C in refrigerator for 11 days ULOQ - - 2.5 2.6
Tenofovir Stock Solution At 20±5°C ambient temperature for 6 hours ULOQ - - 2.8 0.7
Tenofovir Working
Solution At 5±3°C in refrigerator for 11 days
ULOQ - - 3.4 2.9
LLOQ - - 2.8 0.6
Tenofovir Working
Solution At 20±5°C ambient temperature for 6 hours ULOQ LLOQ - - - - 2.4 2.5 -1.4 1.5
Table 3(b): Stability of Emtricitabine under different conditions (n = 6)
Stability Storage condition Level concentration Nominal (ng/mL)
Mean back calculated
concentration (ng/mL) %CV %RE
Bench Top At 20±5°C ambient temperature for 6 hours HQC LQC 2241.777 14.763 2306.956 14.969 3.6 3.0 2.9 1.4
Auto-sampler At 5±1°C in autosampler for 54 hours HQC 2241.777 2279.445 3.4 1.7
LQC 14.763 15.480 1.9 4.9
Freeze and Thaw For 5 freeze and thaw cycle at -20°C HQC LQC 2241.777 14.763 2202.626 14.577 2.3 3.2 -1.7 -1.3
Freeze and Thaw For 5 freeze and thaw cycle at -70°C HQC LQC 2241.777 14.763 2213.214 14.785 3.8 3.9 -1.3 0.2
Dry Extract At -20±5°C in deep freezer for 44 hours HQC LQC 2241.777 14.763 2230.929 14.945 3.1 1.9 -0.5 1.2 Long Term Plasma
Stability At -20±5°C in deep freezer for 61 days
HQC 2241.777 2198.304 2.7 -1.9
LQC 14.763 14.576 3.4 -1.3
Long Term Plasma Stability
At -70±10°C in deep freezer for 61 days
HQC 2241.777 2207.527 3.2 -1.5
LQC 14.763 14.625 3.1 -0.9
Emtricitabine Stock
Solution At 5±3°C in refrigerator for 11 days ULOQ - - 1.0 1.1
Emtricitabine Stock
Solution At 20±5°C ambient temperature for 6 hours ULOQ - - 2.1 3.7
Emtricitabine
Working Solution At 5±3°C in refrigerator for 11 days
ULOQ - - 1.7 0.6
LLOQ - - 2.0 -0.2
Emtricitabine
Working Solution At 20±5°C ambient temperature for 6 hours
ULOQ - - 1.5 2.4
LLOQ - - 1.2 1.1
CV, coefficient of variance; RE, relative error; n, total number of observations.
7. REFERENCES
1. Emau P, Jiang Y, Agy MB et al. Post-exposure prophylaxis for SIV revisited: Animal model for HIV infection. AIDS Res Ther 3: 29.
2006.doi:10.1186/1742-6405-3-29. PMC 1687192. PMID 17132170.
2. Gilead Sciences, Inc. Prescribing Information. Revised: November 2012. 3. Okwundu CI, Uthman OA and Okoromah
CAN. Antiretroviral pre-exposure prophylaxis (PrEP) for preventing HIV in high-risk individuals. Cochrane Database
Syst Rev (7):
CD007189. doi:10.1002/14651858.CD0071 89.pub3. PMID 22786505. 2012.
4. Patent US5977089 - Antiviral phosphonomethoxy nucleotide analogs having increased oral ... - Google Patents. 5. Blum M, Chittick G, Begley J and Zong J. J
Clin Pharmacol. 2007;47:751–759.
6. Gallant J, Dejesus E, Arribas J, Pozniak A, Gazzard B, Campo R, Lu B, McColl D, Chuck S, Enejosa J, Toole J and Cheng A. N Engl J Med. 2006;354:251–260.
7. Perry CM. Emtricitabine/tenofovir disoproxil fumarate: in combination with a protease inhibitor in HIV-1 infection. Drugs. 2009;69 (7):843-7. 8. Cohen J (December 2010). "HIV/AIDS
clinical trials. A powerful and perplexing
new HIV prevention
tool". Science 330 (6009): 1298-9. doi:10.1126/ science. 330.6001298-9.1298. PMID 21127220.
9. Delahunty T, Bushman L and Fletcher CV. J Chromatogr B. 2006;830:6–12.
10. Chantelle BH, Mary LC and Edward PA. Rapid Commun Mass SpectrUm. 2007;21:2087–2094.
11. Jullien V, Tréluyer JM, Pons G and Rey E. J Chromatogr B. 2003;785:377–381.
12. El Barkil M, Gagnieu MC and Guitton J. J Chromatogr B. 2007;855:192–197.
13. Sentenac S, Fernandez C, Thuillier A, Lechat P and Aymard G, J Chromatogr B. 2003;793:317–324.
14. Takahashi M, Kudaka Y, Okumura N, Hirano A, Banno K and Kaneda T, Biol Pharm Bull. 2007;30:1784–1786.
15. Notari S, Bocedi A, Ippolito G, Narciso P, Pucillo LP, Tossini G, Donnorso RP, Gasparrini F and Ascenzi P. J Chromatogr B. 2006;831:258–266.
16. Rebiere H, Mazel B, Civade C and Bonnet PA. J Chromatogr B. 2007;850:376–380.
17. Sparidans RW, Prins JM, Schellens JHM and Beijnen JH. Biomed Chromatogr. 2007;21:621–627.