RESEARCH
The impact of a disease management
programme for type 2 diabetes
on health-related quality of life: multilevel
analysis of a cluster-randomised controlled trial
Sigrid Panisch
1†, Tim Johansson
2†, Maria Flamm
2, Henrike Winkler
3, Raimund Weitgasser
4,5and Andreas C. Sönnichsen
6,7*Abstract
Background: Type 2 diabetes is a chronic disease associated with poorer health outcomes and decreased health related quality of life (HRQoL). The aim of this analysis was to explore the impact of a disease management pro-gramme (DMP) in type 2 diabetes on HRQoL. A multilevel model was used to explain the variation in EQ-VAS. Methods: A cluster-randomized controlled trial—analysis of the secondary endpoint HRQoL. Our study population were general practitioners and patients in the province of Salzburg. The DMP “Therapie-Aktiv” was implemented in the intervention group, and controls received usual care. Outcome measure was a change in EQ-VAS after 12 months. For comparison of rates, we used Fisher’s Exact test; for continuous variables the independent T test or Welch test were used. In the multilevel modeling, we examined various models, continuously adding variables to explain the variation in the dependent variable, starting with an empty model, including only the random intercept. We analysed random effects parameters in order to disentangle variation of the final EQ-VAS.
Results: The EQ-VAS significantly increased within the intervention group (mean difference 2.19, p = 0.005). There was no significant difference in EQ-VAS between groups (mean difference 1.00, p = 0.339). In the intervention group the improvement was more distinct in women (2.46, p = 0.036) compared to men (1.92, p = 0.063). In multilevel modeling, sex, age, family and work circumstances, any macrovascular diabetic complication, duration of diabetes, baseline body mass index and baseline EQ-VAS significantly influence final EQ-VAS, while DMP does not. The final model explains 28.9% (EQ-VAS) of the total variance. Most of the unexplained variance was found on patient-level (95%) and less on GP-level (5%).
Conclusion: DMP “Therapie-Aktiv” has no significant impact on final EQ-VAS. The impact of DMPs in type 2 diabetes on HRQoL is still unclear and future programmes should focus on patient specific needs and predictors in order to improve HRQoL.
Trial registration Current Controlled trials Ltd., ISRCTN27414162
Keywords: Cluster randomised controlled trial, Type 2 diabetes mellitus, Disease management programme, Health related quality of life (EQ-5D-3L questionnaire), Multilevel modeling, Sex-specific analysis
© The Author(s) 2018. This article is distributed under the terms of the Creative Commons Attribution 4.0 International License (http://creativecommons.org/licenses/by/4.0/), which permits unrestricted use, distribution, and reproduction in any medium, provided you give appropriate credit to the original author(s) and the source, provide a link to the Creative Commons license, and indicate if changes were made. The Creative Commons Public Domain Dedication waiver (http://creativecommons.org/ publicdomain/zero/1.0/) applies to the data made available in this article, unless otherwise stated.
Open Access
*Correspondence: [email protected]
Background
The prevalence of type 2 diabetes is increasing and the social and economic burden of this disease grows rap-idly [1, 2]. Guideline adherent, structured treatment and management of the disease as proposed by DMPs are the best strategies to prevent acute and chronic complications, while preserving a good quality of life [3, 4]. Several studies show that the quality of life in diabetes is decreased compared to individuals without diabetes [5] and HRQoL decreases with disease pro-gression and complications [6, 7]. Predictive factors for HRQoL are age, sex, low socioeconomic status (family and work circumstances, level of education, residential area), ethnicity, obesity, comorbidities, and any mac-rovascular diabetic complication [5, 7–12]. The preva-lence of type 2 diabetes is higher among women than among men. A recent meta-analysis demonstrated that women are at higher risk of developing both coronary heart disease and stroke compared to men [13, 14]. Increasing knowledge concerning HRQoL in diabetic patients, as well as the predictors, is crucial in improv-ing diabetes management. Overall, evidence from RCTs and systematic reviews on DMPs reveal only mod-est effects on patient care [3, 4], especially regarding improvement in clinically relevant endpoints such as HRQoL. We previously demonstrated that the Aus-trian DMP “Therapie-Aktiv” implemented by statu-tory health insurance improves process quality and enhances weight reduction, but did not significantly improve metabolic control (HbA1c) [15]. Participants in the German DMP for type 2 diabetes rated their HRQoL in the dimensions mobility, self-care and per-forming usual activities higher compared to patients in routine care [16]. Although studies are reporting the effect of DMPs on quality of life in diabetes patients [17–20], none of these interventions was designed as a structured, long-term programme implemented by statutory health insurance and conducted and evalu-ated as a randomized controlled trial. Enhancement of the understanding of HRQoL in diabetes and related risk factors is of great importance. We therefore stud-ied HRQoL in patients with type 2 diabetes participat-ing in the Austrian DMP “Therapie-Aktiv”.
Methods
Study aim
The aim of this study was to explore the impact of the Austrian DMP “Therapie-Aktiv” on HRQoL using the individual EQ-5D VAS and EQ-5D index in patients with type 2 diabetes. A multilevel model was used to identify variables that influence EQ-VAS and to assess its variation between patients, GPs and districts including a sex-specific analysis.
Study design
This work was based on a pragmatic cluster-randomized controlled trial of the Austrian DMP “Therapie-Aktiv” in the province of Salzburg, Austria. The trial was approved by the ethics committee of Salzburg and registered with current controlled trials Ltd. (ISRCTN27414162) on July 12, 2007. The methodology was described in our study protocol [21] and the main findings (significant improvement of process quality but no significant change in metabolic control after 1 year) have been published previously [15].
Setting of the study and characteristics of participants Participation in the study was offered to all 275 family physicians and specialists for internal medicine having a contract with the Salzburg statutory health insurance. All patients (> 18 years) with type 2 diabetes that fulfilled the WHO/ADA-criteria for diabetes diagnosis were eligible to participate in the study. The recruitment period was July 1st to October 31st of 2007. Exclusion criteria were dementia/psychiatric illness with inability to participate or to give informed consent, or known major consuming illness (i.e. advanced cancer).
Intervention
The Austrian DMP for type 2 diabetes “Therapie-Aktiv” [22] was developed in 2004 by the Austrian statutory health insurance. The programme aims to prevent diabe-tes complications and to improve quality of life through: (1) prevention and health promotion; (2) structured diag-nosis and medical treatment; (3) considering patients’ overall cardiovascular risk; and (4) stronger patient involvement. Patients must sign a participant consent form to be enrolled in the programme. The attending GPs administer the patient informed consent. Patients participate in an education course on type 2 diabe-tes where they learn how to manage their disease. They receive a “patient’s booklet” which deals with topics such as healthy lifestyle (e.g. nutrition, exercise), blood glucose management, diabetes medication, and preventable long term complications. “Therapie-Aktiv” includes five main components:
(1) Physician training consisting of an obligatory 10-h face to face course. This training was designed by the Austrian Diabetes Association, the Austrian Medical College and the Austrian Society for Gen-eral Practice. It comprised an update in diabetes care, current guidelines of the Austrian Diabetes Association and practice management training; (2) Patient education consisting of 9 h face to face
Medicine Salzburg (Arbeitskreis Vorsorgemedizin Salzburg) using the “Düsseldorfer Modell” curricu-lum [23];
(3) Quarterly patient-physician encounters of 15–20 min duration to discuss the results of labo-ratory tests (HbA1c, eGFR, microalbumine) and physical examination (BMI, blood pressure, foot examination, neurological examination) and deter-mine treatment goals for the next quarter year, including standardised documentation of physical examination, laboratory findings and diabetes com-plications in a DMP case report form once a year [22];
(4) Structured interdisciplinary care according to the guidelines of the Austrian Diabetes Association [24]; and
(5) Agreement on therapeutic goals in a shared patient–physician decision-making process. These agreements are signed by the patient and physician every third month.
In the control group, physicians performed usual care.
Data collection
Baseline and follow-up data were collected by the responsible GP. Standardised documentation of physical examination and laboratory findings in a DMP-form was performed once a year. The DMP form was administered in both study groups. Patients’ education and occupa-tional status, smoking status, living situation, naoccupa-tional- national-ity, macrovascular diabetic complications (i.e. myocardial infarction, PTCA/stenting, coronary bypass, stroke, carotid surgery, amputation/gangrene, peripheral artery bypass or PTA), and self-rated HRQoL (EQ-5D-3L) were assessed by a standardised questionnaire. Follow-up data were collected after 12 months intervention.
Outcomes and statistical analysis
We used the EQ-5D-3L to evaluate the self-rated HRQoL [25, 26]. The EQ-5D-3L consists of two parts: the EQ-5D descriptive system and the EQ visual analogue scale (EQ-VAS). The EQ-5D-3L descriptive system comprises five dimensions: mobility, self-care, usual activities, pain/ discomfort and anxiety/depression. Each dimension has three levels: no problems, some problems, extreme problems. The EQ-index score is calculated based on the results of the five dimensions by using a scoring algo-rithm. The EQ-VAS records the respondent’s self-rated health on a vertical thermometer-like scale (0–100) where the endpoints are labelled worst imaginable health state’ and ‘best imaginable health state’. Following the user’s guide of the EuroQol Group [26], ambiguous scores were treated as missing. Results were reported
according to recent guidelines [27]. For comparison of rates, we used Fisher’s Exact Test; for continuous vari-ables we used the independent T-Test or Welch-Test. To assess changes over the study period of 1 year and in order to find factors that influence HRQoL outcomes, we analysed changes of EQ-VAS and EQ-index within and between groups, using repeated measures general linear model. Patients with at least 300 days of study duration and with two valid EQ-VAS scores (baseline and follow-up) were included in the analysis. In order to evaluate the final HRQoL we identified variables that explain some of the variation in final EQ-VAS and EQ-index as well as to assess their variation at different levels within a multilevel framework. We further incorporated sex-specific vari-ables and examined the effect of living situation (living alone or not), education and occupational status (fulltime work or not), nationality (Austrian or not), any manifes-tation of coronary heart disease (myocardial infarction and/or PTCA/stenting and/or coronary bypass), any macrovascular diabetic complication (myocardial infarc-tion and/or PTCA/stenting and/or coronary bypass and/ or stroke and/or carotid surgery and/or amputation/gan-grene and/or peripheral artery bypass or PTA) as they are known to potentially influence HRQoL within a dia-betic population. We analysed educational level as low (no school leaving examination) or high (school leaving examination or higher). A full guideline adherence treat-ment covered four aspects: patient education, diagnostic measures (i.e. regular HbA1c-checks), ophthalmological examination, and foot examinations.
of the final EQ-VAS. For analyses we used IBM© SPSS© Statistics Version 19 and MLWiN 2.13 [28].
Results
Characteristics of the study population
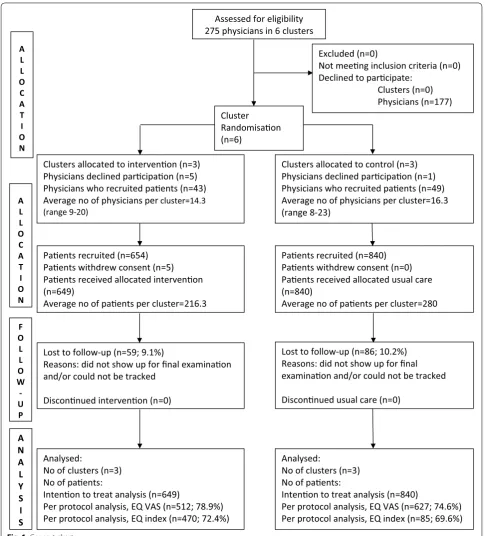
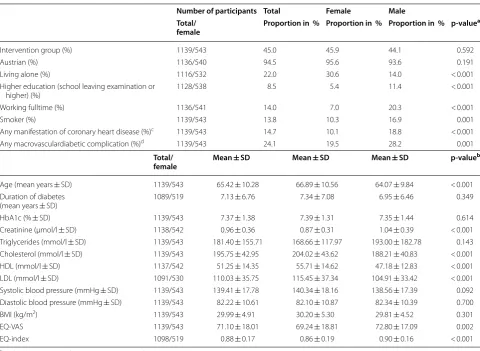
Ninety-two (33.5%) physicians participated and recruited 1489 patients in the province of Salzburg, Austria. Three hundred fifty patients were excluded from analysis (328 patients did not report two valid EQ-VAS scores and fur-ther 22 patients had a study period of less than 300 days). No significant differences were shown in baseline char-acteristics between included (n = 1139) and excluded (n = 350) patients. The mean length of the study period was 398 days (SD 42). EQ-VAS was available in 512 (78.9%) participants in the intervention group and in 627 (74.6%) controls (Fig. 1). There were no relevant demo-graphic differences between intervention and control group at baseline (Additional files 1 and 2). There were significant differences in baseline data disaggregated by sex (Table 1). In various subgroups there were significant differences in EQ-VAS (Table 2), EQ-index, and EQ five dimensions (Additional files 3, 4, 5).
Outcomes—univariate analysis
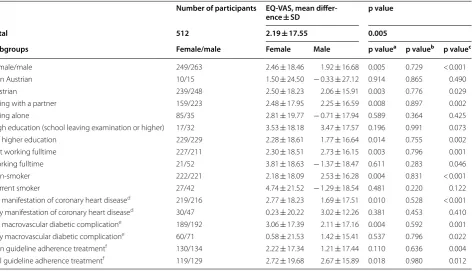
In univariate analysis, the EQ-VAS improved within both groups. It increased by 2.19 points (p = 0.005) in the intervention group and by 1.18 points (p = 0.094) in controls. The mean difference (1.00) between interven-tion and control group was not significant (p = 0.339). In the intervention group the improvement was stronger in women (2.46, p = 0.036) compared to men (1.92, p = 0.063). Significant differences in EQ-VAS scores were found in various subgroups within the intervention group (Table 3). The EQ-index score hardly changed during the study period, so no multilevel analysis was performed for the EQ-index. The mean difference within the interven-tion group was 0.00 (p = 0.612) (Additional file 6).
Outcomes—multilevel analysis
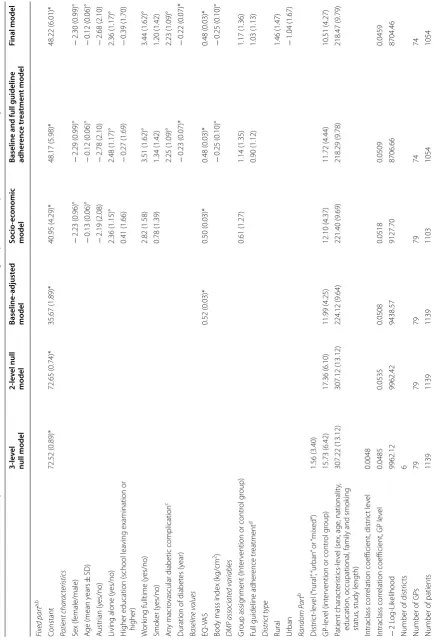
Most of the variance was found on patient-level (approxi-mately 95%). The GP-level (intervention or control group) and district-level (“rural”, “urban” or “mixed”) had only a modest (5%) or no impact (0%). Due to the negligible impact of district-level and the restricted number of dis-tricts (n = 6), we decided to continue with two levels, GP-level and patient-GP-level. The results of the empty model (“2-level null model”) and the baseline-adjusted model for two levels (“baseline-adjusted”) are presented in Table 4. Adding the baseline score accounted for 27.0% of the within GP-level variability in the EQ-VAS final score, and 30.9% of the variation in means across GPs could be attributed to differences in the baseline score of patients nested in these GP-surgeries. We continued adding
variables in the fixed part of the model to examine vari-ation in final EQ-VAS. First, we included patient charac-teristics (sex, age, nationality, education, occupational, family and smoking status, and study duration) as well as group association. The parameter estimate for study duration was negligible (0.01, SE 0.01), hence we pre-sent the results of this model (“socio-economic”) with-out adjusting for study length. Age, living alone, female sex and baseline EQ-VAS have a significant and nega-tive impact on final EQ-VAS. The enrolment in the DMP had no significant impact on final EQ-VAS (p = 0.646). Adding diabetes associated parameters, led to a slight decrease of unexplained variance. In patients with any macrovascular diabetic complication and longer diabe-tes duration the final EQ-VAS was significantly reduced (p = 0.021 and p = 0.002, respectively). Any manifestation of coronary heart disease had no significant impact on the final EQ-VAS. Subsequently, we adjusted for signifi-cant baseline differences (cholesterol, BMI) and guideline adherence. The addition of further variables consecu-tively reduced the amount of unexplained variance. How-ever, the allocation of variation did not change much. In all models, the intraclass correlation coefficient on GP-level amounted to approximately 5%. Since baseline EQ-VAS was significantly related to the dependent variable, we checked whether the slope varied randomly across GPs. However, adding the random slope hardly changed parameter estimates and slope variance was not signifi-cant. Composition effects did not exist for EQ-VAS. In the final model, the final EQ-VAS score in the interven-tion group was on average 1.17 points higher compared to controls (while retaining all variables unchanged), however not significant (p = 0.390).
The final model explains 28.9% (EQ-VAS) of the total variance. Our multilevel analysis demonstrates that approximately 95% of the residual variation in final VAS is attributable to patient-level, with baseline EQ-VAS showing to be positively associated with the final score. Most of the unexplained variance can be found on patient-level (approximately 95%) and less on GP-level (approximately 5%).
Discussion
Main findings
This is the first study analysing the impact of a DMP implemented by statutory public health insurance on HRQoL in patients with type 2 diabetes in a cluster ran-domised controlled trial. A further aim was to evaluate HRQoL within a multilevel framework as a result of the cluster-design. A special focus was put on a sex-specific analysis.
women than in men. This effect was not present when comparing mean differences between the intervention and control group. This may at least partly be due to a Hawthorne-effect in the control group mitigating the suc-cess of the intervention, but even when taking this into
account the effect of the DMP on HRQoL is small and hardly of clinical relevance (see discussion of minimal important difference of EQ-VAS below). As the DMP also did not have a significant effect on metabolic control, and the observation period of one year was too short to detect
Assessed for eligibility 275 physicians in 6 clusters
Excluded (n=0)
Not meeng inclusion criteria (n=0) Declined to parcipate:
Clusters (n=0) Physicians (n=177)
Analysed:
No of clusters (n=3) No of paents:
Intenon to treat analysis (n=649)
Per protocol analysis, EQ VAS (n=512; 78.9%) Per protocol analysis, EQ index (n=470; 72.4%) Lost to follow-up (n=59; 9.1%)
Reasons: did not show up for final examinaon and/or could not be tracked
Disconnued intervenon (n=0) Paents recruited (n=654) Paents withdrew consent (n=5) Paents received allocated intervenon (n=649)
Average no of paents per cluster=216.3
Lost to follow-up (n=86; 10.2%) Reasons: did not show up for final examinaon and/or could not be tracked
Disconnued usual care (n=0) Paents recruited (n=840) Paents withdrew consent (n=0) Paents received allocated usual care (n=840)
Average no of paents per cluster=280
Analysed:
No of clusters (n=3) No of paents:
Intenon to treat analysis (n=840)
Per protocol analysis, EQ VAS (n=627; 74.6%) Per protocol analysis, EQ index (n=85; 69.6%) Cluster
Randomisaon (n=6)
Clusters allocated to intervenon (n=3) Physicians declined parcipaon (n=5) Physicians who recruited paents (n=43) Average no of physicians percluster=14.3 (range 9-20)
Clusters allocated to control (n=3) Physicians declined parcipaon (n=1) Physicians who recruited paents (n=49) Average no of physicians per cluster=16.3 (range 8-23)
F O L L O W -U P A L L O C A T I O N A L L O C A T I O N
A N A L Y S I S
any effect regarding clinical endpoints, a large impact on HRQoL of this DMP-programme directed mainly at the improvement of process quality may not be expected. In our multilevel model we demonstrated that sex, age, fam-ily and work circumstances, any macrovascular diabetic complication, duration of diabetes, baseline body mass index and baseline VAS significantly influence EQ-VAS at follow-up, while DMP “Therapie-Aktiv” does not. Our results confirm that effects are easily overestimated in the absence of a control group, as also shown in a pre-vious study [29]. While changes showed to be significant in many subpopulations of the intervention group, this effect disappeared after putting it in relation to the control group. Significant differences were found in the baseline data disaggregated by sex (Table 1) and in various sub-groups (Table 2). For the EQ-VAS, men reported to have better HRQoL in comparison to women. However, some
of the differences might be affected by social desirability bias: men are probably less likely to admit deficits in qual-ity of life than women. In pre-post analysis, DMP patients with higher education exhibited the greatest improve-ment, whereas higher educated controls showed the worst development among all subgroups. Considering these results, the design and development of effective DMPs remains an important—yet open—issue [17, 30], and it may be concluded that “Therapie aktiv” needs to be inten-sified and targeted at outcome quality to be effective.
When analysing our results it also has to be kept in mind that although a multilevel model was used to assess final EQ-VAS variation between patients, GPs and dis-tricts, almost all variation (approximately 95%) in final EQ-VAS was attributable to variables at the patient-level (e.g. age, sex, family and occupational status, duration of diabetes, baseline BMI and baseline EQ-VAS).
Table 1 Baseline characteristics disaggregated by sex (per protocol analysis population)
a Fisher’s exact test or Chi Square-Test, respectively b Independent T Test or Mann–Whitney-Test, respectively
c Myocardial infarction and/or PTCA/stenting and/or coronary bypass
d Myocardial infarction and/or PTCA/stenting and/or coronary bypass and/or stroke and/or carotid surgery and/or amputation/gangrene and/or peripheral artery bypass or PTA
Number of participants Total Female Male
Total/
female Proportion in % Proportion in % Proportion in % p-value
a
Intervention group (%) 1139/543 45.0 45.9 44.1 0.592
Austrian (%) 1136/540 94.5 95.6 93.6 0.191
Living alone (%) 1116/532 22.0 30.6 14.0 < 0.001
Higher education (school leaving examination or
higher) (%) 1128/538 8.5 5.4 11.4 < 0.001
Working fulltime (%) 1136/541 14.0 7.0 20.3 < 0.001
Smoker (%) 1139/543 13.8 10.3 16.9 0.001
Any manifestation of coronary heart disease (%)c 1139/543 14.7 10.1 18.8 < 0.001
Any macrovasculardiabetic complication (%)d 1139/543 24.1 19.5 28.2 0.001
Total/
female Mean ± SD Mean ± SD Mean ± SD p-value
b
Age (mean years ± SD) 1139/543 65.42 ± 10.28 66.89 ± 10.56 64.07 ± 9.84 < 0.001
Duration of diabetes
(mean years ± SD) 1089/519 7.13 ± 6.76 7.34 ± 7.08 6.95 ± 6.46 0.349
HbA1c (% ± SD) 1139/543 7.37 ± 1.38 7.39 ± 1.31 7.35 ± 1.44 0.614
Creatinine (µmol/l ± SD) 1138/542 0.96 ± 0.36 0.87 ± 0.31 1.04 ± 0.39 < 0.001
Triglycerides (mmol/l ± SD) 1139/543 181.40 ± 155.71 168.66 ± 117.97 193.00 ± 182.78 0.143
Cholesterol (mmol/l ± SD) 1139/543 195.75 ± 42.95 204.02 ± 43.62 188.21 ± 40.83 < 0.001
HDL (mmol/l ± SD) 1137/542 51.25 ± 14.35 55.71 ± 14.62 47.18 ± 12.83 < 0.001
LDL (mmol/l ± SD) 1091/530 110.03 ± 35.75 115.45 ± 37.34 104.91 ± 33.42 < 0.001
Systolic blood pressure (mmHg ± SD) 1139/543 139.41 ± 17.78 140.34 ± 18.16 138.56 ± 17.39 0.092
Diastolic blood pressure (mmHg ± SD) 1139/543 82.22 ± 10.61 82.10 ± 10.87 82.34 ± 10.39 0.700
BMI (kg/m2) 1139/543 29.99 ± 4.91 30.20 ± 5.30 29.81 ± 4.52 0.301
EQ-VAS 1139/543 71.10 ± 18.01 69.24 ± 18.81 72.80 ± 17.09 0.002
Table 2 EQ-VAS at baseline, values for selected subgroups (intention-to-treat analysis population)
a Independent T Test or Welch-Test, respectively
b Myocardial infarction and/or PTCA/stenting and/or coronary bypass
c Myocardial infarction and/or PTCA/stenting and/or coronary bypass and/or stroke and/or carotid surgery and/or amputation/gangrene and/or peripheral artery bypass or PTA
Subgroup 1/subgroup 2 No of participants, subgroup
1/sub-group 2 EQ-VAS,mean [CI], subgroup 1 EQ-VAS,mean [CI], subgroup 2 p value
a
Overall study population 1464 70.1 [69.1;71.0] –
Intervention/control 639/825 69.4 [68.0;70.8] 70.6 [69.3;71.8] 0.231
Female/male 700/764 68.4 [67.0;69.8] 71.6 [70.3;72.8] 0.001
No manifestation of coronary heart
diseaseb/
any manifestation of coronary heart disease
1253/211 70.6 [69.6;71.6] 66.6 [64.1;69.2] 0.003
No macrovascular diabetic complicationc/
any macrovascular diabetic complication 1108/356 71.4 [70.3;72.4] 66.0 [64.1;68.0] < 0.001
Living with a partner/
living alone 1111/318 71.0 [69.9;72.0] 66.8 [64.8;68.8] < 0.001
Non Austrian/Austrian 80/1377 65.1 [60.6;69.7] 70.3 [69.4;71.3] 0.029
No higher education/
higher education 1327/117 69.9 [68.9;70.9] 72.1 [68.9;75.4] 0.202
Working fulltime/
not working fulltime 1255/202 69.7 [68.7;70.7] 72.4 [69.9;74.9] 0.050
Table 3 EQ-VAS in the intervention group at follow-up, various subgroups disaggregated by sex
a Within-subject factor (time) b Within-subject factor (time*sex) c Between subject factors (sex)
d Myocardial infarction and/or PTCA/stenting and/or coronary bypass
e Myocardial infarction and/or PTCA/stenting and/or coronary bypass and/or stroke and/or carotid surgery and/or amputation/gangrene and/or peripheral artery bypass or PTA
f A full guideline adherence treatment covered four aspects: patient education; diagnostic measures (i.e. regular HbA1c-checks); ophthalmological and foot examinations
Number of participants EQ-VAS, mean
differ-ence ± SD p value
Total 512 2.19 ± 17.55 0.005
Subgroups Female/male Female Male p valuea p valueb p valuec
Female/male 249/263 2.46 ± 18.46 1.92 ± 16.68 0.005 0.729 < 0.001
Non Austrian 10/15 1.50 ± 24.50 − 0.33 ± 27.12 0.914 0.865 0.490
Austrian 239/248 2.50 ± 18.23 2.06 ± 15.91 0.003 0.776 0.029
Living with a partner 159/223 2.48 ± 17.95 2.25 ± 16.59 0.008 0.897 0.002
Living alone 85/35 2.81 ± 19.77 − 0.71 ± 17.94 0.589 0.364 0.425
High education (school leaving examination or higher) 17/32 3.53 ± 18.18 3.47 ± 17.57 0.196 0.991 0.073
No higher education 229/229 2.28 ± 18.61 1.77 ± 16.64 0.014 0.755 0.002
Not working fulltime 227/211 2.30 ± 18.51 2.73 ± 16.15 0.003 0.796 0.001
Working fulltime 21/52 3.81 ± 18.63 − 1.37 ± 18.47 0.611 0.283 0.046
Non-smoker 222/221 2.18 ± 18.09 2.53 ± 16.28 0.004 0.831 < 0.001
Current smoker 27/42 4.74 ± 21.52 − 1.29 ± 18.54 0.481 0.220 0.122
No manifestation of coronary heart diseased 219/216 2.77 ± 18.23 1.69 ± 17.51 0.010 0.528 < 0.001
Any manifestation of coronary heart diseased 30/47 0.23 ± 20.22 3.02 ± 12.26 0.381 0.453 0.410
No macrovascular diabetic complicatione 189/192 3.06 ± 17.39 2.11 ± 17.16 0.004 0.592 0.001
Any macrovascular diabetic complicatione 60/71 0.58 ± 21.53 1.42 ± 15.41 0.537 0.796 0.022
Non guideline adherence treatmentf 130/134 2.22 ± 17.34 1.21 ± 17.44 0.110 0.636 0.004
Table 4 EQ -V AS, fix ed and random par t r esults of selec ted models , in ter ven tion- and c on tr ol gr oup a t f ollo w up (multile vel modeling) 3-lev el null model 2-lev el null model Baseline -adjust ed model Socio -ec onomic model Baseline and full guideline adher enc e tr ea tmen t model Final model Fix ed par t a,b Constant 72.52 (0.89)* 72.65 (0.74)* 35.67 (1.89)* 40.95 (4.29)* 48.17 (5.98)* 48.22 (6.01)* Patient char acteristics Sex (f emale/male) − 2.23 (0.96)° − 2.29 (0.99)° − 2.30 (0.99)° A
ge (mean y
ears ± SD) − 0.13 (0.06)° − 0.12 (0.06)° − 0.12 (0.06)° A ustr ian (y es/no) − 2.19 (2.08) − 2.78 (2.10) − 2.68 (2.10)
Living alone (y
es/no)
2.36 (1.15)°
2.48 (1.17)°
2.36 (1.17)°
H
igher education (school lea
ving examination or
higher) 0.41 (1.66) − 0.27 (1.69) − 0.39 (1.70) W or
king fulltime (y
es/no) 2.82 (1.58) 3.51 (1.62)° 3.44 (1.62)° Smok er (y es/no) 0.78 (1.39) 1.34 (1.42) 1.20 (1.42) An y macr ovascular diabetic complication c 2.25 (1.09)° 2.23 (1.09)°
Duration of diabet
es (y ear) − 0.23 (0.07)* − 0.22 (0.07)* Baseline v alues EQ -V AS 0.52 (0.03)* 0.50 (0.03)* 0.48 (0.03)* 0.48 (0.03)*
Body mass index (k
g/cm 2) − 0.25 (0.10)° − 0.25 (0.10)°
DMP associated v
ariables Gr oup assig nment (I nt er
vention or contr
ol g
roup)
0.61 (1.27)
1.14 (1.35)
1.17 (1.36)
Full guideline adher
ence tr eatment d 0.90 (1.12) 1.03 (1.13) D istrict t ype Rural 1.46 (1.47) Ur ban − 1.04 (1.67) Random P ar t b Distr ic t-le vel (“rural ”, “ ur ban
” or “
mix ed ”) 1.56 (3.40) GP -le vel (int er
vention or contr
ol g roup) 15.73 (6.42) 17.36 (6.10) 11.99 (4.25) 12.10 (4.37) 11.72 (4.44) 10.51 (4.27) Patient charac ter istics-le
vel (sex, age
, nationalit
y,
education, occupational
, family and smok
ing
status
, study length)
307.22 (13.12) 307.12 (13.12) 224.12 (9.64) 221.40 (9.69) 218.29 (9.78) 218.47 (9.79) Intraclass cor
relation coefficient, distr
ic
t le
vel
0.0048
Intraclass cor
relation coefficient, GP le
vel 0.0485 0.0535 0.0508 0.0518 0.0509 0.0459 − 2 Log-Lik elihood 9962.12 9962.42 9438.57 9127.70 8706.66 8704.46
Number of distr
ic
ts
6
Number of GP
s 79 79 79 79 74 74
Number of patients
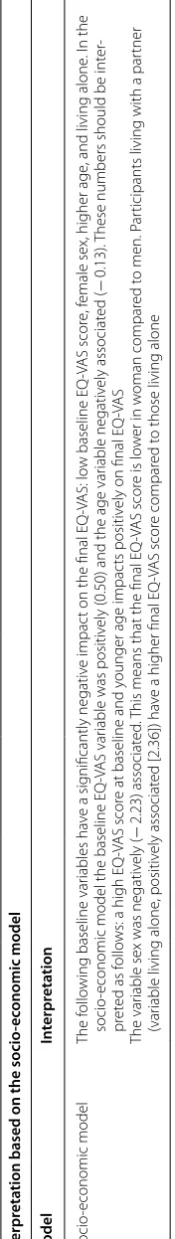
Table 4 c on tinued In terpr eta
tion based on
the socio -ec onomic model M odel In terpr eta tion S ocio -economic model The f ollo
wing baseline var
iables ha
ve a sig
nificantly negativ
e impac
t on the final EQ
-V
AS: lo
w baseline EQ
-V
AS scor
e, f
emale sex, higher age
, and living alone
. I
n the
socio
-economic model the baseline EQ
-V
AS var
iable was positiv
ely (0.50) and the age var
iable negativ
ely associat
ed (
−
0.13).
These numbers should be int
er
-pr
et
ed as f
ollo
ws: a high EQ
-V
AS scor
e at baseline and y
ounger age impac
ts positiv
ely on final EQ
-V
AS
The var
iable sex was negativ
ely (
−
2.23) associat
ed
. T
his means that the final EQ
-V
AS scor
e is lo
w
er in w
oman compar
ed t
o men. P
ar
ticipants living with a par
tner
(var
iable living alone
, positiv
ely associat
ed [2.36]) ha
ve a higher final EQ
-V
AS scor
e compar
ed t
o those living alone
a F
or the fix
ed par
t r
esults ° and * r
epr esen t sig nifican t r esults a
t the 5 and 1% lev
el
, r
espec
tiv
ely
b Standar
d er
rors ar
e in par
en
thesis
c M
yocar
dial infar
ction and/or PT
C
A/st
en
ting and/or c
or
onar
y b
ypass and/or str
oke and/or car
otid sur
ger
y and/or amputa
tion/gang
rene and/or per
ipher
al ar
ter
y b
ypass or PT
A
d A full guideline adher
enc e tr ea tmen t c ov er ed f our aspec ts: pa tien t educa tion; diag nostic measur es (i.e . r egular H bA1c -checks); oph thalmolog
ical and f
oot examina
Strengths and limitations
Our trial is characterised by a high level of internal valid-ity. Minor limitations regarding its external validity exist. As pointed out previously [15], due to a volunteer-based enrolment strategy, GPs might have recruited “healthier” and more compliant patients. Hence, it is questionable whether our sample accurately represents the population from which it was recruited. However, this might also reflect healthier patient characteristics in primary care settings.
We are aware of the limitations of the EuroQol tool (EQ-5D-3L) and of its use to evaluate HRQoL. Some researchers point out that the EQ-5D-3L rather measures quality of health [6, 31]; while others have shown that it is an appropriate tool to evaluate HRQoL among others in patients with type 2 diabetes [32–34]. Furthermore, the restricted number of levels of the EQ-5D can be criti-cised. However in 2007, when the Austrian DMP “Thera-pie-Aktiv” was rolled out, the latest version of the EQ-5D (five levels) [26], was not yet available.
There is a lack of data regarding minimal important dif-ference on EQ-VAS in diabetes patients. Minimal impor-tant difference estimates on EQ-5D VAS ranged from 8 to 12 point scores in cancer patients [35]. It is question-able if an improvement of 2.19 points in our diabetes population is clinically relevant. Twelve months follow-up might have been too short in order to demonstrate greater improvements and moreover we know that the HRQoL decreases with disease progression and compli-cations [6, 7].
We did not assess psychosocial comorbidities like depression which can be a significant confounder regard-ing HRQoL, because it was not part of the regular DMP-assessment of the Austrian “Therapie aktiv”. We assume, though, that these comorbidities are evenly distributed between intervention and control group due to randomi-zation and do not affect the main result of our study (i.e. lack of a significant difference regarding HRQoL between intervention and control).
We used a multilevel model to assess final EQ-VAS variation between patients, GPs and districts taking into account possible predictive factors. Most of the varia-tion (approx. 95%) could be observed on patient-level, whereas only little was attributable to GP (approx. 5%) or district (< 0.1%) level. In our data, only a restricted num-ber of GP-level characteristics was available. However, the variation on GP-level was small. Hence, adding addi-tional variables on GP-level or district-level would not have changed the overall picture. The choice of variables used in subgroup analysis and multilevel modeling was based on our baseline-analysis, and on previous studies [5, 7–12] that identified age, sex, family and work cir-cumstances, level of education, residential area, ethnicity,
and any macrovascular diabetic complication, as possi-ble predictive factors for HRQoL. We are well aware of the problems and limitations of exploratory subgroup analysis/multiple testing and the loss of power involved. However, we wanted to present some of the material as a possible basis for further research and for future develop-ment of DMPs.
Comparison with existing literature
A wide variety of educational, self-management, and structured care interventions with the aim to improve HRQoL in diabetic populations exists [16–18, 36–45]. Still, high quality randomized controlled trials are rare and little is known on the impact of DMPs on HRQoL [46]. Some studies demonstrated improvement in HRQoL [16–18, 36, 40, 43] and others did not [37–39, 44, 45]. Commonly, methodological and statistical het-erogeneity exist (e.g. poor or missing randomisation, high dropout rates, pre-post comparisons, small sample size). Additionally, differences are present in composition and complexity of interventions. Duration of follow up and outcome measures are heterogeneous and hence difficult to compare. The effects seem to be largely dependent on the individual programme and its particular design [46].
Implications for practice and future research
A major drawback of disease management programmes is that they probably do not reach a considerable num-ber of higher risk patients [47]. Our results suggest that further development of DMPs in the sense of especially focusing on patients’ needs is necessary. Future research should focus on how to recruit high risk patients and how to promote patient-centred self-management and adherence to such a programme. There is a trend in Europe towards patient-centred self-management of dia-betes in the primary care context. The professional role of diabetes specialist nurses, the need for multidiscipli-nary approaches and a focus on patient education emerge as fundamental principles in the design of relevant pro-grammes [48], which should be strengthened in DMPs.
nationality, and are suffering from any macrovascular diabetic complication start off with lower EQ-VAS scores (up to five points below the average). This may also apply to other subgroups like patients with specific comorbidi-ties (e.g. depression) not addressed in our study. Hence attention of future DMPs should especially focus on these subgroups.
Conclusion
In this cluster randomised controlled trial, the Austrian DMP “Therapie-Aktiv” showed no significant impact on EQ-VAS or EQ-index when compared to usual care although the EQ-VAS increased significantly within the intervention group. Our multilevel model to assess final EQ-VAS variation by patient-level, GPs’ group assign-ment and district-level demonstrated that age, sex, fam-ily and occupational status, duration of diabetes, baseline BMI and baseline EQ-VAS have a significant impact on EQ-VAS at follow-up. Almost all variation was attribut-able to patient-level. Future research and development of DMPs should focus on subgroups with lower HRQoL, patient needs, and predictors of HRQoL in order to maintain or improve HRQoL.
Key message
• The EQ-VAS increased significantly within the inter-vention group and the improvement was stronger in women compared to men. This effect was not present in group comparison.
• The multilevel model demonstrated that sex, age, family and work circumstances, existence of any macrovascular diabetic complication, duration of diabetes, baseline body mass index and baseline EQ-VAS significantly influence EQ-EQ-VAS at follow-up.
• Future evaluations of the impact of DMPs on HRQoL in type 2 diabetes should incorporate predictors of HRQoL such as sex, age, socioeconomic status, coro-nary heart disease, and macrovascular diabetes com-plications in their analysis.
Additional files
Additional file 1. Baseline data (intention-to-treat analysis population). Additional file 2. Baseline data disaggregated by sex (intention-to-treat analysis population).
Additional file 3. Baseline data, EQ-VAS subgroup analysis (per protocol analysis population).
Additional file 4. Baseline data, EQ-index subgroup analysis. Additional file 5. Baseline data EQ-5 dimensions disaggregated by sex. Additional file 6. EQ-index in the intervention group at follow-up, vari-ous subgroups disaggregated by sex.
Abbreviations
BMI: body mass index; DMP: disease management programme; GP: general practitioner; HRQoL: health related quality of life; RCT: randomized controlled trial; SGKK: Salzburger Gebietskrankenkasse (in English, the statutory public health insurance of the province of Salzburg).
Authors’ contributions
SP: contributed substantially in writing this paper, performed the statistical analyses and interpretation of the data, and supervised the maintenance and quality assurance of the data. TJ: contributed substantially in writing this paper as well as in the interpretation of the data, and contributed to data acquisition. MF: contributed to writing this paper, interpretation of the data, and critically revised the manuscript. HW: contributed to the conception and design of the study, as well as data acquisition, and critically revised the manuscript. RW: contributed to the conception and design of the study, and critically revised the manuscript. ACS: developed the study idea, contributed substantially in writing the study protocol, supervised the writing of this paper, and was in charge of carrying out the study. All authors read and approved the final manuscript.
Author details
1 Department of Mathematics, University of Salzburg, Hellbrunner Str. 34, 5020 Salzburg, Austria. 2 Institute of General Practice, Family Medicine and Preventive Medicine, Paracelsus Medical University, Salzburg, Struber-gasse 21, 5020 Salzburg, Austria. 3 Paris Lodron University, Kapitelgasse 4-6, 5020 Salzburg, Austria. 4 Department of Internal Medicine, Wehrle-Diakonissen Hospital, Haydnstrasse 18, 5020 Salzburg, Austria. 5 Paracelsus Medical Uni-versity, Strubergasse 21, 5020 Salzburg, Austria. 6 Institute of General Practice and Family Medicine, Witten/Herdecke University, Alfred-Herrhausen-Straße 50, 58448 Witten, Germany. 7 Division of Population Health, Health Services Research and Primary Care, School of Health Sciences, University of Manches-ter, Oxford Rd, Manchester M13 9PL, UK.
Acknowledgements
We would like to express our gratitude to all the participating physicians of the province of Salzburg and their teams.
Competing interests
The authors declare that they have no competing interests.
Availability of data and materials
The datasets analysed in the current study are available from the correspond-ing author upon reasonable request. All data generated or analysed durcorrespond-ing this study are included in this published article [and its additional information files].
Consent for publication Not applicable.
Ethics approval and consent to participate
Approval received from the Ethics Commission of the Province of Salzburg, Austria on the 28th February 2007 (ref: 415-E779/2-2007). All patients willing to participate were included in the study after informed consent according to the declaration of Helsinki was given.
Funding
This study was financed primarily by the Institute of General Practice, Family Medicine and Preventive Medicine of the Paracelsus Medical University, Salzburg. We received additional funding by the statutory public health insur-ance of the province of Salzburg (Salzburger Gebietskrankenkasse, SGKK), the Salzburg Savings Bank (Salzburger Sparkasse) and Roche Diagnostics Austria. We would like to thank our sponsors for these grants. The sponsors were not involved in the realisation of the study, data processing or evaluation.
Publisher’s Note
Received: 11 January 2018 Accepted: 28 March 2018
References
1. Engelgau MM, Geiss LS, Saaddine JB, Boyle JP, Benjamin SM, Gregg EW, et al. The evolving diabetes burden in the United States. Ann Intern Med. 2004;140(11):945–50.
2. King H, Aubert RE, Herman WH. Global burden of diabetes, 1995-2025: prevalence, numerical estimates, and projections. Diabetes Care. 1998;21(9):1414–31.
3. Ofman JJ, Badamgarav E, Henning JM, Knight K, Gano AD Jr, Levan RK, et al. Does disease management improve clinical and economic out-comes in patients with chronic diseases? A systematic review. Am J Med. 2004;117(3):182–92.
4. Pimouguet C, Le GM, Thiebaut R, Dartigues JF, Helmer C. Effectiveness of disease-management programs for improving diabetes care: a meta-analysis. CMAJ. 2011;183(2):E115–27.
5. Rubin RR, Peyrot M. Quality of life and diabetes. Diabetes Metab Res Rev. 1999;15(3):205–18.
6. Solli O, Stavem K, Kristiansen IS. Health-related quality of life in diabetes: the associations of complications with EQ-5D scores. Health Qual Life Outcomes. 2010;8:18.
7. Wexler DJ, Grant RW, Wittenberg E, Bosch JL, Cagliero E, Delahanty L, et al. Correlates of health-related quality of life in type 2 diabetes. Diabetologia. 2006;49(7):1489–97.
8. Fortin M, Bravo G, Hudon C, Lapointe L, Almirall J, Dubois MF, et al. Relationship between multimorbidity and health-related quality of life of patients in primary care. Qual Life Res. 2006;15(1):83–91.
9. Grandy S, Fox KM. EQ-5D visual analog scale and utility index values in individuals with diabetes and at risk for diabetes: findings from the study to help improve early evaluation and management of risk factors leading to diabetes (SHIELD). Health Qual Life Outcomes. 2008;6:18.
10. Hodek JM, Ruhe A, Greiner W. Multimorbidity and health-related quality of life among elderly persons. Bundesgesundheitsblatt Gesundheits-forschung Gesundheitsschutz. 2009;52(12):1188–201.
11. Holmes J, McGill S, Kind P, Bottomley J, Gillam S, Murphy M. Health-related quality of life in type 2 diabetes (TARDIS-2). Value Health. 2000;3(Suppl 1):47–51.
12. Koopmanschap M. Coping with type II diabetes: the patient’s perspec-tive. Diabetologia. 2002;45(7):S18–22.
13. Peters SA, Huxley RR, Woodward M. Diabetes as a risk factor for stroke in women compared with men: a systematic review and meta-analysis of 64 cohorts, including 775,385 individuals and 12,539 strokes. Lancet. 2014;383(9933):1973–80.
14. Peters SA, Huxley RR, Woodward M. Diabetes as risk factor for incident coronary heart disease in women compared with men: a systematic review and meta-analysis of 64 cohorts including 858,507 individuals and 28,203 coronary events. Diabetologia. 2014;57(8):1542–51.
15. Sonnichsen AC, Winkler H, Flamm M, Panisch S, Kowatsch P, Klima G, et al. The effectiveness of the Austrian disease management programme for type 2 diabetes: a cluster-randomised controlled trial. BMC Fam Pract. 2010;11:86.
16. Ose D, Miksch A, Urban E, Natanzon I, Szecsenyi J, Kunz CU, et al. Health related quality of life and comorbidity. A descriptive analysis compar-ing EQ-5D dimensions of patients in the German disease management program for type 2 diabetes and patients in routine care. BMC Health Serv Res. 2011;11:179.
17. Miksch A, Hermann K, Trieschmann J, Roelz A, Heiderhoff M, Laux G, et al. Gender-specific differences in quality of life of patients with type 2 diabetes with or without participating in DMP. Gesundheitswesen. 2008;70(4):250–5.
18. Ose D, Wensing M, Szecsenyi J, Joos S, Hermann K, Miksch A. Impact of primary care-based disease management on the health-related quality of life in patients with type 2 diabetes and comorbidity. Diabetes Care. 2009;32(9):1594–6.
19. Laxy M, Stark R, Meisinger C, Kirchberger I, Heier M, von Scheidt W, et al. The effectiveness of German disease management programs (DMPs) in patients with type 2 diabetes mellitus and coronary heart disease:
results from an observational longitudinal study. Diabetol Metab Syndr. 2015;7:77.
20. Mehring M, Donnachie E, Bonke FC, Werner C, Schneider A. Disease man-agement programs for patients with type 2 diabetes mellitus in Germany: a longitudinal population-based descriptive study. Diabetol Metab Syndr. 2017;9:37.
21. Sonnichsen AC, Rinnerberger A, Url MG, Winkler H, Kowatsch P, Klima G, et al. Effectiveness of the Austrian disease-management-programme for type 2 diabetes: study protocol of a cluster-randomized controlled trial. Trials. 2008;9:38.
22. The disease management programme for type 2 diabetes in Austria. http://www.therapie-aktiv.at. Accessed 23 Sep 2014.
23. Weitgasser R. Diabetesschulung, “Neu” für Patienten mit Typ-2-Diabetes im Land Salzburg. Diabetes Stoffwechsel und Herz. 2009;18:25–7. 24. Austrian Diabetes Association. Diabetes mellitus–guidelines for the
practice. Revised and expanded 2007 edition. Wien Klin Wochenschr. 2009;121(Suppl 5):S1–87.
25. EuroQol Group. EuroQol–a new facility for the measurement of health-related quality of life. The EuroQol Group. Health Policy. 1990;16(3):199–208.
26. Rabin R, Oemar M, Oppe M. EQ-5D-3L User Guide. Basic information on how to use the EQ-5D-3L instrument. [Version 4.0]. Rotterdam: EuroQol Group; 2011.
27. Brundage M, Bass B, Davidson J, Queenan J, Bezjak A, Ringash J, et al. Pat-terns of reporting health-related quality of life outcomes in randomized clinical trials: implications for clinicians and quality of life researchers. Qual Life Res. 2011;20(5):653–64.
28. MLwinN Version 2.1. [computer program]. Version 2.1. 2009.
29. Flamm M, Panisch S, Winkler H, Sonnichsen AC. Impact of a randomized control group on perceived effectiveness of a Disease Management Programme for diabetes type 2. Eur J Public Health. 2012;22(5):625–9. 30. Rakovac I, Plank J, Jeitler K, Beck P, Seereiner S, Mrak P, et al. Health status
of type 2 diabetics in Austria—perspective of a quality improvement initiative. Wien Med Wochenschr. 2009;159(5–6):126–33.
31. Speight J, Reaney MD, Barnard KD. Not all roads lead to Rome-a review of quality of life measurement in adults with diabetes. Diabet Med. 2009;26(4):315–27.
32. Glasziou P, Alexander J, Beller E, Clarke P. Which health-related quality of life score? A comparison of alternative utility measures in patients with Type 2 diabetes in the ADVANCE trial. Health Qual Life Outcomes. 2007;5:21.
33. Matza LS, Boye KS, Yurgin N. Validation of two generic patient-reported outcome measures in patients with type 2 diabetes. Health Qual Life Outcomes. 2007;5:47.
34. Rabin R, de Charro F. EQ-5D: a measure of health status from the EuroQol Group. Ann Med. 2001;33(5):337–43.
35. Pickard AS, Neary MP, Cella D. Estimation of minimally important dif-ferences in EQ-5D utility and VAS scores in cancer. Health Qual Life Outcomes. 2007;5:70.
36. Chaveepojnkamjorn W, Pichainarong N, Schelp FP, Mahaweerawat U. A randomized controlled trial to improve the quality of life of type 2 diabetic patients using a self-help group program. Southeast Asian J Trop Med Public Health. 2009;40(1):169–76.
37. Olivarius NF, Beck-Nielsen H, Andreasen AH, Horder M, Pedersen PA. Ran-domised controlled trial of structured personal care of type 2 diabetes mellitus. BMJ. 2001;323(7319):970–5.
38. Davies MJ, Heller S, Skinner TC, Campbell MJ, Carey ME, Cradock S, et al. Effectiveness of the diabetes education and self management for ongo-ing and newly diagnosed (DESMOND) programme for people with newly diagnosed type 2 diabetes: cluster randomised controlled trial. BMJ. 2008;336(7642):491–5.
39. Hill-Briggs F, Gary TL, Baptiste-Roberts K, Brancati FL. Thirty-six-item short-form outcomes following a randomized controlled trial in type 2 diabetes. Diabetes Care. 2005;28(2):443–4.
40. Sturt JA, Whitlock S, Fox C, Hearnshaw H, Farmer AJ, Wakelin M, et al. Effects of the diabetes manual 1:1 structured education in primary care. Diabet Med. 2008;25(6):722–31.
•fast, convenient online submission •
thorough peer review by experienced researchers in your field • rapid publication on acceptance
• support for research data, including large and complex data types •
gold Open Access which fosters wider collaboration and increased citations maximum visibility for your research: over 100M website views per year •
At BMC, research is always in progress.
Learn more biomedcentral.com/submissions
Ready to submit your research? Choose BMC and benefit from: 42. Tankova T, Dakovska G, Koev D. Education and quality of life in diabetic
patients. Patient Educ Couns. 2004;53(3):285–90.
43. Trento M, Passera P, Borgo E, Tomalino M, Bajardi M, Cavallo F, et al. A 5-year randomized controlled study of learning, problem solving ability, and quality of life modifications in people with type 2 diabetes managed by group care. Diabetes Care. 2004;27(3):670–5.
44. Tuthill A, Quinn A, McColgan D, McKenna M, O’Shea D, McKenna TJ. A prospective randomized controlled trial of lifestyle intervention on qual-ity of life and cardiovascular risk score in patients with obesqual-ity and type 2 diabetes. Diabetes Obes Metab. 2007;9(6):917–9.
45. Varroud-Vial M, Simon D, Attali J, Durand-Zaleski I, Bera L, Attali C, et al. Improving glycaemic control of patients with Type 2 diabetes in a pri-mary care setting: a French application of the Staged Diabetes Manage-ment programme. Diabet Med. 2004;21(6):592–8.
46. de Belvis AG, Pelone F, Biasco A, Ricciardi W, Volpe M. Can primary care professionals’ adherence to Evidence Based Medicine tools improve qual-ity of care in type 2 diabetes mellitus? A systematic review. Diabetes Res Clin Pract. 2009;85(2):119–31.
47. Schafer I, Kuver C, Gedrose B, von Leitner EC, Treszl A, Wegscheider K, et al. Selection effects may account for better outcomes of the German Disease Management Program for type 2 diabetes. BMC Health Serv Res. 2010;31(10):351.
48. Kousoulis AA, Patelarou E, Shea S, Foss C, Ruud Knutsen IA, Todorova E, et al. Diabetes self-management arrangements in Europe: a realist review to facilitate a project implemented in six countries. BMC Health Serv Res. 2014;2(14):453.
49. Johansson T, Keller S, Winkler H, Ostermann T, Weitgasser R, Sonnichsen AC. Effectiveness of a peer support programme versus usual care in disease management of diabetes mellitus type 2 regarding improvement of metabolic control: a cluster-randomised controlled trial. J Diabetes Res. 2016;2016:3248547.