A Modern Method to Improve of Detecting and Categorizing Mechanism
for Micro Seismic Events Data Using Boost Learning System
Saeed Ghorbani
1, Morteza Barari
2, Mojtaba hosseini
31 Ph.D. Student in Information Technology, Maleke Ashtar Industrial University, Faculty of Information and
Communication Technology
2 Professor of Maleke Ashtar Industrial University, Faculty of Information and Communication Technology
3Assistant Professor Maleke Ashtar Industrial University, Faculty of Information and Communication
Technology
Abstract
Various natural disasters such as floods, fires, earthquakes, etc. have affected human life. Detection and classification of large and small earthquakes caused by natural or abnormal events have been always important to Earth scientist. One of the most important research challenges in this field is the lack of an effective method for identifying and categorizing various types of seismic events at less important and important levels. Based on latest achievements of Data Mining international institutions such as Rexer-KDnugget-Gartner and also newest authentic articles, SVM, KNN, C4.5, MLP are from most important and popular and leading classifiers in data world.Therefor in present study, a boost learning system consisting support vector machine algorithms with linear regression, MLP Neural Network ، C4.5 decision tree and KNN near neighborhood have been utilized in a combined form to detect and categorize micro seismic events. In general, the steps involved in the proposed method are: 1) performing artificial seismic tests, 2) data gathering and analysis, 3) conducting preprocessing and separating training and testing samples, 4) generating relevant models with training samples and detecting and categorizing test samples and 5) extracting a cluster with the maximum candidate using boost learning. After simulations, it was observed that the accuracy of proposed boost method to the best answer was about 6.1% higher compare to other methods and the error rate was 0.082% of recalling. Accuracy of detection and classification to the best answer were also improved compare to other methods up to 2.31% and 6.34%, respectively.
Keywords: seismic events; seismic classification; boost learning; micro seismic detection
1. Introduction
People face a variety of natural disasters in their life such as earthquakes, floods, fires and volcanoes from the past until now (Monadi and et al, 2012; soleymani and et al, 2014) [1][2]. These disasters have impacted human life and imposed irreparable damage on them. It would be possible to reduce the damages and prevent from many more serious damages with correct analysis of seismic events. Various methods are used to forecast the occurrence of earthquake events such as mathematical modeling, ionosphere analysis and studying animals' behavior (Abraham, 2005; Hadjimichael and et al, 2002) [3][4][5]. Some these methods only utilize from a single feature and are not able to use different features in earthquake forecasting. Therefore, earthquake events
2
cannot be correctly forecasted through analyzing only a feature (Shahbahrami, 2017) [6]. Nowadays, methods related to computer science can play important roles in different felids. Data mining techniques (Larose, 2014)
[7] and machine learning techniques (Zaki and Meira, 2014) [8]can be very useful in detection and classifying micro seismic events. In the other side, boost learning is being commonly used in many applications related to data mining including forecast, detection and classification and so on and is very effective in providing optimum and desirable output. Hence in present study, micro seismic events have been detected and then classified by combining machine learning techniques including support vector machine with linear regression [9, 10], MLP Neural Network [11] (HOU Rui, ZHANG Bi-xi, 2014) and C4.5 decision tree and (Ross Quinlan, 2014) [12] KNN (Lio and et al, 2013) [13]. Near neighborhood. The rest of present study is as follow: the literature review of study has been provided in section 2. Section (3) presents the suggested model with a description proposed architecture. In sections (4) and (5) the results have been represented and section (6) has been allocated to conclusion and future recommendations.
2. Literature Review
Kai et al (2014) utilized from particle swarm optimization algorithm (an algorithm of data mining) to forecast seismic events. They applied forecasting process on the seismic database and created a significant improvement (Cai and et al, 2014) [14], Landerb et al (2015) investigated the relationship between sea depth, volcano and earthquake using geophysical approaches of data mining and proposed a method to forecast the occurrence of these seismic events [15]. Mark Last et al (2016) emphasized on forecasting seismic events in Israel and its neighbors. They conducted their predictions by combining time series methods and data mining approaches (Land grebe and R. D. Muller, 2015) [16]. Inshuman et al (2017) utilized from a model named MOIDIS to estimate and forecast seismicity on the ice surface [17]. They focused on the experiments of 2015 in their study (Anshuman and et al, 2017). Asad-alah Shahbahrami et al (2017) utilized from a set of machine learning algorithms on Hazard dataset to forecast earthquake events. They concluded that SVM algorithm can forecast and classify seismic events with an acceptable accuracy [6].
Based on latest achievements Data Science specialists, SVM, KNN, C4.5, MLP are from most important and popular and leading classifiers in the world. It's visible in recent reports of Data Mining international institutions such as Rexer-KDnugget-Gartner and also newest authentic articles that mentioned in references. No need to less that one of the most important step in data mining process is data detection and classification. In this paper improvement of data detection and classification has been shown usage a modern method by Boost Learning System.
3. Data gathering and analysis
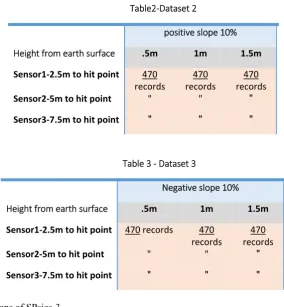
In present study, the limited experimental seismic method has been used to carry out related experiments. The used tools and devices are as follow:
• The SPseise3 seismograph with sensors (geophones) connected to the device at a distance of 2.5 meters from each other.
• A calibrated 20 Kg weight. • Calibrated meter.
The environmental conditions of experiment included a natural environment in a land with rugged soil and asymmetric geometry and in three steps as follow:
• In an area without slope
• In an area with positive slope: in this step, the sensor is located in a point higher than landing level of the weight.
• In an area with negative slope: in this step, the sensor is located in a point lower than landing level of the weight.
3
Figure (1), falling from a height of 0.5 m on a non-sloping surface
Figure (2), falling from a height of 1 m on a non-sloping surface
Figure (3), falling from a height of 1.5 m on a non-sloping surface
After carrying out related experiments, a set of features was extracted which the features were used to evaluate and conduct related algorithms. Table (1) presents the features have been used in present study.
Average velocity of p- wave
In this experiment, the average velocity of the initial wave propagation, which is important for analysis, is 500 m / s, which is obtained by dividing the distance between the sensor and the hypocenter (seismic focus) by the time that the signal is received by the device.
Sample rate
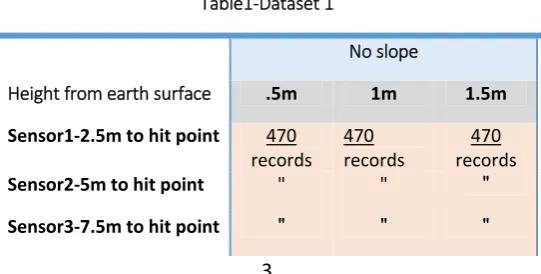
In this research, discrete sampling was performed on continuous wave with the time period of 267 microseconds. The numbers in the Excel data sheet are the wave amplitude in micro-volt, i.e. in every 267 microseconds, a point of the signal is read. In the following tables, examples of datasets are presented.
The sample of datasets
Table1-Dataset 1
No slope
Height from earth surface .5m 1m 1.5m
Sensor1-2.5m to hit point 470 records
470 records
470 records Sensor2-5m to hit point " " " Sensor3-7.5m to hit point " " "
-1500000 -1000000 -500000 0 500000 1000000
0 200 400 600 800 1000 1200 1400 1600
A B C
-1000000 -500000 0 500000 1000000
0 200 400 600 800 1000 1200 1400 1600 1800
A B C
-2000000 -1000000 0 1000000
0 200 400 600 800 1000 1200 1400 1600
4
Table2-Dataset 2
positive slope 10%
Height from earth surface .5m 1m 1.5m
Sensor1-2.5m to hit point 470 records
470 records
470 records Sensor2-5m to hit point " " " Sensor3-7.5m to hit point " " "
Table 3 - Dataset 3
Negative slope 10%
Height from earth surface .5m 1m 1.5m
Sensor1-2.5m to hit point 470 records 470 records
470 records Sensor2-5m to hit point " " " Sensor3-7.5m to hit point " " "
Technical specifications of SPsies-3
Number of recording channels: 4 (3 + 1 AUX) Frequency recording range: 5 - 4600 Hz
Analog anti-aliasing filter options: 250, 500, 1000 Hz
Sampling interval options: 32, 64, 125, 250, 500, 1000 or 2000 µs Analog to Digital resolution: 24 b it Hardware gain options: 24,36,48,60 dB
Maximum recording g data length: Up to 16384 samples Pre -trigger delay: Up to 4096 samples
Stacking: up to 999 times, 32-bit Input impedance: 20 K Ω/0.05 F Interface: USB Power requirement: DC12V, 2A (Max) Internal power supply
Delay: 0-122 ms in 1ms
Memory freeze: allow selective stacking of weak channels.
Operation system: windows 7Operation with any laptop Data format: SEG -2 Data transmission: USB Warranty: Two years
Line testing: Real time noise monitoring, Geophone connection test Max input signal: 500 mv p -p Table (4) presents the features have been used in present study. In this table sensors has been separated numbered for better diagnosis in different situation.
Table (4) Data Features
height = 0.5m (II) A (far)
B C (middle) (near)
without slope s8s7 s9
positive slope s11s10 s12
negative slope s20s19 s21
height = 1.0m (II) A (far)
B C (middle) (near)
without slope s2s1 s3
positive slope s17s16 s18
5
height = 1.5m (II) A (far)
B C (middle) (near)
without slope s5s4 s6
positive slope s14s13 s15
negative slope s26s25 s27
In Table (4), the columns related to t height indicate the heights of weight falling and the rows are for the slope of surface. S1 indicates positive slope and means the down to the top route. S2 indicates negative slope and meant the top to the down route and S3 indicates flat and non-slope surface. The columns of the second row indicate three sensors have been used in the experiment. Sensor A is the farthest sensor from the source (7.5m), sensor B is the middle one from the source (5m) and sensor C is the nearest sensor to the source (2.5m). For example, S7 indicates the received signal from sensor (A) i.e. the farthest sensor from the source in the first falling i.e. from the height of 0.5 m in non-slope surface. The rest of the experiment is in a same way, i.e. S27 indicates the signal received from the nearest sensor to the source (sensor C) in falling from the height of 1.5m in the negative slope surface (down to top route). Different statuses of the experiment with different heights and sensors have been shown in following figure.
Figure (4), falling in the non-slope surface from the heights of 0.5, 1 and 1.5m
After gathering data from different sensors in far, middle and near distances as well as in different statuses of non-slope, positive slope and negative slope, it was needed to combine data and produce a coherent dataset to determine the cluster of each sample. For this purpose, all of the gathered data were prepared in the form of Excel file. Therefore, in present study, the experiments were carried out on 12690 samples.
4. Description of the proposed method
In this section, the process of seismic events detection and classification has been firstly described and then, the learning algorithms and how to produce related models have been investigated. Finally, methods' combination and evaluating criteria have been described.
4-1seismic events classification
6
model based on the training samples. Training data involved 80% of micro seismic event samples and were used to training process of model of mentioned algorithms. The experimental data involved 20% of micro seismic event samples and were used to evaluate the proposed method and each of the mentioned algorithms. The sampling method of experimental data was based on the balancing technique (balance sampling technique). It would be possible to extract the same samples from each of the groups by this technique to cover all of the groups. After producing coherent data set from a set of recorded seismic events and separating training data from experimental data, the data were inserted to the core of learning machine algorithms. The following figure represents how insert data, producing training models and finally classification of each sample by learning machine algorithms.
7
As it can be seen from Figure (5), all seismic events recorded by seismograph machine and sensors were firstly inserted to the proposed system as inputs. Then, the data were gathered in a unique profile and turned into a set of coherent events. The classification process was performed by an expert based on the less important and important events and so on. In present study, the X-means clustering algorithm was used to measure the accuracy of classification done by expert as well as to determine cluster for all samples and it was observed that classes are exactly as same as clusters. Therefore, the classes determined by the expert were reliable. Data were separated in two groups of experimental and training after producing a coherent data set and classifying them by expert and X-means algorithm. Then, the training data were inserted to each of the algorithms one-by-one. Each algorithm produced the related model to classify experimental samples by receiving training data. Then, each classifier algorithm sent a cluster of each sample to the input of boost learning algorithm.
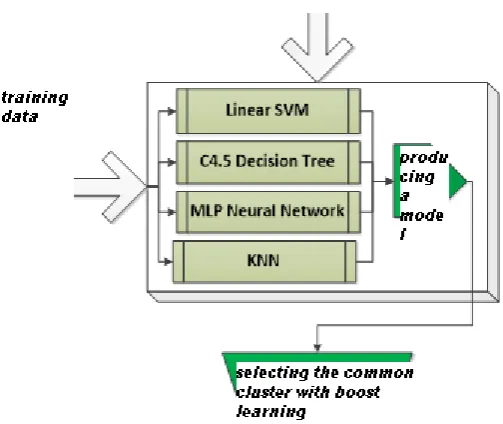
4-2. Boost learning system
The structure of boost learning algorithm is in a way that the out puts of algorithms of support vector machine learning with linear regression, MLP Neural Network, C4.5 decision-making tree and KNN receive a cluster and determine the number of which cluster is more than other clusters. The cluster with the most candidates for each sample is selected as a final output. The flowchart of boost learning has been shown in Figure (6).
Figure (6), flowchart and architecture of boost learning method
As it can be seen from Figure (6), a cluster is sent to output of each seismic event sample per repetition as the optimum cluster. The optimum cluster among the output of algorithms can be selected using following equation.
= max ( , , , … , ) (1)
Where, Bi indicates the final cluster to ith sample and C is the determined cluster to hth cluster by deep learning algorithms.
4-3. Evaluation Criteria
In all of classifier and forecaster algorithms, the accuracy, precision, recalling and real error are the most criteria of evaluation. The following equation presents how to calculate the accuracy of seismic events' classification.
= (2)
Where, TP indicates the number of detections and classifications which have been classified as less important or important. TN indicates the number of detections and classifications which have been classified as non-important and FP is for false classifications. The following equation shows how to calculate the recalling of seismic events' classification.
8
The following equation shows how to calculate the precision of seismic events' classification. = (4)
The following equation shows how to calculate the error rate of seismic events' classification. = 100 − (5)
The following equations show how to calculate the mean of real errors and mean square of errors. = ( ^2) (6)
= ( ) (7)
5. Results evaluation
In present study, the forecasting and classification process of micro seismic events was carried out on 3330 samples of data recorded by SPseise3 seismograph machine consisting up of Three sensors (geophones) connected to the machine with a distance of 2.5 m from each other, a 20kg calibrated weight and a calibrated meter. 20% of data extracted from whole of the data in a balance form were used as experimental data and 80% of them used as training data in order to evaluate data mining algorithms as well as to combine optimum algorithm in the form of a boost learning system. Therefore, in this section, the results of all algorithms have been analyzed and evaluated based on the mentioned evaluation criteria.
Since the samples extracted from available sensors were without monitoring, it was firstly needed to determine a cluster for each sample and then, machine learning algorithms with monitoring include SVM, neural network, decision-making tree and so on applied on the final clustered data. In present study, three thresholds have been defined to detect three different classes as follow:
- Data obtained from dropping the weight from a height of half a meter: noise class
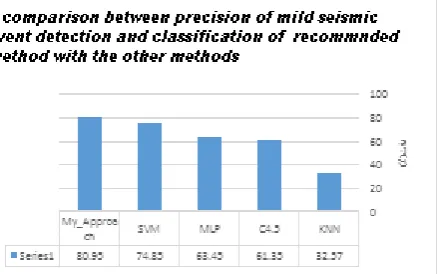
- Data obtained from dropping the weight from a height of one meter: less important events class - Data obtained from dropping the weight from a height of one and a half meters: important events class The learning algorithms can be applied on data with determining the classes related to each sample. Following figure represents a comparison between the precision of micro seismic event detection and classification of different algorithms including MLP neural network, SVM, C4.5 decision-making tree, KNN and proposed boost method.
Figure (7), a comparison between precision of micro seismic event detection and classification of proposed method with the other methods
9
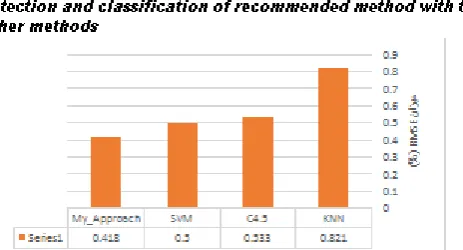
Figure (8), a comparison between error rate of micro seismic event detection and classification of proposed method with the other methods
Since reduction in error rate of proposed method is complementary of precision level, it can be seen that the error rate has been improved up to 0.82% compare to the other methods. Following figure represents a comparison between the recalling and accuracy of micro seismic event detection and classification of different algorithms including MLP neural network, SVM, C4.5 decision-making tree, KNN and proposed boost method.
Figure (9), a comparison between recalling and accuracy of micro seismic event detection and classification of proposed method with the other methods
As it can be seen, the level of accuracy and recalling of micro seismic event detection and classification in the proposed method have been improved compare to the mean accuracy of other methods up to 37.4% and 42.5%, respectively. Following figure represents a comparison between the RMSE values of micro seismic event detection and classification of different algorithms including MLP neural network, SVM, C4.5 decision-making tree, KNN and proposed boost method.
10
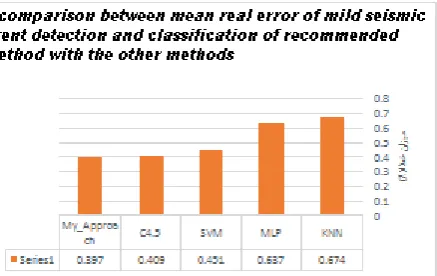
Following figure represents a comparison between the mean real error of micro seismic event detection and classification of different algorithms including MLP neural network, SVM, C4.5 decision-making tree, KNN and proposed boost method.
Figure (11), a comparison between mean real error of micro seismic event detection and classification of proposed method with the other methods
Finally, with calculating the value of mean error rate and error mean square, it was observed that the proposed boost method detects and classifies the seismic with higher efficiency compare to the other methods.
6. Conclusion
In present study, the micro seismic events were detected and classified through combining machine learning methods including back up vector machine, MLP neural network, and C4.5 decision-making tree and KNN algorithm in the form of boost learning. The procedure of experiment was in a way that less important and important seismic events caused by weight falling from various heights and different distances of far, middle and near recorded by laboratory devices and sensors. Then, the data were pre-processed and classified. The classification was based on the level of height, distance and considered sensors. After this step, the training data (80%) and experimental data (20%) were separated from each other. The training data were used to train considered algorithms and the experimental data were used to evaluate the precision, accuracy, and recalling and error rate of the proposed method. In the next step, the algorithms of support vector machine, MLP neural network, C4.5 decision-making tree and KNN produced related models and the new and without class experimental data were inserted to the models in order to evaluations. The cluster related to each sample was determined by each of the algorithms and the answers inserted to the boost learning system. Finally, the cluster with the most number of candidates was selected as the main cluster of related event. The precision and accuracy were significantly improved by this strategy. After simulation of the proposed method, it was observed that the precision of proposed boost method was improved up to 6.1% compare to the other methods. The error rate improved up to 0.82% and the recalling and accuracy of detection and classification to the best answer were also improved in the proposed method up to 2.31% and 6.34%, respectively.
References
[1]. Monadi, A., B. Eslampour, N. Baghaeimehr and F. Abed, Crisis Management in Cities from Holy Quran Perspective, Journal Appl. Environ. Biol. Sci, Vol. 2, No. 12, 2012, pp. 606-608.
[2]. Solymani, A., A. Abdolahii and M. Rahimi, Evaluation and Improvement of Urban Worn against Earthquakes (Case Study Neighborhood of Shiraz Zvalanvar), Journal Appl. Environ. Biol. Sci, Vol. 4, No. 1, 2014, pp. 157-165.
[3]. Abraham, A., Rule-based expert systems, Handbook of measuring system design, 2005, pp. 909-919. [4]. Hadjimichael, M., A. P. Kuciauskas, P.M. Tag, R.L. Bankert and J.E. Peak, A meteorological fuzzy expert
system incorporating subjective user input, Knowl Inf Syst, Vol. 4, No. 3, 2002, pp. 350-369.
[5]. Mansiya, K., Z. Alma, M. Torgyn, M. Marzhan and N., Kanat, The methodology of expert systems,
International Journal of Computer Science and Network Security, Vol. 14, No. 2, 2014, pp. 62-66. [6]. A. Shahbahrami and Z. Mehdidoust Jalali, Evaluation of Different Data Mining Algorithms to Predict
Earthquakes Using Seismic Hazard Data, Journal Appl. Environ. Biol. Sci, Vol. 7, Vol. 2, 2017, pp. 142-150.
11
[8]. Zaki, M. J., & Meira Jr, W, Data mining and analysis: fundamental concepts and algorithms, Cambridge University Press, 2014.
[9]. Suthaharan, S, Support Vector Machine. In Machine Learning Models and Algorithms for Big Data Classification, 2016, pp. 207-235.
[10]. Zhu, J., & Hastie, T, Kernel logistic regression and the import vector machine, Journal of Computational and Graphical Statistics, 2012.
[11]. HOU Rui, ZHANG Bi-xi, A Method for Forecasting Regional Logistics Demand Based on MLP Neural Network and Its Application, Systems Engineering-theory & Practice, 2005.
[12]. J. Ross Quinlan, C4.5: Programs for Machine Learning, Computer Science Artificial Intelligence Machine Learning, 2014, 302.
[13]. Liu, Z. G., Pan, Q., & Dezert, J, A new belief-based K-nearest neighbor classification method, Pattern Recognition, Vol. 46, No. 3, 2013, pp. 834-844.
[14]. S.Z. Cai, Q.F. Zhang, X.P. Xu, D.H. Hu and Y.M. Qu, The Data Mining Technology of Particle Swarm Optimization Algorithm in Earthquake Prediction, Advanced Materials Research, Vol. 9, 2014, pp. 1570-1573.
[15]. T. C. W. LANDGREBE AND R. D. MULLER, Uncovering the relationship between sub ducting bathymetric ridges and volcanic chains with significant earthquakes using geophysical data mining,
Australian Journal of Earth Sciences, 2015, pp. 162-171.
[16]. Mark Last, Nitzan Rabinowitz, Gideon Leonard, Predicting the Maximum Earthquake Magnitude from Seismic Data in Israel and Its Neighboring Countries, Plos One, 2016.
[17]. Anshuman Bhardwaj, Shaktiman Singhb, Lydia Samb, Akanksha Bhardwajd, Javier