Lincoln
University
Digital
Thesis
Copyright
Statement
The
digital
copy
of
this
thesis
is
protected
by
the
Copyright
Act
1994
(New
Zealand).
This
thesis
may
be
consulted
by
you,
provided
you
comply
with
the
provisions
of
the
Act
and
the
following
conditions
of
use:
you
will
use
the
copy
only
for
the
purposes
of
research
or
private
study
you
will
recognise
the
author's
right
to
be
identified
as
the
author
of
the
thesis
and
due
acknowledgement
will
be
made
to
the
author
where
appropriate
you
will
obtain
the
author's
permission
before
publishing
any
material
from
the
thesis.
CONSUMER DEMAND FOR BEEF
IN THE E.E.C.
A thesis
submitted in partial fulfilment of the requirements for the Degree
of
Master of Agricultural Science in the
University of Canterbury
by A.C. Hannah
LIST OF TABLES LIST OF FIGURES
INTRODUCTION CHAPTER I
"
II
II
II
"
"
CHAPTER II
CONTENTS
BEEF PRODUCTION, CONS UMPTI ON AND TRADE IN THE E.E .C.
1.1.1 Production
1 .1.2 Comparison with other Meats
1 .1
.3
Product i on of Beef and Other Meats in the Individual Countries of the E.E.C.1.2 Consumption 1 .3 Trade
1.4
1 . 3 . 1 Deta i led Analysis of Imports and Export s of Beef and Veal for 1968 .
E. E. C. Market Regulations for Beef and Veal
1.4.1 Brief History of the Common Agricultural Policy
1 . 4 .2 Reg ulations for Beef and Veal
A REVIEW OF SOME PREVIOUS ECONOMETRIC ANALYSES OF DEMAND FOR BEEF , WITH PARTICULAR REFER-ENCE TO THE E.E.C. COUNTRIES
PAGE
1
3
i i
PAGE CHAPTER II 2 .1 A. Weber (1960)
II 2.2 H. Faur-e ( 1967)
II 2.3 B. Cali cis (1969 )
"
2.4 Kettunen ( 1968)"
2.5 SummaryCHAPTER III MARKET STRUCTURE AND CONSUMPTION
TRENDS FOR BEEF IN THE E.E .C. 47
II
3 .1 Northern Europe
3 .1 01 The Marketing Chain 3 .1. 2 Margins
3 .1 .3 Consumption Trends and Habits
"
3.2 France3 .2.1 The Marketing Chain 3.2.2 Margins
3.2.3 Consumption Habits and Trends
II
3.3 Italy
3 .3 .1 The Marketing Cha i n 3.3.2 Margins
3.3.3 Consumption Trends and Habits
CHAPTER IV A DISCUSSION OF THE MODELS AND DATA TO BE
USED IN THE ANALYSIS 67
II
4.1 Specification of the Model . . 4.1 .1 Statistical Tests
iii
PAGE CHAPTER
.·v
ANALYSIS OF THE DEMAND FOR BEEF ANDVEAL IN GERMANY 79
II 5 .1 The Data
5 .1 .1 Price 5 .1. 2 Income 5 01 . J Consumption
II
5.2 Resul ts
5 .2 .1 Result s of the Monthly Analysis
. 5.2.2 Results of the Quarterly Analysis
5.2.3 Results of the Annual Analysis CHAPTER VI ANALYSIS OF THE DEMAND FOR BEEF AND VEAL
IN THE NETHERLANDS 96
ti 6.1 Th~
Data
II 6.2
Results
6.2.1 Results of the Quarterly Analysis
6.2.2 Results of the Annual Analysis
II
6.3 Summary of Results
CHAPTER VII ANALYSIS OF THE DEMAND FOR BEEF AND VEAL
IN BELGIUM 106
II
7 .1 The Data 7.2 Results
7 .2 .1 Results of the Quarterly Analysis
7.2.2 Results of the Annual Analysis
II
iv PAGE CHAPTER VII I ANALYSIS OF THE DEMAND FOR BEEF AND VEAL
IN FRANCE 118
"
8.1 The Data8 .1 01 Pr ice 8.102 Income 801 o3 Consumption
II 8.2 Analysi s of Demand and Results 8.2 .1 Result s of the Monthly
Analysis
8.2.2 Results of the Quarterly Analysis
8.2.3 Results of the Annual Analysis
"
8.3 Summary of ResultsCHAPTER IX ANALYSIS OF THE DEMAND FOR BEEF AND VEAL
IN ITALY 147
"
9.1 The Data"
9.2 Results9 .2.1 Results of the Quarterly Analysis
9.2.2 Results of the Annual Analysis
"
9.3 Summary of ResultsCHAPTER X SUMMARY AND CONCLUSION 155
ACKNOWLEDGEMENTS 159
REFERENCES 160
TABLE 1 .1 1 .2 1.5 1.6 1.7 1.8 1.9
LIST OF TABLES
DESCRIPTION
Numbers of Meat Produc i ng Animals in the E.E.C. Net Production of Meat in the E.E.C. by Category Numbers of Meat Animals in the Countries of the
E.E.Ce
Gross Production (Before Trade) of Meat in the E.E.C. Countries
Percentage of Total Meat Production for each Type in 1968, by Country
Consumption of Meat in the E.E.C.
Per Caput Consumption of Meat in the E.E.C. Percentage of Total Meat Consumption for Each
Type in 1967/68, by Country
Degree of Self-sufficiency of the E.E.C. in Meat
1.10 Trade in Meat, by Country and by Class, in the
1 .11
1.12
1.13
1.14
3 .1
E.E.C.
1968 Imports and Exports of Beef and Veal, by
Country of Origin
Percentage of Contribution to Fund
E.A.G.G.F. Expenditure during First three Financial Years
Marketing of Beef Cattle in West Germany, as a Percentage of Producer Sales
APPENDIX C
APPENDIX D
APPENDIX E
Belgium Data French Data Ital i an Data
iv
TABLE
3.2
3.3
(a)3.3
(b)3.4
3.5
3.6
3.8
3 .10
5.1
5.2
5.3
5.4
5.5
5.6
6.1
6.2
6.3
DESCRIPTIONTrading and Preparation Margins for West German Beef
Person Responsible for Food Buying Frequency of Buying Meat
Per Caput Consumption of Beef and Veal According to Occupati on of Head of Household
Per Caput Consumptio n f Beef and Veal According to Demographic Area
Per Caput Consumption of Beef and Veal According to Geographic Region
Percentage Sales of Beef and Veal According to Type of Retail Outlet
Income Elasticities Associated with Different Income Groups
Income Elasticities Associated with Different Demographic Groups
Percentage of Meat Bought at Different Retail Outlets in Italy
Results of German Monthly Demand Model I Results of German Monthly Demand Model I
-with Chicken as an Additional Explanatory Variable
Results of German Quarterly Demand Model I German Quarterly Demand Model I with one and
two years deleted
Results of German Annual Model I Results of German Annual Model II
Results of Netherlands Quarterly Model I Results of Netherlands Quarterly Model II
Results of Netherlands Annual Model I
TABLE 6.4 8.1 8.2 8.3 8~4 8.6
8.7
8.8 8.9 8.10 8.11 9 .19.2
DESCRIPTION
Results of Netherlands Annual Model II Results of Belgium Quarterly Demand Model I Results of Belgium Quarterly Demand Model II Results of Quarterly Belgium Demand Model II
when Pb
2 Replaces Pb1 as the Dependent Variable in t he Estimated Equations Results of German Annua l Demand Model I Results of German Annual Demand Model II Factors used to Correct French Producti on for
Fraud
Purchases of S.I.E.B.V. and Wholesale Beef Price Compared 1960 -
630
Sales, Purchase and Stocks of Beef in France 1960 - 640
Results of Monthly Demand Model I - France Results of Monthly Demand Model 19 with the
addition of Chicken and Veal Prices as Independent Variables
Results of Quarterly Demand Model I - France Results of Quarterly Demand Model I - with
addition of Chicken and Veal Price Variables.
Results of Quarterly Demand Model II
Structural Elasticities for Equations 8.2.29 and 8.2.30
Results of Annual Demand Model I
Results of Estimating Annual Demand Model II Results of Quarterly Demand Model I - Italy Simple Correlations for Equations 9.2.1 and
i x
TABLE DESCRIPTION PAGE
9.3 Results of Annual Demand Model I - Italy 152
9.4 Simple Correlations for Equation 9.2.3 151
9.5 Results of Annual Demand Model II - Italy 152 10.1 Summary of Elasticities obtained in the
7 .1 7.2 7.3 8.1 8.2 8.3
8.4
9 .1
f.IST OF FIGURES
DESCRIPTION
Marketing Chain for Beef in Germany, The Netherlands, and Belgium
Meat Marketing Channels in France
Reference Map of France
Marketing Channels for Beef in Italy
German Quarterly Beef Consumption
German Beef Consumption per Head
German Def lated Beef Price
Netherlands Quarterly Beef Consumption
Netherlands Annual Beef Consumption
Belgian Quarterly Beef Consumption
Belgian Annual Beef Consumption
Def lated Belgian Annual Beef and Pork Prices
French Monthly Beef Consumption
French Quarterly Beef Consumption
French Annual Beef Consumption
Deflated Beef Price - France
Italian Quarterly Beef Consumption
I NTRODUCTIO l
Recent measures to increase beef production in New Zealand have
directed interest towards potential markets. An O.E.C.D. ( 1 ) study
predicts that the area with the second largest net requirement for
beef by 1985 will be the E.E.C. countries (The United States has the
largest requirement) with net imports of 970,000 metric tons. This is
a very large quantity of beef - about triple New Zealand's total
pro-duction - and implies that the E.E.C. could become a market for New
Zealand beef. However much political considerations make this
unlike-ly. Western Europe is an area in which New Zealand should now, because
of the negotiations on Britain's entry into the E.E.C., take an interest.
Projections such as the one mentioned above have used income as the
main determinant of future demand~ modifying the estimates when they
thought the price sttucture might change. The object of this study .
has been to try and quantify the relative effects of price and income
on E.E.C. demand for beef in order to yield coefficients which might
be used in later projection work.
Chapter I is a discussion of past and present trends in E.E.C.
meat production, consumption and trade, with special reference to beef.
Chapter II reviews previous studies of beef demand in Europe, and the
E.E.C. in particular. Chapter III describes the meat markets in the E.E.C. countries while Chapter IV develops the models and discusses
the data to be used.
Chapters V through IX give the results of the analysis country by country and Chapter X is the summary and conclusion.
Jo
CHAPTER I
BEEF PRODUCTION. CONSUMPTI ON AND TRADE IN THE EoEoCo
1 .1 01 P d ro uc ion t . (1)
Beef is one of the two important meats produced in the EoE.Co
Most is produced jointly with milk on small farms (the average size of
holdings in the E.E.C. countries is between 6 and 10 hectares) from dual
purpose breeds of cattle. Only in France and Italy are there sizeable
numbers of pure beef breeds, and even in these two countries they
account for only about 2Cffa of production. Feed-lot fattening is rare,
but in the Nethe r l ands t here is b little joint production, unWorked dairy
calves be ing sold as young stcres either for finishing in winter yards
or on summer grass.
Beef production in the EoE.C. fits into four main categories.
(1) Vealer calves of 100 - 150 kg (2~Jcwt) live-weight reared
on milk (whole or skim) plus concentrates, or 200 kg
(4
cwt) if reared to six months with a little roughage. Production of this type of calfis typ i cal of the smaller type of dairy farm.
(2) "Baby-beef " intens i vely reared on cerealso
4.
(3) 18 - 20 month old cattle of up to 500 kg (10 cwt) reared on non-concentrate feed such as silage and finished off on grass.
(4) Two to four year old beasts of between 500 and 700 kg (10-14 cwt) produced on non-dairy farms. Often a long store period on grass and a final winter fattening in yards.
Finally, barren dairy cows are an important source of beef in the E.E.C. countries .
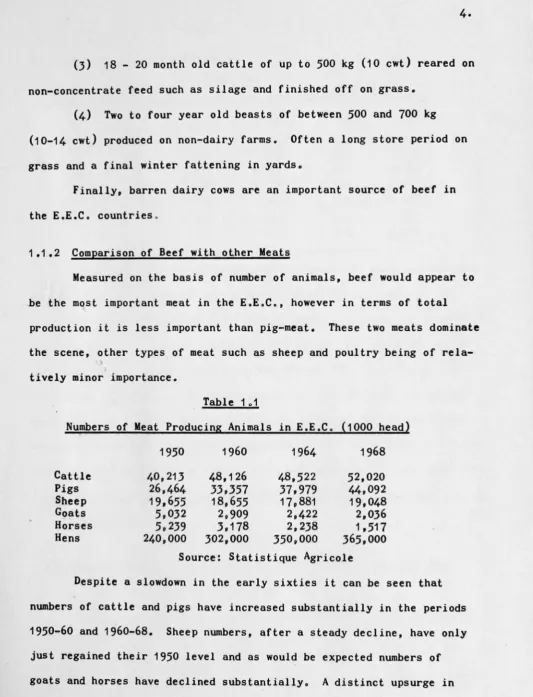
1.1.2 Comparison of Beef with other Meats
Measured on the basis of number of animals, beef would appear to be the most important meat in the E.E.C., however in terms of total production it is less important than pig-meat. These two meats dominate the scene, other types of meat such as sheep and poultry being of
rela-ti v.e ly minor importance.
Table 1.1
Numbers of Meat Producing Animals in E.E.C. (1000 head)
1950 1960 1964 1968
Cattle 40,213 48,126 48,522 52,020
Pigs 26,464 33,357 37,979 44,092
Sheep 19,655 18,655 17 ,881 19,048
Goats 5,032 2,909 2,422 2,036
Horses 5,239 3,178 2, 238 1,517
Hens 240,000 302,000 350,000 365,000
Source: Statistique Agricole
Despite a slowdown in the early sixties it can be seen that numbers of cattle and pigs have increased substantially in the periods 1950-60 and 1960-68. Sheep numbers, after a steady decline, have only
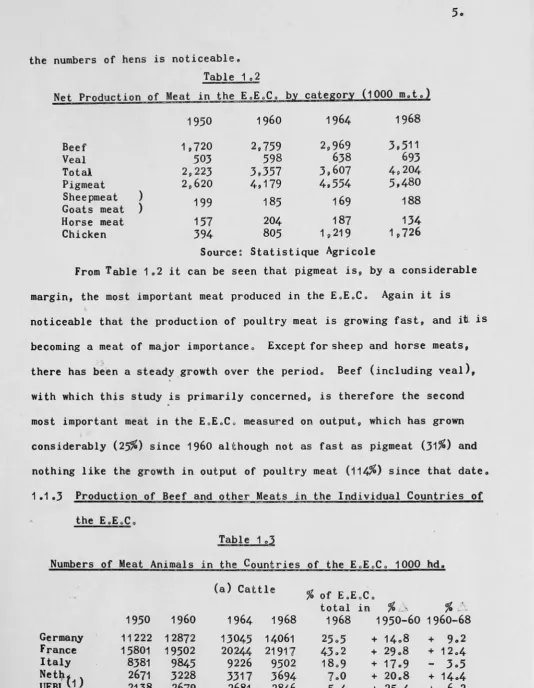
the numbers of hens is no t iceabl e o Table 1 . 2
5.
Net Production of Meat in t he E.E . C. by category (1000 m.t.)
1950 1960 1964 1968
Beef 1p720 2p759 2g969 3,511
Veal 503 598 638 693
Total 2p223 3p357 3,607 4g204
Pigmeat 2g620 4, 179 4,554 5,480
Sheepmeat )
199 185 169 188
Goats meat )
Horse meat 157 204 187 134
Chicken 394 805 1g219 1g726
Source: Statistique Agricole
From Table 1 .2 i t can be seen that pi gmeat is, by a considerable margin, the most important meat pr oduced in the E. E.C. Again i t is
noticeable that the product i on of poultry meat is growing fast, and i~ is becoming a meat of major importance. Except for sheep and horse meats, there has been a steady gr owth over the period . Beef (including veal), with which this study is primar ily concernedg is therefore the second most important meat in the E.E.C . measur ed on output, which has grown considerably (2,5%) since 1960 al t hough not as fast as pi gmeat (31%) and nothing like the growth in out put of poult r y meat (114%) since that dateo 1.1.3 Production of Beef and othe r Meat s i n the Individual Countries of
the E.E.C.
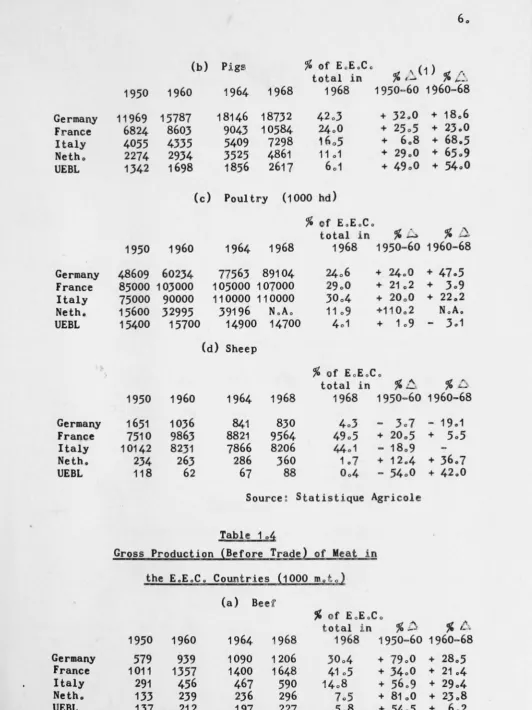
Table 1 o3
Numbers of Meat Animals i n the Countr ies of the E. E.C. 1000 hdo (a) Ca t tl e
% of E.E . C.
total in
% -"
% .. ' - -1950 1960 1964 1968 1968 1950-60 1960-68G~rmany 11222 12872 13045 14061 25o5 + 14 .. 8 + 9o2 France 15801 19502 20244 21917 43o2 + 2908 + 12o4
Italy 8381 9845 9226 9502 18.9 + 17 .9
-
3.5Neth( 2671 3228 3317 3694 7 .,0 + 20.8 + 14o4
UEBL 1) 2138 2679 2681 2846 5o4 + 25.4 + 602
Germany France Italy Ne tho UEBL Germany France Italy Neth. UEBL Germany France Italy Neth. UEBL Germany France Italy Neth. UEBL
(1) Change
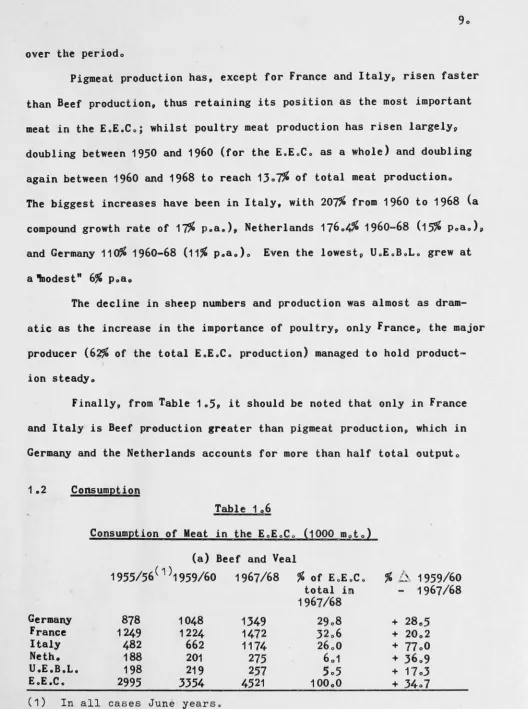
1950 11969 6824 4055 2274 1342 (b) 1960 15787 8603 4335 2934 1698 Pi gs 1964 18146 9043 5409 3525 1856 1968 18732 10584 7298 4861 261 7
%
of EoE.C o to t al in1968 42 o3 24o0 1605 11.1 601
+ 32o0
+ 25 o5
+ 608
+ 29.0
+ 49o0
+ 18.6
+ 23.0
+ 68.5
+ 65.9
+ 54.0
(c) Poult r y (1000 hd)
1950 1960
48609 60234 85000 103000 75000 90000 15600 32995 15400 15700
1950 1960
1651 7510 10142 234 118 1036 9863 8231 263 62
1964 1968
77563 89104 105000 107000 110000 110000 39196 N .Ao 14900 14700
(d) Sheep
1964 1968
841 8821 7866 286 67 830 9564 8206 360 88
%
of E. E. C.t otal i n
%
~%
b-1968 1950- 60 1960-68
24 06 29 . 0 30 . 4 11 .9 4 . 1
+ 24.0 + 21.2 + 20 o0 +110o2
+ 1.9
+ 47o5
+ 3.9
+ 22.2 N. A. - 3.1
%
of E. E.Cototal i n
%
-6.
%
L.J 1968 1950- 60 1960-684 . 3 49.5 44 o1
1o 7
Oo4
- 3o7 - 19o1 + 20o5 + 5o5 - 18.9
+ 12.4 + 36.7 - 54o0 + 42.0
Sour ce : St atis ti que Agri cole
Tabl e 1,.&;
Gross Production (Before Tr ade) of Meat i n
the E.EoC. Countr i es (1000 m. t o)
(a) BeelT'
1950 579 1011 291 133 137 1960 939 1357 456 239 212 1964 1090 1400 467 236 197 1968 1206 1648 590 296 227
" of EoEoCo
t ot al Ji n
%
D
% '--"
1968 1950- 60 1960- 68
30 o4 41.5 14 . 8
7. 5 5 08
+ 79o0
+ 34.0
+ 56o9 + 81.0 + 54.5
+ 28.5
+ 21 .4
+ 29.4
+ 23.8
Germany France Italy Ne tho UEBL Germany France Italy Neth. UEBL Germany France Italy Ne tho UEBL Germany France Italy Holland U.E.B.L. E.E.C. 7o
(b) Pigmea t
%
of EoEoCotf. ll
%
L.
total in
1950 1960 1964 1968 1968 1950- 60 1960-68 1023 1827 2174 2504 4600 + 78o0 +3607
853 1169 1177 1344 2406 + 37o0 + 14o9
267 417 466 528 906 + 5600 + 26o5
243 449 456
648
1108 + 84o9 + 44o5203 260 252 423 800 + 28o0 + 62o7
(c) Poultry meat
%
of EoEoCototal in
%
/.~%6
1950 1960 1964 1968 1968 1950-60 1960-6852 100 142 210 12o3 + 92o5 +11 OoO
250 394 550 680 38o5 + 57o5 + 72o9
58 173 310 532 31o5 +198o0 +207o0
7 77 128 213 12o2 +100000 +176o4
27 61 89 91 5o5 +126oO + 49o5
(d) Sheep meat (including goatsmeat)
'f. of EoEoCo
total i n
%
%~1950 1960 1964 1968 1968 1950- 60 1960-68
136 19 16 11 5o9 - 47o2 - 42o1
100 117 103 116 62o0 + 17
-
Oo8550 49 37 37 1908
-
2o0 - 24o510 9 6 9 406 - 10o0
2 2 1 2 107
Source : St at i st i que Agr i cole Tabl e 1o5
Percentage of Total Meat Product i on for each
Beef & Veal 29.0 36.5 J4.7 25.2 30.8 32.3
type i n 1968a b y countrx
Pigmeat Sheep Hors e Goats Mea t Meat
59.0 OoJ Oo1 J0o9 206 1 o2
2508 2o0 Oo6 51oJ Oo8 OoJ
4708 Oo4 1o0
42o4 1o4 Oo6 Source :
Poultr y Others Offal" Total Meat
5 o1 Oo? 508 100
1408 506 804 100
27 oJ 4o1 5o5 100
17 08 406 100
1201 1o4 605 100
1Jo7 3o0 606 100
Tables 1oJ through 1o5 show France has t he greater number of cattle (4Jo2% in 1968) and also the largest share of production (410,5%) followed by Germany (2505% of numbers and JOo4% of produ~tion)p Italy 18o9 and 14o8%)p Netherlands (7o0 and 705%) and UoE oBoLo ( 5o4 and 5o~)o Veal production is only important in Fr ance p where it re presente d
24%
ofall beef animal production in 1968P the Ne therl ands where i t has grown from 16% of all beef animal production in 1950P and 18% in 1960P to 2~ in
19680 (which shows the emphasis put on the veal trade by Dutch farmers)p and UoEoBoLo where it is around 10%0
The position is reversed with regard to pigmeat p Germany
accounting for nearly half of output9 while France and Italy dominate
poultry meat production. Sheep numbers and output are very low : they are shown here only for comparisono They are concentrat ed i n France and Italy, but have been declining steadily over the pe ri od showno
The figures in the last two columns of tables 1oJ and 1o4 give the percentage increase or decrease ove r the decade 1950- 60p and the 8 years from 1960-680 It should be noted that in 1950 all thes~
countries were still suffering the effects of the 1939- 45 warp whi ch will account for some of the large gai ns made in the 1950-60 periodo Cattle numbers and Beef producti on rose qui ckly up until 1960p and has risen steadily there after - an annual (compound) growth rate of 3% for France and between 3~ and
4"
fo r G~rmany9 Italy and theNether-lands in output of Beef since 19600 It is noticeable thatp almost without exception, Beef output rose considerably faster t han cattle numbers - from 1960 to 1968 a decline of 3o5% in cattle numbers gave an
9o over the periodo
Pigmeat production has, except for France and Italy, risen faster than Beef production, thus retaining its position as the most important meat in the EoE.Co; whilst poultry meat production has risen largelyp doubling between 1950 and 1960 (for the E.EoCo as a whole) and doubling again between 1960 and 1968 to reach 1307% of total meat productiono The biggest increases have been in Italy, with 207% from 1960 to 1968 Ca compound growth rate of 17% p.a.), Netherlands 176.4% 1960-68 (1,5% Poao)p and Germany 11<>% 1960-68 (11% p.a.)o Even the lowest9 U.E.B.L. grew at
a 'lnodest" 6% p.a.
The decline in sheep numbers and production was almost as dram-atic as the increase in the importance of poultry, only Francep the major producer (62% of the total E.E.C. production) managed to hold product-ion steady.
Finally, from Table 1.5, it should be noted that only in France and Italy is Beef production greater than pigmeat productionp which in Germany and the Netherlands accounts for more than half total outputo 1.2 Consumption
Germany France Italy Neth. U.E.B.L. E.E.C.
Table 1.6
Consumption of Meat in the E.E.C . (1000 m.t.) (a) Beef and Veal
1955/56(1)1959/60 1967/68
878 1048 1349
1249 1224 1472
482 662 1174
188 201 275
198 219 257
2995 3354 4521
%
of E.E.C. total in 1967/68 29.8 32.6 26.0 6.1 5o5 100.0( 1) In all cases June years .
%
!...
1959/60 1967/68+ 28.5
+ 20.2
+ 77o0
+ 36.9
+ 17 o3
Table 1 .6 (b) Pigmeat
1955/56 1959/60 1967/68
%
of EoEoC•%
A
1959/60 total in-
1967/68 1967/68Germaey 1681 1920 2531 48o0 + 31o8
France 1100 1179 1505 28o5 + 27.5
Italy 336 428 566 10. 7 + 31o0
Ne tho 237 269 363 6.9 + 34.9
U.E.B.L. 224 237 311 5.9 + 31o1
E .E .C. 3578 4033 5276 1 OOoO + 31.0
(c) Poultry Meat
1955/56 1959/60 1967/68
%
of EoEoC.%
El. 1959/60 total in - 1967/68 1967/68Germany 89 217 429 246 + 97.5
France 310 383 639 36.6 + 67.0
Italy 81 162 542 3101 + 234.0
Netherlands 5 18 65 3.7 + 261.0
U.E.B.L. 40 57 69 4.0 + 21.0
E.E.C. 525 837 1744 10000 + 109.0
(d) Sheep meat (including goatsmeat)
1955/56 1959/60 1967/68
%
of E.EoCo%
6
1959/60 total i n - 1967/68 1967/68Germaey 17 17 13 6.2
-
23.5France 111 115 137 6506 + 17.8
Italy 42 42 51 24o4 + 21 o4
Netherlands 1 5 3 1o4
-
40.0O.E.B.L. 2 4 5 2.4 + 25o0
E.E.C. 173 183 209 100.0 + 14o2
Source: Statistique Agricole
Tab!~ j 1
:z
Per CaEut. ConsumEtion of Meat in the E.E .C. !k~) (a) Beef and Veal
1955/56 1959/60 1967/68
%
b,, 1959/60 - 1967/68 Germaey 17.0 19.0 22o5 ·+ 18.4France 28.0 26.9 29.4 + 9.3
11 0
Table 1o7 (a} contdo
1955/56 1959/60 1967/68
%
A
1959/60 - 1967/68Netherlands 17o4 17 06 2108 + 23o9
UoEoB.Lo 21.5 23o2 25.2 + 806
EoEoCo 18o2 1906 24o4 + 24.5
(b) Pigmeat
1955/56 1959/60 1967/68
" A
1959/60 - 1967/68Germany 32.5 34.8 42.2 + 21 o2
France 24.7 25.9 30.1 + 1602
Italy 7.0 8.7 10. 7 + 23.0
Netherlands 21 .9 23.6 28o7 + 21 .6
U.E.B.L. 24.3 25.1 31.3 + 24.6
E.E.C. 21.8 23.6 28o4 + 20.3
(c) Poultry meat
1955/56 1959/60 1967/68 " ~ 1959/60 - 1967/68
Germany 1.7 4.0 7.2 + 80o0
France 6.9 8.4 12.8 + 52.4
Italy 1. 7 J.3 10.2 + 21000
Netherlands 0.5 1 .6 5.2 + 225.0
U.E.B.L. 4.3 6.o 6.9 + 15.0
E.E.C. J.2 4.9 9.4 + 91
.s
(d) Sheepmeat (including goatsmeat)
1955/56 1959/60 1967/68 " ~ 1959/60 - 1967/68
Germany Oo3 0.3 0.2
-
33o3France 2o5 2. 5 2.8 + 11o9
Italy 0.9 0.9 Oo9
Netherlands 0.1 0.5 0.2
-
60o0U.E.B.L. 0.2 0.4 0.5 + 20.0
E.E.C. 1 .1 1.0 101 + 10.0
Table 108
Percentage of Total Meat Consumption for each Type in
Beef
Germany 29o1 France 32.5
Italy 45o3
Ne tho 35o3 U.E.BoLo 33o9 E.E.C. 34o1
in 1967/68 by Country Pigmeat
5406 33o3 21 o9 46.5 42o0 39o7
Sheep
&
goat meat Oo3 3o0 2o0 Oo4 Oo7 1 06 Horse Meat Oo1 1 o9 1o5 208 4o2 1o4 Poultry Meat 9o2 14o1 20o9 803 9o3 13 .1Others Offal
Oo9 5.8 506 906 3o3 5o 1 607 1o6 803 3o0 7 o1 Source: Statistique Agricole
12.
Total
10000 10000 1 OOoO
100.0 100.0 10000
On a tonnage basis the consumption of beef has made, as would be expected from the trends in production, a steady gain over the period considered, particularly in Italy, the Netherlands and Germany. However it is more important to consider the per caputo figures which allow for increases in population. Measured in these terms consumption, during the period from 1959/60 to 1967/68, increased from 1906 kg/hd to 24o4 kg/hd, or 24.5% (a compound growth rate of nearly 3% Poa.) The longest contributing factor for this change was a large increase in Beef consumption in Italy, where there was a rise of 65.8% (9% Poa.) over the period, representing an absolute increase in consumption of 512,000 metric tons in 8 yearso The French are the EoE.C.'s biggest consumers of beef, both on a tonnage and a per caput basis, followed by Germany, Italy, Netherlands and U.E.B.L. (tonnage) or U. E.B.L., Germany, Italy and Netherlands (per caput), in that ordero
130
slower for the whole E.E.C. - ~ p.ao for 1959/60 to 1967/68. In 1967/68 pigmeat represented 39.7% of total consumption in the E.E.C.P and Beef 34.1%.
During the period 1959/60 to 1967/68 poultry meat increased greatly i ts share of the market, from 8.7% to 13.1%P representing an annual growth rate of nearly
9%
or an increase in amount consumed of 907p000 metric tons (more than doubling the 1959/60 figure). All countr i es except U.E.B.L. contributed to this massi ve increase, wi t h Italy9 where poultry now accounts for over 2o% of consumption, showingthe greatest increase.
Sheep meat is of minor significance, exhibiting wide fluctuat-ions within its limited range. It is interesting to note from Table 1.8 that Horse- meat has almost as great a share of t he market (1.4% to 1.6%) and is much more important in two areas - U.E . B.L. and the Netherlands. 1.3 Trade
The E.E.C. is a net importer of all the major types of meat, and9 as Table 1.9 showsp has tended to be increasingly less self- sufficient over the last fifteen years.
Table 1o9
Degree of Self-sufficiency of E.E.C. in Meat
1955/56 1959/60 1966/67
All · Meat 97.9 95.3 92.1
Beef and Veal 95.7 93.0 87o2
Pigmeat 101 .6 10000 98.2
Poultry meat 97 .1 90.2 97.7
140
pigmeat9 2 03% of i ts poultry meat9 or9 nearly
8%
of the total quanti t ycons umed 0 When it is remembered that i n 1966/67 12036 mill i on metric t ons of meat we r e consumed in the EoEoCo, it can be seen that trade in meat i s very importanto
Tabl e 1o10
Trade in Meat , by country and by Classo i n the EoEoC o (1000 mot o) (a) Bee f and Veal
1955/56 1959/ 60 1967/68
Impor t Export Import Expor t Impo r t Expor t l ive meat live meat live meat li ve meat l i ve meat live meat Germany
France Italy Ne tho U.EoB oLo
94 44
0 1
18 53
7 11 2 9
Total 121 118
Intra E.E.Co 12 24
109 94
203
4
1 100 625
53 0 340 62 145
2 29 10 19
1 3 1 13
12 12
96 173 273
24 28 89
0 72 72
145 184
329
4 38 40 157
23 57 0 33
2 186 310 1 51 1 2 56
2 8 27 45
14 29 26 132
0 3
2 88 5 33
30 156 265 601
47
285 28 89 43 217 43 2172 67 222 884
69 606
4 68 72 Trade in Beef and Veal in t he EoE. Co is char ac t erized by t he large numbers of live animals invol ved. Tabl e 1 o10(a) gives a bre akdown of trade by country for both li ve animals and meat for the June years 1955/56P 1959/60 and 1967/680 To t al import s and e xport s for both classes are broken down in t he las t two r ows into i nt r a E.E oCo t r ade, and that with third countries o As the Tabl e s hows9 the r e are some
, rather clear cut divisionso Italy and Germany ar e both lar ge net i
m-porters of Beef and Veal, wi th Belgium becomi ng an i mport ant i mpo r te r9 while France and the Netherlands are net expo rt erso Italy has ove
150 in 1959/60 and 71p000 V 138p000 mto in 1955/560
In 1955/56 more Beef and Veal was imported as live animalsp but by 1959/60 meat was predominant, and the trend has continuedp
al t hough large numbers of live animals (3229000 mto of meat equivalent
in 1967/68) still cross the frontierso Although intra- EoE.C. trade in-creased considerably during the period - 225% between 1955/56 and 1959/60 and 122% between 1959/60 and 1967/68 - imports from outs i de the EoEoCo also showed gains of 63% for the period 1955/56 - 1959/60 and ~ for 1959/60 - 1967/68, up to a total of 606000 metric tons in 1967/680 Exports were static over the periodo
Table 1010 (b) Pigmeat
1955/56 1959/60 1967/68
Import Export Import Export Import Export live meat live meat live meat live meat live meat live meat Germany
France Italy Net ho
U.EoBoL.
27 49 15 29 12
7
1 0 11
Total 54 97
!ntra EoE.Co 15 41
E.E.C. 39 56
Germany
France 0
Italy Ne tho
U.E.B.L. O
Total O
Intra EoEoCo
-EoEoC 0 0
29 1 9 1 40 40
5 10
1 25 3 4 115
5
26 15 179 15 4168 73
1
5
13 46
1
0 5
82 130 20 63 0 138 62 67
0 6 35 115 7 40 40 116 7 6 88
11 124
6
6
9
6
1224 186 20 63
87 337 57 157 4 123 30 180 (c) Poultry Meat
0 0 1 0
6 18
0 0
6 19 6 19
4 116
0 2
4 6
1 0
8 125 6 40
2 85
0 0
4
0
6 39
0 2
6
45 6 400 5
5 216
1 2
4 5
2 0 0
10 225 9 172
1 53
0 16 2 22 34 14 238 41 71 57 381 57 157
0 224
0 1 0 18
2 7 139 2 25 9 185 9 172
(d) Sheepmeat (including goats meat)
Germany 1 .3 1 1 0 0 0 4 1 1
France 6 6 0 0 0 4 2 1 4 16 0 0
Italy 0 0 0 0 2 0 7
5
0Neth .. 0 4 0 0 6 0 1 0 7
UoEoBoLo 0 0 0 0 0 2 0 0 1 .3 0 1
Total 6 7 .3
5
0 9 2 7 12 29 1 9Intra E.E.C. 0 4 0 4 0 6 0 6 1 9 1 9
E.E.C. 6 3 .3 1 0 .3 2 1 11 20 0 0
Table 1010 (b) shows that pigmeat trade both intra and extra E.E.C. has increased considerably over the period. Germany and France becoming quite large importers, and the Netherlands more than doubling her exportso
Germany and the Netherlands account for almost all of the
poultry-meat trade. Since 1959/60 Germany has increased her exports of poultry-meat , 0011000 metric tons to 216 11 000 m.t. 11 and the Netherlands has increased its exports by a similar quantity to 139 11 000 metric tonso In both pig-meat and poultry-meat, the live animal trade is relatively unimportanto
Sheep meat trade is once again given only for comparative pur-poses. The trade, particularly extra-E.E.C. trade, has in fact grown considerably over the period (bearing in mind its low base level)P France and Germany and Italy doing some importing, with the Nether-lands the only exporter of any (relative) size. The imports from
out-side th~E.E.C. come from the U.K. and Eastern Canada (live animals) and
for meat from Ireland, Argentine, England, Yugoslavia, New Zealand and Bulgaria in that ordero
17 0
Beef and Veal trade in the E.E.C., by further breaking down the trade by country of origin and class of meat for the year 1968. These are given in Table 1o11. As only major suppliers (or recipients) are shown
(ioeo those involving quantities greater than 1000 mt.) the sub-totals
and totals given will not necessarily agree. Table 1 011
1968 Imports and Exports of Beef and Veal, by Country of Origin and Type of Meat
Origin E.E.C.
France 14.9
U.E.B.L. 7.8
Neth. 3.0
Germany ·25.4 E.E.C. 51 .1
Ireland 1.2
Austria 6.5
Yugoslav 11 .1 E. Germany 2.6
Poland 8.1
Czechosl. 406
Hungary 3.3
Roumania 2.2
Bulgaria 4o4
extra E .E .C. 45.2
France 25.0
Germany 2.7
intra E.E.C.28.2
Denmark 3.7
Austria 1.8
Czechosl. 7.8 Hungary 25o3
extra EEC 40.6
France 0.9 0.3
1 .2
0.1
Imports (1000 m.t.) (i) Calves
U.E.B.L. Neth. 1 .1
1o0 1 .1
0.3 0.4
2.6 1.5
0.3
o.8 Oo4
Germany 2.7 0.9 3.6 0.9 0.2 Oo1 1 .3
(ii) Bulls, non reproductive
206 0.7
2.6
1.2 108 0.7
1 .o Oo1 0.1
0.2
5.5 7o3 12.4
0.1 8.8 906 13.3
Italy 1306 3o2 Oo6 24.7 42o2 6.3 11.1 2.6 8.1
4.5
lo.J 2o2 4o4 42o5210 7
180 (iii) Cows (non-breeding)
Origin E.E.C. France U.E.B.L. Neth. Germany Italy
France 13 o1 12.5 Oo1 Oo2 Oo3
UoEoB.Lo 2o1 1.9 0.1
i ntra EEC 16.9 0.7 12.6 2.0 o.6 LO
Ire land 3.1 1.4 107
Denmark 6908 6.5
5.5
5708Austria 13.7
0.1
1 .3 5.9 506Yugoslav 1.9 108
Hungar y 1006 2o0 3.2 5.3
Rumania 4.2 2.0 1.2 Oo9
extra EEC 105o3
0.1
13.8 12.2 69.2 9o4(iv) Other beef animals
France 38.9 6.1 0.2 32 .. 6
UoE oBoLo 1 .9 o.6
0.5
Oo8Ne tho
5 ..
2 2.9 0.2 Oo1 1o9Germany 800 0.2 7o7
intra EEC 54.0 3.2 6.3 0.2 o.8 43.0
Denmark 1 06 0.7 o.6 0.2
Austria 22.3 0.1 2.3 19.9
Yugoslav 15.5 15.4
Eo Germany 21 .6 21 .6
Poland 25o2 25o2
Czechosl. 16.9 1609
Hungary
55.6
0.7 2.0 5008Rumania 14.4 0.3 Oo2 13o9
Bulgaria 12o2 12.2
Extra EEC 184.1 1.9 4.8 17608
(v) Veal, Fresh or chilled
France 7.3
5.,7
1.6Neth. 60.7 2.8 1.7 23.8 32.3
intra EEC 69.1 J.1 1. 7 29.8 34.5
Denmark 45.2 0.3 2.0 o.8 4.2 3808
Yugoslav 4.3 0.3 3.9
Czechosl.
5.0
0.3 4.6Rumania 3.5 0.3 .3 .2
Bulgaria 1.4 1 .. 4
extra EEC 60.J 0.7 2.1 o.8 4.9 51.8
(vi) Beef, excluding veal, in whole carcasses, halves or quarters, fresh or chilledo
France 90.2
5.7
75o7 8 .. 7U.E.B.L. 13.3 0.3 7.7 4 .. 0 1o2
Neth. 6.7 1.6 0.4 2.0 2o7
190
Tabl e
1 011
(a) (vi) contd.Origin E.E.C. France U.E.B.L. Neth. Germany Italy
intra EEC
12609
10.4
o.6
13.4
82.1
20o4
Sweden
9.3
1.8
0.1
1 o4
5o9
Denmark
1406
1.7
4.1
6.3
0.1
2.3
Austria
1.2
1.0
Yugoslavia
23.8
1.0
1.7
0.7
20.3
Poland
6.7
0.3
0.7
506
Czechosl.
2o4
2.4
Hungary
10.9
3.4
1.2
0.7
506
Rumania
2.7
2.5
Bulgaria
1 .9
1 .9
Uraquay
1.7
0.9
0.4
0.4
Argentine
4o5
0.3
2.3
0.5
0.4
1 .1
extra EEC
81 .1
8.2
12. 7
9.1
2.3
48.9
(vii) Beef Cuts, fresh or chilled
France
3.6
0.2
2.8
o.6
U.E.B.L.
2.3
0.1
2.2
Neth.
8.2
1 .3
0.2
6.7
Germany
9.0
9.0
intra EEC
23.2
1 .3
0.2
0.3
2.9
18.6
Denmark ~.2
2.2
Yugoslavia
12.6
12.6
Poland
1.8
1.8
Czechosl.
1
.51.5
Hungary
3.0
3.0
Rumania
1
.51.5
Bulgaria
1 o2
1.2
Argentine
1
.20.1
1 01
extra EEC
26.4
0.3
0.1
25.9
(viii) Beef, excluding veal, in whole
carcases, halves or quarters, frozen
France
29.2
2.3
1.6
24.8
0.5
Germany
1.6
0.5
1 .1
intra EEC
31.5
2.8
3.3
24.8
0.5
Denmark
4.3
1.0
3 .1
Brazil
4.6
0.9
1.9
0.2
1.5
Hungary
8.2
1.0
1.2
Oo6
5.3
Argentine
33.7
3.0
2.6
20.7
7.4
extra EEC
53.1
5.2
7 .1
24.9
15.9
(ix) Beef cuts, frozen
U.E.B.L.
1 .1
0.2
0.9
Table 1o11 (a) (ix) contdo
Origin E.E.C. France U.E.B.L. Neth. Germany Italy
Rumani a 7.7 7o7
Madagascar 1o2 1o2
Braz i l 7o9 2o0 1o2 4o7
Hungary 4o1 Oo4 Oo4 1.8 1
o5
Argentine 45o7 6.8 803 1JoJ 17o2
extra EEC 69o5 8.8 1Oo7 16.4 0.5 JJo1
Source: Commerce exterieur: Tableaux analytiques (Nimexe), Volume A - Produits agricoles Column 1 gives the country of origin, column 2 gives the total imports by the E.E.C. from that country, while columns 3 - 7 show how much of this went to each individual country of the E.E.C. Nine classes are represented, four for live animals - calves, steers, cows and others - and five for meat - fresh and chilled veal, fresh and chilled beef (both carcass and cuts), and frozen beef (carcass and cuts)o
The trade in calves, which amounts to 18% of the live
animal trade, is almost totally directed into Italy. France and Germany are the only major exporters within the E.E.C., and they sell the bulk of their calves to Italy. Apart from Austria (and to a limited extent Ireland) all extra E.E.C. imports come from the East European communist countries, especially Yugoslavia and Poland, exporting to ltalyo
The only major exporter within the E.E.C. of non- breeding bulls (13% of live trade) is France, again selling mainly to Italy, but
U.E.B.L.~ the Netherlands, Germany, and Italy all buy similar quantities from outside the E.E.C., most of it from Hungary and Czeckoslavakia with Denmark and Austria supplying smaller amounts.
mark is the major exporter to the EoE.Co9 selling mainly to Germany
(57p800
out of69,800
mito in1968)
with UoEoBoLo and the Netherlands accepting smaller amountso Austria and Hungary also supply some cows, mainly to GermanyoThe fourth live animal category given includes all othe~
classes not previously included (ioeo steers of various ages) and the table shows that Italy is again the major market, only minor quantities going to any of the other four areaso France is the only importer
within the EoEoCo and East Europe plus Austria account for most of Italy's extra E.EoCo imports; especially Hungaryp Poland and East Germanyo
Trade in fresh or chilled veal, almost a quarter of the total meat trade, is dominated by two countries, the Netherlands and Den-marko In
1968
the Netherlands sold large quantities to Italy andGer-many, while Denmark sold mainly to Italy with smaller amounts to Germanyo
The most important class of beef in terms of trade is fresh or chilled carcases of beef, accounting for 38% of the total meat tradeo The most important supplier within the EoEoCo is France, selling most to Germanyo Extra-EoEoCo trade in this class is less important with Eastern Europe and Denmark supplying mosto Fresh or chilled cuts are
not important (only
9%
of trade in1968)
Yugoslavia being the only notable supplier in19680
Frozen beef, in carcasses and cuts, represented 28% of the total meat trade in
19680
Apart from France, the main suppliers were outside the EoE.Co, South America being particularly importantoand Germany9 and cuts to Italy, the Netherlands, UoE.B.L. and Franceo In summary9 using 1968 as a typical year, the principal
ex-porters of live animals to the E.E.C. are Denmark, Austria and the Eastern European countries especially Yugoslavia9 Hungary and
Czeckeslovakia. Denmark dominates the veal trade and shares the
chilled meat trade with Eastern Europeo Frozen meat imports are mostly from South America, particularly Argentine and Ur aguayo The main
recipient is ltaly9 with Germany also receiving substantial quantities.
U.E.B.L. i s also a net importer, France and the Netherlands are net exporters, but receive lesser quantities of meat, both chilled and frozen.
Within the E.E.C., France and the Netherlands (especially in the case of veal) do most of the selling, and Italy and Germany most of the buyingo
1.4 E.E.C. Market Regulations for Beef and Vealo
Although it is not within the scope of this study to examine quantitatively the effects of the E.E.C. common agricultural policy and its associated trade regulations, on the production, trade and consumption of Beef and Veal within the area, a brief description is included so that they may be borne in mind during the analysis to follow.
1.4.1 Brief History of the Common Agricultural Pol i cy
The Treaty of Rome was signed in 1957 and its Agricultural Policy was implemented from the 1 January 1959 with the aim of
23.
Pr ovisions we re made f or the gradual reduc ti on of customs duties be-t ween member c ounbe-t r i es p be-the gradual inbe-tr oducbe-t i on of a common cus be-toms t arif f 0 t he abol iti on of quant i tati ve restr i ct i ons be tween membe r
stat es p co- or di nat ion in i mprovement of agricultural struc ture and the es t abl i s hment of common pri ce l evels o
So t ha t t he a tt a i nmen t of common pri ces for commodities would no t disrupt unduly the in t ernal markets of membe r s a system of " variabl e levies" was adopted ; i n which an amount i s levi ed which wi ll compe n-sate for t he d if fe r ence bet ween t he pr ice ruling in the member c ount ry and the pri ce on t he world mar ke tp or the pri ce of another membe r
countryo Duri ng his trans iti onal per iod prices are equalized p t hus dispensing wi th the levies i n i nt ra- communi ty t r ade, and leaving uni-form levies Qn imports from third count r ies o Pri ces a r e e qual i zed by the setting of "t arget " pricesp whi ch set levels for national prices to aim for, and whi ch lead p ove r the t r ansitional period to unif icationo However, these " t arget s " may no t be e asily at t ained p and so "threshold"
prices were s e t at a percent age of the t ar get pr ice , usually based on market condit i ons, and t he amoun t of pr otection r equired fo r the
commodity - they ar e the pract i cal steps i n a tt a i ni ng the goal which i s eventually comple t e unificat i ono
An "int erve nt ion" price i s a l so set a t some percentage of t he threshold price (or targe t pri ce )p usually 90- 95%, at whi ch approved purchasing agenc i es ente r and support t he mar ke t o
on the basis of the best overseas terms available) and the threshold price (or the guide price after achievement of unification). However, if the internal price rises too high the levy is not appliedp and
cheaper imports may enter the countryo
"Export restitutions" can be made to "enable the E.E.C. countries to meet competition, either on the world market or on the markets of other E.E.C. countries." These restitutions are simply an export subsidy.,
Finance is handled by the European Agricultural Guidance and Guarantee Fund (E.A.G . G.F.) the Guarantee section of which finances the
common organisation of markets, restitution on exports and intervention on domestic markets; while the Guidance Section can finance with capital grants any approved project which seeks to improve the structure of agriculture in a member country; especially in its backward regionso
Originally an arbitrary scale was laid down to decide who contributed what to the fundp but this has been gradually replaced by a scale based on the net imports of member nationso
~ Table 1.12
Percentage of Contribution to Fund
1965/66 1966/67
Belgium 7 .. 95 7.95
Germany 31.67 30.83
France 32.58 29026
Italy 18 .. 00 22000
Luxembourg 0 .. 22 0.22
Table 1o13
E.A.G.G.F. Expenditure during 1st Three Financial Years ln 1000 Units of Account
Guarantee Section
A. Restitutions on exports to 3rd countries.
Cereals Pigmeat Eggs
Poultry
Dairy Products Rice
Total A
B. Intervention home market.
Dairy Products Other
Total B
on
Total for Guarantee Guidance Section Grand Total
Section
(U
.s.
$)1962/63 21,496
50
551 164 2211261 3,241 3,220 6,461 28,722 9,574 38,296 1963/64 4111990 1, 710 968 700 45,368 3,267 511625 811892 5411260 1811087 7211347 250 1964/65 1121) 208 711665 1p210 1,250 1711867 769 140, 969 711196 711350 7,410 211)956 16211925 5411308 217p233Table 1 014
1962/63 1963/64 1964/65
Ge rmany 1790 (603) 2637(40 7) 8896(4)
Belgium 305 (LO) 382(006) 1974( 1 o4)
France 24479(86) 45569(85) 122014(67)
Italy 1281(302) 705(103) 5211(606)
Luxembourg 3 5 15
Netherlands 864(3 o3) 4962(704) 2481 (21)
28722 54260 162925
It is interesting to compare the above percentages with those of Table 1.120
1.4.2 Regulations for Beef and Veal
Beef and Veal (which includes live non-breeding cattle, freshp chilled, frozen, dried, smoked, plus offal and fat) became financed under C.A.P. on the 29th July, 1968. Member countries keep 1o% of the levy revenue plus the receipts from customs duties, 9o% of the levies go to E.A . GoG.F. which pays the cost of intervent i on and export r esti-tutiono
For Beef and veal, a "guide'' price replaced the usual target priceo It is not tied to the price of feed grains, as othe r live stock product target prices are, but is the pr ice which, it is consideredp producers ought to get under normal market conditions. The guide price for cattle and calves is fixed before the 1st October each year, taking into account production and consumption trends, and the milk and dairy product situationo
27.
support system is describedo
(a) Market Price: This is a single price constructed from weekly recordings of market prices throughout the Communityo For each indi-vi dual country with more than one representative market the prices are averaged ari thmetically and then the country averages are weighted according to the following proportions to produce a single E.E.C. Market priceo
%
Belgium 5o2
Germany 27.5
France 40 .. 8
Italy 18o9
Netherlands 7oJ
Luxembourg O.J
These weights are based on productiono
(b) Import Price: Weekly prices for fat cattle in Austria, Denmarkp England and Ireland are used to calculate the import price. This is
done using the following weights:
%
Austria 15
Denmark 50
England
&
Wales 25Ireland 10
An adjustment is then made to take account of transport costso The import price for calves is calculated with reference to the Danish market onlyo
C.A.P. acts in two ways to ensure that the producer price stays as close as possible to the guide priceo
(i) Interventiono When the market price falls below
98%
of the guide price member states may intervene (buy) at their discretion per medium of national agencies. Intervention is compulsory when themarket price falls below 931' of the guide priceo Intervention does not apply to calves or vealo
(ii) Protection against Imports. This is done by a combination of customs duty and a variable levyo The duty is permanently applied on an ad valorem basis as
follows:-16% for live animals,
2o% for meat and edible offals, fresh chilled or frozen,
24%
for meat and edible offals, salted in brine, dried orsmoked,
261' for other preparations of meat or offal,
B.8%
for fats, rendered or on renderedoThe levy is the difference, for each week, between the import price, plus the ad valorem duty, and the Comm~nity guide price. The levy is not always applied in full - the rate of applicat i on depends on the relationship between the zuide price set for that particular year and actual price prevailing at the time - the market pr i ce - according to the
market pri ce 100- 102% guide price - ~levy market pri ce 102- 104% guide price - ~ levy market price 104~106% guide price - ~ levy market price ,;> 106% guide price - no levy
290
This system gives adequate (price) protection when prices are low (and quantityp presumably9 high) but allows beef and veal to enter
with only the duty t o overcome when prices are high within the Communityo
Meat is subject t o the same basic regulations as the live animals, except for frozen meat which was recognized as having rather different market relationshipso
Beef and veal9 other than frozen, are first subject to an ad
valorem duty of 2o% and then a levy, which is proportionate to the levy applied lo calves and fat cattle at that time (the duty is
24%
if the meat is dried, smoked, salted or in brine)o The coefficients9which represent the normal relationship between the fat cattle or calf prices and the appropriate meat price, are listed below:
Product Coefficient
(a) of calves
(b)
1 0
2o
3.
Carcasses or sides
Forequarters, joined or separated Hindquarters, joined or separated of fat cattle
Carcasses, sides or paired quarters Forequarters
Product Coefficient
(c) Other forms of ·meat from calves or fat cattle
1 0 Un-boned pieces
Boned pieces
(d) Edible meat from domestic bovine animals, salted or
in brinep dried or smokedp
1 • Un-boned
Boned
2.85
3 .40
Frozen beef was recognized as different largely because the
markets used to calculate the import price for fat cattle, which in
turn was used to calculate, by the coefficients above, the levies on
fresh, chilled or preserved meat, namely the markets of Austria,
Denmark, England and Ireland, bore little relation to prices in markets
of the main source of frozen meat - South America. The position was
further complicated by the need to ensure adequate supplies for the
food processing industries of the Community. After the application
of the duty (2o%) a levy is imposed which represents the difference
between the guide price, multiplied by a coefficient derived from the
ratio between the price of fresh beef of comparable type and the fat
cattle price, and the "world" price for frozen beef. The world price
is one which is representative of the market in the exporting
countries, and for the same quality of beef as that offered on the
world marketo Depending on the conditions prevailing, the levy on meat
destined for processing industry can be wholly or partly suspended at
the discretion of the Commissiono To qualify manufacturers must
guaran-tee that the imported beef will be used solely for processed meat, and
310
CHAPTER II
A REVIEW OF SOME PREVIOUS ECONOMETRIC ANALYSES OF DEMAND FOR BEEF, WITH PARTICULAR REFERENCE TO THE E.E.C. COUNTRIES
In this chapter, previous econometric studies are reviewed as a basis of comparison for the analysis to follow. This is by no means an exhaustive list, the main limitation being availability in New Zealand.
2.1 A. Weber
<
1> (1960)As part of a comprehensive study of the E.E.C. meat market Weber estimated demand elasticities for beef, veal and pigmeat for the five main European countries. For all the estimates he used a relationship of the
form:-C = per caput consumption of the particular meat P
1g P2 =deflated retail price of beef or veal and pigmeat Y
=
per caput meat income.The equations were estimated in double log form - for two reasons, one technical (ioe• it was easier) and because no flattening (1) Weber A: Structur und Dynamik des Fleischverbrauchs in den L°andern
of the demand curve had been observed - the time period was from
1950 to 1958 using annual observationso
The analysis had many defectsp readily admitted by Weber, but
is the most comprehensive available and made much of the limited
inform-ation availableo Because of the low number of observinform-ations (n
=
9)standard errors are not calculated, but the figures given are a
judge-ment of the allowability of the estimateso
~
Many of Weber's problems revolved around the data, especially
because the period studied, 1950-58, was a recovery period for the area
from the rigours of waro
(a) Incomeo Weber rejected the usual source, Gross or Net National
Product, because of the influence of fluctuating levels of investment,
and used instead estimates of private consumption per caput in constant
(1964) priceso On this basis he found income increased more sharply
1950-58 in Germany, with increases average in France and Italy, and low
in Belgium and Hollando The elasticities obtained using this method
were found to be significant enougho
(b) Prices. Acceptable data for prices was found to be much more
difficult to obtain than for incomeo Representative prices (ioeo the
retail price of a certain cut is taken as typical and therefore
re-presentative of price trends for the meat group as a whole) and
weighted averages were considered, but lack of good data caused many
estimates to be non-signif icanto
{c) £onsumptiono No country gave a breakdown of consumption into
being too high as fresh meat pric es i ncreased faster t han processed meat prices in times of strong economic growt ho
C~oss price elastic ities between cattle and pigmeats were
calculated9 but intercorrelation between income and price was apparentp
with the small number of observationso
!esul t s
(1950-58
except where shown)oCountry Elastic ities
Belgium 1 0
"
Germany 1 0
"
"(1950/51-1958/59) Jo
"(1950/51-1958/59)40
France 1 0
11
Italy 1 0
Income
1 "49
(Oo38)
1o47
(Oo51
1o05
(Oo07)
1o07
(Oo05)
1 021foo07)
1o19
(0006)1o1 3
(Oo12)1o22
(0011)2o 06
(Oo15)
Price ~20 04(Oo58
-2o08
( 1o09)
-Oo61
(Oo16)
-Oo59
(Oo10)
-Oo97
(Oo19
-0.,85
(Oo15)
-Oo63
(Oo20)
~Oo74(Oo
18)
- Oo23(0 .,41)
Country Elasticil.tiies
Income Pir.Ji.<ee Cross Price R2
I tally 2o 2o24 =0 o9J Oo70 Oo99
(Oo11) (OoJS) (Oo27)
Nethe Jrl ands 1 0 Oo73 - Oo80 Oo80
(00 20) foo.39)
90 2o 1 oJ.3 ~10.3.3 1 oOJ Oo95
(Oo19) ( Oo26) (Oo72)
(All estimates were for beef onlyp except for I t aly where beef and veal are combinedo)
Weber was unhappy with the estimates for Belgi ump cons i dering that both the pr ice and income e l as ticiti es we r e over- estimated con-siderably o He doub ted whether the inc ome elast.icity would be greater than 1 oO a nd the pr ice elasti city gre ateir t.hwn ~O oS.,
The estimates for Germany were cons i dered acceptable. and the one for t ax years ins te ad of cale ndar years gave better esti mation be= cause they mo re logically allo ca ted seas onal var i a ti on o Firance als o has a rather high income elasticity of 1o20 and I t aly even gre ate r at
2o2o In defence9 Weber po i nted out that a t this ti me (the 1950's)
meat consumption was9 because of low incomep at a low level and any
increase i n income was likely t o give a mo re t han pro porti onate in= crease in meat consumptiono
Netherlandso
In many instances in the work reviewed above, Weber was forced t o use pri ce data which he felt was not truly representative or which contained errors in collection; and in the light of this, the following are the elasticities which he finally postulated for the EoE.Co
Income Price Cross
Be lgium 1 oO - Oo8
Germany 1o0 -008
Fr ance 1 01 -008
Italy ( 1 ) 2.0
-Oo9
Netherlands 1o2 -Oo8
This study was an analysis of the demand for meat in Francep and contained several estimates of elasticities for beef a
Faure used equations of two main types, the first quantity depen-dent and the second price dependepen-dent :
where
log q
=
ep log P + er log R + Clog P
=
a log q + b log R + C q = per ca put consumption0 0 0 0 0 0
0 0 0 0 0 0 ( 1 )
(2)
p
= price of beef (retail and deflated)
R = on index of total consumption, def lated a
c
= constantep
=
price elasticity for beef(1) Beef and veal