www.pharmascholars.com
124
Original Article
CODEN: IJPNL6
FORMULATION AND EVALUATION OF ATORVASTATIN CALCIUM
SUSTAINED RELEASE TABLETS
Sandhya Mandadi
1, Vishwanadham Yerragunta
2, Umema Naaz Tarkash
2 1Gland Institute of Pharmaceutical Sciences, Kothapet, Medak, Telangana, India
2Vishnu Institute of Pharmaceutical Education & Research, Narsapur, Medak, Telangana, India
*Corresponding author e-mail: [email protected]
Received on: 18-05-2016; Revised on: 24-06-2016; Accepted on: 28-06-2016
ABSTRACT
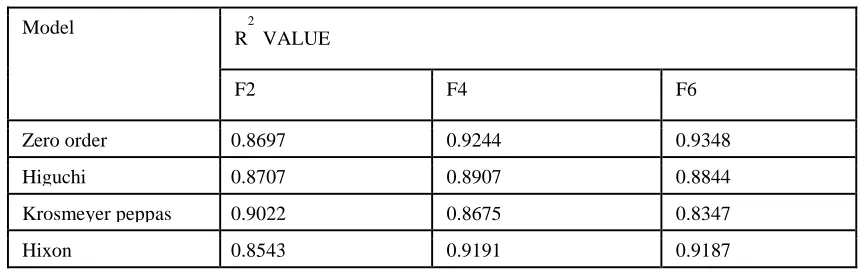
The objective of the study was to develop the sustained release matrix tablets of various concentrations of natural and synthetic hydrophilic polymers on in-vitro release rate from the prepared Atorvastatin calcium tablets. The obtained in-vitro dissolution data were fitted in different models and for F2 batch (higher concentration of xanthan gum) the highest correlation was found to korsesmeyer-peppas(R2>0.9022), which indicates the drug diffusion may takes place by erosion mechanism. Formulation F4 and F6 (higher concentration of guar gum and Carrageenan) the data were fitted in to zero order profile where R2 values were found to be 0.9244 and 0.9348 indicates the diffusion mechanism of drug release. Natural polymers were showing good release rate up to 17 h as compared to synthetic polymer in which the xanthan gum at higher concentration can exhibit drug release rate in predictable manner.
Keywords: Atorvastatin calcium, Xanthan gum, Sustained release.
INTRODUCTION
Most conventional oral drug products, such as tablets and capsules, are formulated to release the active drug immediately after oral administration, to obtain rapid and complete systemic drug absorption. The convenient oral drug delivery has been known for decades is the most widely utilized route of administration among all the routes. It remains the preferred route of administration in the discovery and development of new drug candidates. The popularity of oral route is attributed to patient acceptance, ease of administration, accurate dosing, cost effective manufacturing methods and generally improve the shelf life of the product. Sustained release dosage forms are designed to achieve a prolonged therapeutic effect by continuously releasing drug over an extended period of time after administration of a single dose. The advantages of sustained release dosage forms over conventional forms include the less fluctuation in drug blood levels, frequency
reduction in dosing, enhanced convenience and compliance, reduction in adverse side effects and reduction in overall health care costs. The rate of drug release from solid dosage form may be modified by the technologies, which in general are based on modifying drug dissolution through the use of barrier coatings and controlling drug diffusion rates from dosage forms. Generally the different techniques employed to fabricate the modified release dosage forms are coated beads, granules and microspheres, multi tablet system, micro encapsulated drug, complex formation, ion exchange resins, and embedding drug in slowly eroding or hydrophilic matrix system .
Drug Profile : Atorvastatin Calcium:
IUPAC Name : (3R,
R)-7-[2-(4-fluorophenyl)-3-phenyl-4-(phenylcarbamoyl)- 5-propan-2-ylpyrrol-1-yl]-3, 5-dihydroxyheptanoic acid
Chemical Formula : (C33 H34 F N2 O5)2Ca •
International Journal of Pharmacy
www.pharmascholars.com
125
3H2OMolecular Weight : 1209.42
Chemical Structure:
Physical State : White to off-white
crystalline powder
Stability : Stable under ordinary
conditions
Melting Point : 168 – 170 ° c
Description: Atorvastatin calcium is a member of the drug class known as statins. Atorvastatin calcium is a synthetic lipid-lowering agent which is a competitive inhibitor of HMG-CoA reductase Which Inhibits 3 hydroxy-3-methylglutaryl-coenzyme reductase the rate-determining enzyme located in hepatic tissue that produces mevalonate, an early and rate-limiting step in cholesterol biosynthesis. This lowers the amount of cholesterol produced which in turn lowers the total amount of LDL cholesterol.
MATERIAL AND METHODS
Preparation of sustained release tablets: Sustained release matrix tablets of Atorvastatin Calcium were prepared by direct compression technique using natural polymers (Xanthan gum, Guar gum and Carrageenan) and synthetic polymers (HPMC K-100M and HPMC 50Cps) with varying concentration. All the ingredients shown in Table 1 except magnesium stearate and talc were weighed, shifted and blended in mixer uniformly. After the sufficient mixing magnesium stearate and talc were added and further mixed for additional 2-3 minutes. The mixture was compressed on a single punch rotary punching machine using 8 mm standard flat face punches to get an average of 150 mg weight of tablets.
Evaluation of sr matrix tablets of atorvastatin calcium:
The following evaluations of tablets were performed:
General Appearance: The uncoated tablets were examined under the lens for the shape of the tablet and colour was observed by keeping the tablets in light.
Weight variation test: 20 tablets were selected randomly from each batch and weighed individually to check for weight variation. As per U.S Pharmacopoeia 2009 a little variation is allowed in the weight of a tablet. The following percentage deviation in weight variation is allowed as shown in the table 2. In all formulations, the tablet weighed is 150 mg, hence 7.5 percentage deviations are allowed.
RESULTS AND DISCUSSION:
Preformulation studies:
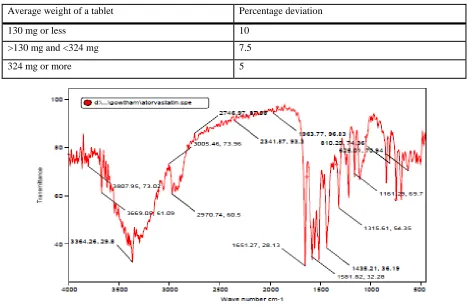
Identification of drug by using FTIR: The FT-IR spectrum of At.Ca (Fig no:9) shows the characteristic absorption spectrum in the region 3364 cm-1 (O-H str, H-bonded) may due to presence of alcohols, At the wave number 3100-3000 cm-1(C-H str) due to the aromatic group. At the wave number 2970cm-1 (C-H str) may indicate the presence of alkanes. The region 1651cm-1 (C=O str) were indicates for carbonyl group. The wave number at 1435 cm-1 (C-H bend) may indicate for alkanes. The peak at 1161 cm-1 may represent for (C-H wag) halides and at 675cm-1 may indicates for =C-H bend. The above represented groups were confirmed with the standard spectrum.
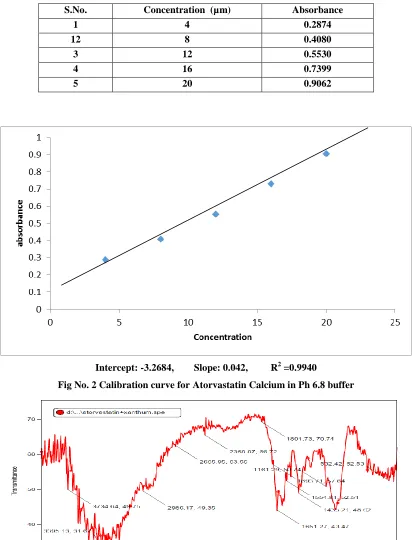
Standard Calibration Curve: Standard curve of Atorvastatin Calcium was obtained by plotting absorbance Vs concentration. The absorbance values are tabulated in Table 3. The standard calibration curve showed the slope of 0.046 and correlation coefficient of 0.9940. The curve is found to be linear in the range between 4-20µg/ml at 246nm.
Evaluation of atorvastatin calcium sr matrix tablets:
General Appearance: The tablets prepared were white, round and spherical in shape. They are smooth, uniform and free from cracking and chipping.
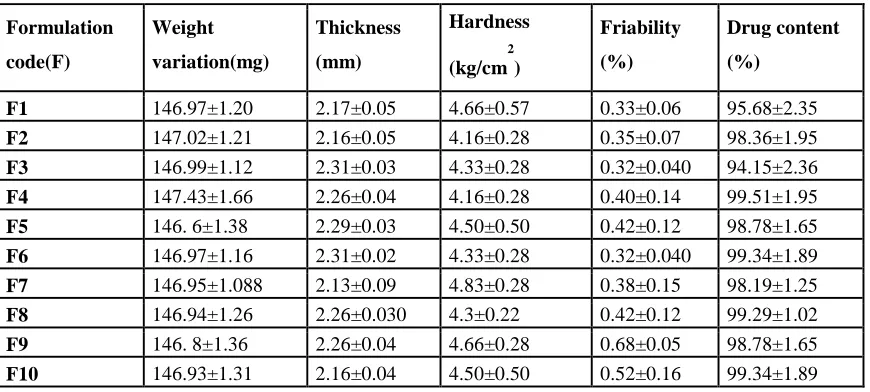
Weight variation test: The percentage weight variations for all the formulation are tabulated in Table 11. All the tablets passed weight variation test as the % weight variation was within the pharmacopoeial limits of ±7.5%. The weight variation among the each batch was found to be in the percentage deviation of 1.08 to 1.66mg showing satisfactory results as per the U.S.P 2009.
www.pharmascholars.com
126
method. In direct compression method (F1 to F10)were found in the range of 2.13±0.09 to 2.31±0.03mm.
Hardness test: Table 4 Show results of hardness. Hardness test was performed by using Pfizer tester. Hardness was maintained to be within 4.1 kg/cm2 to 5.0 kg/cm2. The lower standard deviation values indicated that the hardness of all the formulations were almost uniform in specific method and posses good mechanical strength with sufficient hardness in the range between 4.16±0.28 to 4.83±0.28 kg/cm2.
Friability test: Table 4 show results of percentage friability. The percentage friability was determined to be below 1% for all the prepared batches which is an indication of good mechanical resistance of the tablet.
Drug content uniformity: The content uniformity was performed for all the formulations and results are shown in table 4 three trials from each formulation were analyzed spectrophotometrically. The mean value and standard deviation of all the formulations were calculated. The results indicated that in all the formulation F1 to F10 it was found to be from 96.78±1.65 to 99.34±1.89.
In vitro dissolution studies: The in-vitro drug release was studied in the USP paddle type apparatus using pH 6.8 phosphate buffer. The formulations F1-F6 are prepared with the natural polymers like xanthan gum, guar gum, Carrageenan gum and the formulations F7-F10 are prepared with the synthetic polymers like HPMC K100M and HPMC 50cps with various concentrations of polymers 45mg and 60mg. The formulations prepared with 45 mg of natural polymers F1, F3 and F5 were showing the drug release for up to 8h. Whereas at 60mg concentration the drug release was retarded significantly and was found to be 72%(F2), 99%(F4) and 84%(F6) up to 17h. It also indicates that, for F2 batch (containing 60mg of xanthan gum) more lag time was takes place to release 52% of drug as compared to other polymers. In the case of synthetic polymers HPMC K100M (F7 and F8) both at 45mg and 60mg concentrations the drug release was takes place up to 10 hours (97% and 99%). Similarly for F9 and F10 containing HPMC 50Cps were also exhibits the release retarding effect for up to 7h. Among the natural polymers used in the formulation, with respect to t50% valves F1 and F2 containing xanthan
gum were showed higher drug release rate than the guar gum and Carrageenan and was found to be 7h and 12h for 45mg and 60mg concentrations. It was followed by guar gum where exhibits the drug release rate 5h and 8h for releasing 50% of drug (for 45mg and 60mg) where as Carrageenan within 5min, 50% of At.Ca was released and 60mg it takes 8h. The dose dumping may found to be takes place at lower concentration of Carrageenan.
In case of synthetic hydrophilic polymer the higher viscous grade HPMC K100M were produce the release retarding effect in moderate range with respect to t50% valves and was found to be 6h and 7h for 45mg and 60mg. All the comparative t50% valves are shown in the Fig no. 25.
At 45mg and 60mg concentration of HPMC 50Cps the t50% valve was found to be 3h and 5h. Based on t50% valves we can observe that the concentration variations of synthetic polymer were not producing the significant effect as like that of natural polymers.
This above results depicts that the drug diffusivity occurs slowly in higher concentration of natural polymers than that of the synthetic polymer.
Curve Fitting Analysis: The obtained in vitro dissolution data were fitted in different models and for F2 batch (higher concentration of xanthan gum) the highest correlation was found to korsesmeyer-peppas(R2>0.9022), which indicates the drug release diffusion may takes by erosion mechanism. Formulation F4 and F6 (higher concentration of guar gum and Carrageenan) the data were fitted in to zero order profile where R2 values were found to be 0.9244 and 0.9348 indicates the diffusion mechanism of drug release.
SUMMARY AND CONCLUSION
The present work was aimed to study the effect of various concentrations of natural and synthetic hydrophilic polymers on in-vitro release rate from the prepared Atorvastatin calcium tablets. Natural polymers were showing good release rate up to 17h as compared to synthetic polymer in which the xanthan gum at higher concentration can exhibit drug release rate in predictable manner.
Acknowledgements:
www.pharmascholars.com
127
Table 1 Composition of Atorvastatin calcium SR matrix tablets by direct compression method
INGREDIENTS (mg) F1 F2 F3 F4 F5 F6 F7 F8 F9 F10
Atorvastatin calcium 10 10 10 10 10 10 10 10 10 10
Xanthan gum 45 60 - - - - - - - -
Guar gum - - 45 60 - - - - - -
Carrageenan - - - - 45 60 - - - -
HPMC K-100 - - - - 45 60 - -
HPMC 50CPS - - - - - - 45 60
Lactose 71 56 71 56 71 56 71 56 71 56
Avicel pH 102 20 20 20 20 20 20 20 20 20 20
Magnesium sterate 2 2 2 2 2 2 2 2 2 2
Talc 2 2 2 2 2 2 2 2 2 2
TOTAL 150 150 150 150 150 150 150 150 150 150
Table 2 Limits for weight variation as per U.S.P
Average weight of a tablet Percentage deviation
130 mg or less 10
>130 mg and <324 mg 7.5
324 mg or more 5
www.pharmascholars.com
128
Table 3 Calibration curve data for Atorvastatin Calcium
S.No. Concentration (µm) Absorbance
1 4 0.2874
12 8 0.4080
3 12 0.5530
4 16 0.7399
5 20 0.9062
Intercept: -3.2684, Slope: 0.042, R2 =0.9940
Fig No. 2 Calibration curve for Atorvastatin Calcium in Ph 6.8 buffer
.
www.pharmascholars.com
129
Table 4 Characterization of Atorvastatin Calcium SR Matrix tablets
Table 5 In-vitro release data for the formulations F1-F10
Time
(hrs) F1 F2 F3 F4 F5 F6 F7 F8 F9 F10
1 8.03 1.7 38.21 8.16 64.24 17.21 5.72 3.64 25.01 12.46
2 10.47 11.22 43.01 13.45 65.43 18.69 10.04 10.1 43.53 24.9
3 12.92 12.28 43.21 13.75 68.69 19.54 12.4 15.2 54.22 32.17
4 16.3 16.15 47.41 14.14 71.2 21.23 16.11 20.65 64.8 37.7
5 22.75 16.86 50.33 15.64 74.55 24.41 39.97 36.14 74.37 52.65
6 39.39 19.4 64.59 20.63 88.4 24.61 50.45 49.23 82.42 63.24
7 51.49 19.98 78.4 21.75 93.85 25.5 57.49 55.65 101.34 99.87
8 98.23 43.09 97.35 63.73 102.56 54.12 76.4 63.15 _ _
9 _ 46.07 _ 66.56 _ 55.74 85.58 78.14 _ _
10 _ 46.45 _ 69.06 _ 55.94 97.65 99.85 _ _
11 _ 46.7 _ 74.54 _ 57.98 _ _ _ _
12 _ 48.33 _ 76.27 _ 58.38 _ _ _ _
13 _ 55.25 _ 76.83 _ 59.97 _ _ _ _
14 _ 57.7 _ 82.91 _ 73.51 _ _ _ _
15 _ 61.97 _ 91.59 _ 81.39 _ _ _ _
16 _ 62.51 _ 94.52 _ 83.31 _ _ _ _
17 _ 72.45 _ 98.91 _ 84.15 _ _ _ _
(F1- Xan 45mg, F2-Xan 60mg, F3 GG-45mg, F4 GG-60mg, F5-Carr 45mg, F6-Carr 60mg, F7-HPMC K100M
45mg, F8-HPMC K100M 60mg, F9-HPMC 50Cps 45mg, F10-HPMC 50Cps 60mg)
Formulation
code(F)
Weight
variation(mg)
Thickness
(mm)
Hardness
(kg/cm
2
)
Friability
(%)
Drug content
(%)
F1 146.97±1.20 2.17±0.05 4.66±0.57 0.33±0.06 95.68±2.35
F2 147.02±1.21 2.16±0.05 4.16±0.28 0.35±0.07 98.36±1.95
F3 146.99±1.12 2.31±0.03 4.33±0.28 0.32±0.040 94.15±2.36
F4 147.43±1.66 2.26±0.04 4.16±0.28 0.40±0.14 99.51±1.95
F5 146. 6±1.38 2.29±0.03 4.50±0.50 0.42±0.12 98.78±1.65
F6 146.97±1.16 2.31±0.02 4.33±0.28 0.32±0.040 99.34±1.89
F7 146.95±1.088 2.13±0.09 4.83±0.28 0.38±0.15 98.19±1.25
F8 146.94±1.26 2.26±0.030 4.3±0.22 0.42±0.12 99.29±1.02
F9 146. 8±1.36 2.26±0.04 4.66±0.28 0.68±0.05 98.78±1.65
www.pharmascholars.com
130
Table 6 In vitro release Kinetic data for the optimized formulations
Model
R 2
VALUE
F2 F4 F6
Zero order 0.8697 0.9244 0.9348
Higuchi 0.8707 0.8907 0.8844
Krosmeyer peppas 0.9022 0.8675 0.8347
Hixon 0.8543 0.9191 0.9187
REFERENCES
1. Afrasim M and Shivakumar HG,
Trop J Pharm Res
, 2010; 9 (3): 283-291.2. Afsar CS, Sayyednazim, shaikhsiraj, tarique khan, arshad S, Int J Pharm PharmSci, 2011; 3(2), 145:148. 3. Akhtar rasul, Muhammad Iqbal, GhulamMurtaza, Muhammad k. Waqas, Muhammad Hanif, ShujaatA.
Khan, and Naveed S. Bhatti, Acta Pol. Pharm., 2010; 67(5): 517-522.
4. Anil Lachke, Xanthan – A Versatile Gum, RESONANCE, 2004; pp. 25-33.
5. Arunkumar N, Deecaraman M, Rani C, Mohanraj K P, Venkateskumar K Asian Journal of Pharmaceutics
2010; 4(1):28-33
6. Arunkumar.N, M.Deecaraman, C.Rani, K.P.Mohanraj, K.Venkates Kumar, Int.J. PharmTech Res, 2009; 1(4): 1725-1730.
7. Asha S. John, Sathesh B. P. R, GoliDivakar, Manoj K. Jangid and Kapil K. Purohit, Journal of Current Pharmaceutical Research, JCPR, 2010; 01:31-38.
8. Bangale G.S, Stephen Rathinaraj B, Shinde G.V, Umalkar D.G. and Rajesh K.S, Ind J Pharm Edu Res, 2011; 45(4): 375-383
9. Brahmankar D.M, Sunil B. Jaiswal, Biopharmaceutics and Pharmacokinetics, First edition , Vallabh Prakashan, New Delhi, 1995; pp. 51-55.