An Efficient Approach to Track RBC and Detect
Blood Disease using Blood Samples
Kiran Tiwari Prof. Mrs. Pooja Thakre
Student H.O. D
Department of Electronics and Telecommunication Engineering
Department of Electronics and Telecommunication Engineering
Nuva College of Engineering and Technology, Nagpur, Maharashtra, India
Nuva College of Engineering and Technology, Nagpur, Maharashtra, India
Abstract
The measure of WBC and RBC Cells are very crucial to diagnose various diseases. Diseases like anaemia, leukaemia etc. can easily diagnose by calculation of WBC and RBC. Healthcare industries are focusing on the approach to generate report of blood cell count in fast and cost-effective way. Conventional method of manual measurement of red blood cell under a microscope yields incorrect results, consumes more time and very expensive. In market, there are numerous systems available for the automatic quantification of blood cells. These systems allow counting the number of different types of cells within the blood smear slides. The aim objective of this research is to produce a survey on computer vision system used image processing algorithms to detect and estimate the number of red blood cells in the blood sample image. In this project, image processing algorithms are used for counting of blood cells. Image processing algorithms involve six major steps: image acquisition, pre-processing, image enhancement, image segmentation, feature extraction and counting algorithm. In this project, segmentation, detection, and counting red blood cells in the blood sample image is carried out using Hough Transform, Roughest theory and KNN method.
Keywords: Red Blood Cells, Hough Transform; Roughest theory; segmentation; White Blood Cell
________________________________________________________________________________________________________
I. INTRODUCTION
In diagnosis of several diseases, major step is automated detection and counting of red blood cells. In the conventional procedure, haematologist manually counts and classifies the cells with the help of a microscope. The task is to measure the red blood cells and assess the size and shape of red blood cells. But this procedure is time consuming, complex and tedious. Also, the accuracy of recognition is affected by subjective factors like experience and fatigue due to human tiredness. As a solution to this problem, to provide automated, cost-effective and efficient alternative to detection and counting of RBCs, and also detection of blood disease using image processing techniques are used.
For overall health evaluation and diagnosis of many disorders including anaemia, infection and leukaemia, complete blood count is required. The human blood consists of three types of blood cells such as red blood cell (RBC), white blood cell (WBC) and platelets (PLT). A person’s health is determined using complete blood count. Blood cell segmentation and identification is important as blood being health indicator. Abnormal increase or decrease in cell count indicates that person has underlying medical condition.
Red blood cells are the most important and numerous blood cells in human body. Main function of RBC’s is to carrying oxygen and delivering it to the cells in the body. A depletion of red blood cells may lead to anemia. Anemia results in dizziness, fatigue, or even more serious symptoms if it is remaining untreated. Red blood cell indices provide information about the size and hemoglobin content of the red cells. .
A life span of RBC is of around 120 days for normal individual. Typical red blood cell count (RBC) levels are:
4.2 to 5.4 million cells per micro liter for women
2.6 to 4.8 million cells per micro liter for children
4.5 to 6.2 million cells per micro liter of blood for men.
ways to improve haematology research. Computerized techniques are the best potential choices to carry out and moderate the load of these regular clinical activities for more efficiency and also to describe the frequency, spatial distribution, and portion of blood smear particles.
Computer-aided diagnosis (CAD) also establishes methods for accurate, robust and reproducible measurements of blood smear particles status while reducing human error and diminishing the cost of instruments and material used.
II. LITERATURE SURVEY
Xiaomin Guo and Feihong Yu introduced a method of automatic cell counting based on microscopic images [2]. To calculate adjustable lower and upper threshold value histogram information is used. For segmentation of objects and background, value of the histogram is used. Effect of Floodfill method fills the objects region. It is used to mark or separate regions in an image. A blob is an area of touching pixels with the same logical state. All pixels in an image that belong to a blob are in a foreground state. All other pixels are in a background state. Blob analysis is used to detect blobs in an image and make selected measurements of those blobs. Blob analysis consists of a series of processing operations and analysis functions that produce information about any 2D shape in an image. If size of a blob is beyond the upper threshold of area, the blob will be segmented by K-means clustering algorithm. By calculating the number of cells contained in each blob obtains the total number of cells in whole image. The result shows that maximum relative error is 1.33%, minimum relative error is 0% and the average relative error is 0.46%.
Venkatalakshmi. B et al. proposed a method for automatic red blood cell counting using hough transform [3]. The algorithm for estimating the red blood cells consists of five major steps which are input image acquisition, pre-processing, segmentation, feature extraction and counting. In pre-processing step, original blood smear is converted into HSV image. As Saturation image clearly shows the bright components, it is further used for analysis. First step of segmentation is to find out lower and upper threshold from histogram information. Saturation image is then divided into two binary images based on this information. Morphological area closing is applied to lower pixel value image and morphological dilation and area closing is applied to higher pixel value image. Morphological XOR operation is applied to two binary images and circular hough transform is applied to extract RBCs.
J.N. Fabic et al. described an efficient method for fish detection, counting and species classification from underwater video sequences using blob counting and shape analysis [4]. The proposed system is consists of four major steps: Pre-processing, Contour detection, Blob Counting and Species Identification. Preprocessing is done for cleaning the background by eliminating unwanted objects. It involves Coral Blackening Procedure to blacken out corals using color histogram, Inward-Outer Block Erasure Algorithm to distinguish between fish and water and Edge Cleaning Algorithms for clearly defining edges. Contour Detection utilizes the Canny edge detection to detect fish contours and fill up spaces to allow blob counting. The blob detector is based on Laplacian of Gaussian (LoG). Connected components algorithm is used to label connected regions in binary images and subsets can be uniquely extracted. These results are used for counting, filtering or tracking. Species identification is done with the help of image moment features of the blob. From results, it is observed that the tolerance is less than 10 %.
Haider Adnan Khan et al. presented a framework for cell segmentation and counting by detection of cell centroids in microscopic images [5]. Preprocessing is done with Contrast-Limited Adaptive Histogram Equalization to get enhanced image. Next, cells are separated from background using global thresholding. Then, distance transform of binary image is computed which converts binary image into distance map indicating distance of every cell pixel from its nearest background pixel. In order to perform template matching, the template image is generated from the distance transform of circular disk. Distance map is used to identify the cell centroids. The template matching is done using normalized cross-correlation between template and distance map. Finally, the similarity matrix is complemented and all background pixels are set to -∞. The watershed transform is then applied on this complemented similarity matrix. This splits the similarity matrix into separate disjoint regions. Each region is labeled and counted to get the count. The experimental results show excellent accuracy of 92 % for cell counting even at very high 60 % probability.
Watcharin et al. proposed an algorithm to count blood cells in urine sediment using ANN and hough transform [6]. First step of algorithm is the segmentation between background and blood cells by using feed forward back propagation algorithm. For training neural network, the input is Hue, Saturation, Value and standard deviation. After deriving output from feed forward back propagation, salt and pepper noise is eliminated by using morphological opening and closing method. Last step is blood cell counting using circular Hough transform. Experimental results show the average percentage of error of RBCs and WBCs detection 5.28 and 8.35 respectively.
Marjan Ramin et al. used image analysis technique for counting number of cells in Immunocytochemical (ICC) images [8]. The proposed system contains four major steps: processing, Classification, Separating Bound Nucleus and Cell Counting. Pre-processing consists of removal of random noise by smoothening spatial filter. Morphological open operator is utilized to eliminate images’ background. Banding noise is removed by subtracting median of the red channel from all channels. In order to separate nucleus from antigens, nearest neighbor classification method with Euclidean distance metric is used in L*a*b color space. The bound nucleus is separated by local thresholding algorithm. For this purpose, statistical analysis is done and optimal threshold is found with the help of genetic algorithm. Finally, cell counting is done by tracing the boundaries. From the results, the Error Ratio and Standard Deviation of the proposed method are 6.75% and 6.39% respectively.
Carlos A. B. Mello et al. presented two methods for mosquito eggs counting. These methods are based on a different color model [9]. In the first method, RGB image is converted into HSL color model (Hue, saturation, Lightness). From these three components, the hue image is extracted as it contains information about color tone. Huang thresholding algorithm is applied to the hue image for binarization. A connected components algorithm is used to label the connected regions of the image. Filtering is done using morphological opening operation with structuring element defined in the form of egg. At the last step, it is considered that egg occupies area of 170 pixels. The number of eggs is calculated by dividing the total amount of white pixels by this average area. The second method is based on converting RGB sub-image to YIQ one. From these components, I band is segmented in two ways: by using limiarization with fix threshold of 200 and by binarization using k-means clustering method. For performing egg counting in this method, it is considered that the average size of mosquito egg is 220 pixels
III. PROPOSED WORK
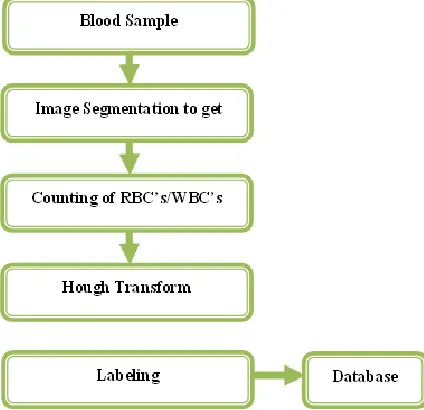
In this work, the count of WBCs and RBCs from the microscopic blood images is calculated and detects blood disease with the prediction of disease with health report generation. If the automatic cell counter counts some extra ordinary number of cells, the cells can be calculated manually to detect the abnormal cells. Image processing technique to segment, detect, and count the number of red blood cells in the blood sample image using Hough Transform for feature extraction is one of the best way, Rough set Theory for segmentation of the image and KNN or SVM classifier for detecting the type of disease. The methodology of proposed work is shown below.
1) Input Image of Blood Sample: The digital microscope is interfaced to a computer and the microscopic images are obtained as digital images. These images are in RGB colour format which is input to the system.
2) Image Segmentation: The next stage deals with image segmentation. Segmentation partitions an input image into foreground and background region. There are various approaches for segmentation i.e. segmentation by using Rough set Theory method and Hough Transform technique as well as segmentation by Means clustering. The objective of segmentation is extraction of desired objects from the background. Segmentation is more complex step and requires more processing time in comparison with other methods. However it is the most important and challenging step because the feature extraction and counting depends on the correct segmentation of RBC.
3) Hough Transform (Detection of Blood Cells): The circular Hough transform is then applied to the contrast adjusted image. This transform searches for the blood cells in the image and then detects them. The function “draw circle” draws circles around the detected cells. Even the overlapped circles are detected.
4) Counting of RBC’s/WBC’s: Counting the number of cells drawn gives the total number of blood cells in the image.
5) Labelling: Here we will be labelling the input image and saving the type of disease to the system, using this label the system will be trained.
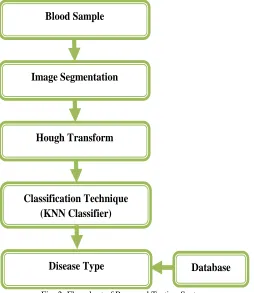
In second flow diagram:
1) Input Image of Blood Sample: The digital microscope is interfaced to a computer and the microscopic images are obtained as digital images. These images are in RGB color format.
2) Image Segmentation: The next stage deals with image segmentation. Segmentation partitions an input image into foreground and background region. There are various approaches for segmentation i.e. segmentation by using Rough set Theory method and Hough Transform technique as well as segmentation by Means clustering. The objective of segmentation is extraction of desired objects from the background. Segmentation is more complex step and requires more processing time in comparison with other methods. However, it is the most important and challenging step because the feature extraction and counting depends on the correct segmentation of RBC.
3) Hough Transform (Detection of Blood Cells): The circular Hough transform is then applied to the contrast adjusted image. This transform searches for the blood cells in the image and then detects them. The function “draw circle” draws circles around the detected cells. Even the overlapped circles are detected.
4) Counting of RBC’s/WBC’s: Counting the number of cells drawn gives the total number of blood cells in the image.
5) Classification: Here the counted cells and features will be compared with the training dataset using either K-nearest neighbour (KNN) or Support Vector Machine (SVM) classifier
Fig. 2: Flowchart of Proposed Testing System IV. EXPECTED RESULT
If you calculate the blood cells using the manual method, the procedure takes nearly one hour to do so. Even now a day, if the automatic cell counter calculates irregular amount of cells in a patient’s blood, the doctor count’s with the manual method to analyze the count. Using the image processing method to calculate the blood cell count helps to do it faster within a fraction of few seconds. In this project, presents a software based solution for counting the blood cells and detect blood disease type. Proposed method of cell counting is fast, cost effective and produces accurate results. It can be easily implemented in medical facilities anywhere with minimal investment in infrastructure. This method can also recognize the overlapping cells and counts them separately. MATLAB software is used in this project.
V. CONCLUSION
Image processing techniques are helpful for object counting and reduce the time of counting effectively. Proper recognition of the object is important for object counting. The accuracy of the algorithm depends on camera used, size of objects, whether or not objects touching and illumination conditions. In this project, presents software based solution for counting the blood cells and detect blood disease type. Proposed method of cell counting is fast, cost effective and produces accurate results. It can be easily
Blood Sample
Image Segmentation
Hough Transform
Classification Technique
(KNN Classifier)
implemented in medical facilities anywhere with minimal investment in infrastructure. This method can also recognize the overlapping cells and counts them separately.
REFERENCES
[1] Jayme Garcia Arnal Barbedo, “Automatic Object Counting in Neubaur Chamber,” Proc. of XXXI Brazilian Telecommunications Symposium, Fortaleza,
Dec. 2013.
[2] Xiaomin Guo and Feihong Yu, “A Method of Automatic Cell Counting Based on Microscopic Image,” 5th International Conference on Intelligent
Human-Machine Systems and Cybernetics, Vol. 1, Aug. 2013. pp. 293-296.
[3] Venkatalaksmi. B and Thilagavathi. K, “Automatic Red Blood Cell Counting Using Hough Transform,” Proc. of 2013 IEEE Conference on Information and
Communication Technology, Apr. 2013, pp. 267-271.
[4] J.N. Fabic, I.E. Turla, J.A. Capacillo, L.T. David and P.C. Naval, Jr, “Fish Population Estimation and Species Classification from Underwater Video Sequences using Blob Counting and Shape Analysis,” 2013 International Underwater Technology Symposium (UT), Mar. 2013. pp. 1-6.
[5] Haider Adnan Khan and Golam Morshed Maruf, “Counting Clustered Cells using Distance Mapping,” 2013 International Conference on Informatics,
Electronics and Vision (ICIEV), May 2013. pp. 1-6.
[6] Watcharin Tangsuksant, Chuchart Pintavirooj, Somchart Taertulakarn, Somsri Daochai, “Development Algorithm to Count Blood Cells in Urine Sediment
using ANN and Hough Transform,” The 2013 Biomedical Engineering International conference, Oct. 2013. pp. 1-4
[7] Jayme Garcia Arnal Barbedo, “Method for Counting Microorganisms and Colonies in Microscopic Images,” 12th Int. Conf. Computer Science and Its
Applications, June 2012. pp. 84-87.
[8] Ramin M., Ahmadvand, P., Sepas-Moghaddam, A.Dehshibi, M.M., “Counting Number of Cells in Immunocytochemical Images using Genetic Algorithm,”
12th International Conference on Hybrid Intelligent Systems, Dec. 2012. pp. 185-190.
[9] Carlos A. B. Mello, Wellington P. dos Santos, Marco A. B. Rodrigues, Ana Lcia B.Candeias, Cristine M. G. Gusmao ,“Image Segmentation of Ovitraps for
Automatic Counting of Aedes Aegypti Eggs,” 30th Annual International IEEE EMBS Conf. Vancouver, British Columbia, Canada, Aug. 2008. pp. 3103-3106.
[10] G. Gusmao, Saulo C. S. Machado, Marco A. B. Rodrigues, “A new Algorithm for Segmenting and Counting Aedes Aegypti Eggs in Ovitraps,” 31st Annual
International Conference IEEE EMBS Minneapolis, Minnesota, USA, Sep. 2009 pp.6714-6717.
[11] Y. H. Toh, T.M. Ng, B.K. Liew, “Automated Fish Counting using Image Processing,” International Conference on Computational Intelligence and Software
Engineering, CiSE, Dec. 2009. pp. 1-5
[12] Yan Wenzhong, “A Counting Algorithm for Overlapped chromosomes,” The 2nd International Conference on Bioinformatics and Biomedical Engineering,
June 2009 pp. 1-3.
[13] Chomtip Pornpanomchai, Fuangchat Stheitsthienchai Sorawat Rattanachuen, “Object Detection and Counting System”, 2008 Congress on Image and Signal
Processing, May 2008. pp. 61-65.
[14] Qingmin LIAO, Kacem CHEHDI , Xinggang LIN, Yujin ZHANG, “Identification of Pelagic Eggs by Image Analysis,” 3rd International Conference on