Analyzing Entity Framework Technology for an Indoor
Decoration Based Recommendation System
Fidan Kaya Gülağız
*, Uğur Başaran, Adnan Kavak
Kocaeli University, Kocaeli, Turkey.* Corresponding author. Tel.: +902623033592; email: [email protected] Manuscript submitted July 11, 2015; accepted October 30, 2015.
doi: 10.17706/jcp.11.4.320-328
Abstract: In this study, performance analysis of a suggestion system already developed was performed by using two different technologies. The system developed consists of two parts, including web and mobile. Mobile application part of the system receives from the users a range of information about decoration environment via image processing algorithms while web part of the system brings suggestions forward to the users by using collaborative filtering algorithms. Web and mobile application parts work concurrently in an integrated manner. The purpose of the system is to provide the user with the most appropriate result as soon as possible. Database operations are therefore required to be minimized. The system developed under the scope of this study was tested individually using conventional SQL queries and Entity Framework technology and both accuracy and performance analysis of the system was conducted.
Key words: Collaborative filtering, entity framework, recommendation system.
1.
Introduction
Mobile applications have become a new way for the companies to reach the customers as a result of the rapid adaptation of people with the smart devices nowadays. Media independent, fast and person- based applications can be designed with the mobile application feature provided by smart devices. It was observed from the studies that there are a limited number of applications for furniture and decoration sector [1]. Accordingly, a system consisting of mobile and web application parts was developed for furniture and decoration sector which have an important place in Turkey.
There are two fundamental components of the system. These are; the mobile application part running image processing algorithms in the background where Users' requests and photos of the environment to be decorated will be uploaded, and the web application part running the collaborative filtering algorithm according to the results received from the mobile application and to the user data registered in the system. Data used in the mobile application part are not huge data both in terms of content and size; however a huge amount of data is used in the web application part for filtering operation. Database operations are therefore required to be minimized in order to be able to improve the functionality of the system. In this study, the new Entity Framework technology was integrated into the developed system and performance of the system was tested in particular against database access and database queries.
2.
Literature Review
There are many applications developed as mobile-based. These applications make user’s lives easier in different aspects. Butler demonstrated the place of mobile applications in our lives with a research he conducted [2]. Furthermore, many different mobile application development platforms are also available. Various mobile application platforms are also investigated with regards to both users and application developers in the study carried out by Damianos [3].
Numerous data mining based personal suggestion systems developed as web and mobile based are available at the present time. When we examined these systems, it is seen that systems those using Collaborative filtering methods make suggestions generally by using the similarities between users [4], [5]. The user-based collaborative filtering method that we also used in this study was first used in Grouplens projects. Here, the Usenet newsgroups were used as data set and it makes personal suggestions for the users by using the collaborative filtering method. Researchers have further focused on the collaborative filtering techniques through these studies conducted by Grouplens [6]. Similarity calculation methods, which is an important step of the collaborative filtering methods, were tested by Herlocker et al. [7] and, it was specified which similarity calculation method more appropriate in which situations. A new method was proposed by Goldberg at al in order to shorten the processing time of the collaborative filtering method [8]. The collaborative filtering method is commonly used also in web and mobile based systems. Among these: Amazon [9], Digg [10], Netflix [11], Last Fm and Ebay [12]. It is clearly seen from the analysis of the studies conducted before that the collaborative filtering method is suitable for the system developed.
The filtering process constitutes an important part of the developed system. Other than the filtering process, color analysis algorithms are also used for the analysis of the environment. Scalar quantization method [13] and median cut method [14] are widely used in literature for color analysis operations. The basic objective of these methods is reducing the color tones in picture to a limited number [15]. In a study made by Braquelaire and Brun, the common ones among the color analysis methods were compared with each other.
Many different techniques are used in stage of data storage and data access. Systems developed by using Ado.Net or Entity Framework technologies can also be given as examples of these systems. The Entity Framework technology was used in the system developed by Xie et al. [16] in order to store and display data and a significant reduction was observed in energy consumption of the system. Also in the study conducted by Zhongming et al. [17], the Entity Framework was used for data management.
Filtering process was realized by using collaborative filtering algorithm in the system developed. In color analysis stage, performance of various color analysis methods was compared with the studies made previously and the scalar quantization method was identified as the most appropriate method [18].
3.
Proposed System Architecture
Color analysis is also carried out for the environment to be decorated and uploaded to the system by the user at the suggestion stage, by using image processing algorithms. Median cut and scalar quantization algorithms were used at color analysis stage. Products containing the most intense tones found by the color analysis are introduced to the user by also taking into account the results of filtering algorithm. Votes given previously by the users for the products available in the system have the most significant effect in this process. These votes consist of a huge data set.
The system can be divided in three parts. These are; collection of data and management of data, performance of color analysis and application of the Collaborative Filtering algorithm. Detailed descriptions of these stages are given in the following sections.
Fig. 1. Architecture of the dekorasist system [18].
3.1.
Collection and Management of Data
Movilens data set in a size of 100K which was generated under the scope of GroupLens research projects [19] was used during the development of the system. There are 1000 votes of 1000 users pertaining to 1700 data in the data set. In the previous studies [18], the SQL Server which is a relational database management system was used during storage of data. ADO.NET technology was used at the stage of data access. In this way, application codes and database operations were performed separately from one another. However, operations performed on the data take a longer time as the data set is increased. In this study, among the popular technologies, ADO.Net and Entity Framework technologies were therefore analyzed with respect to accuracy and performance.
the application and database. It generates for each object in the database their corresponding values in the application and, in a similar way, for each object in the application their corresponding values in the database. Entity Framework is also an ORM tool of Microsoft, provided together with DotNet 4.0. A study was performed on a flexible structure with no database dependency by using Entity Framework.
The system was implemented by using either technology and analyses were performed. Performance results will be described in detail in Section 4.
3.2.
Color Analysis Operations
Three different methods were tested in order to be able to select the most appropriate method at color analysis stage. These methods can be listed as: median-cut algorithm, scalar quantization and octree quantization algorithm. Analysis of color intensity of pictures of various environments was performed by using these methods. Results including comparison of the methods with respect to mean square error (MSE), execution time and memory usage were obtained in previous studies and also given in Table 1. Comparison of color analysis algorithms was carried out for a picture in jpg format including a total of 41,108 colors, with a width value of 23 and height value of 172.
Table 1. Comparison of Color Quantization Methods [18] MSE Time (ms.) Memory Usage (MB) Scalar Quantization 33,515.14 2625 1607
Octree Quantization 6,676.47 11,347 21,120 Median-Cut Quantization 11,825.23 5786 30,118
According to the results given in the table, Median Cut and Octree algorithms yielded more accurate results in terms of content of picture; however, the scalar quantization algorithm resulted in a better performance with respect to time and memory usage. The scalar quantization algorithm [18], [20] was used in color analysis operations since it is important to obtain intense colors in the application and the scalar quantization algorithm is more advantageous than the other algorithms in terms of both memory and speed.
Following the scalar quantization algorithm was applied both on the background uploaded to the system by the user and on the products available in the database, the Linear Matching Algorithm was used in order to be able to find the products which are the most similar with each other in terms of color tone. A pseudo code [20] is given below in relation to the Linear Matching Algorithm.
for k=1: N; if Dk,w<Dm
Pk= C - Cm k,w
end end
Popt = min
PkThe Cm value in the code represents the results of picture analysis made with respect to the environment
to be decorated. The Dm value indicates the dimensions of the environment to be decorated. The Dk,w value
gives the dimension information of the kth product available in the database, which will be put forward as a suggestion and the Ck,w value represents the results of color analysis made with respect to this product. Popt
assuming a total of T products are present in the database, the products having the highest similarity with respect to color will be filtered as a result of the Linear Matching algorithm and the number of products that have been filtered will be L (T>L). In the next stage, the collaborative filtering algorithm was applied on these L products.
3.3.
Collaborative Filtering Algorithm
First, all users found in the database are specified as neighbors in the Collaborative Filtering algorithm. Then, similarities between these users are calculated. Both the Pearson's Similarity correlation [18] given in (1) and the vector similarity correlation [18] given in (2) were used in order to calculate the similarities.
1 2 2 1 1
(
)(
)
( , )
(
)
(
)
n i i iPB n n
i i
i i
x
x y
y
x y
x
x
y
y
(1)In (1), If it is considered that the similarity between the users x and y is calculated; xi: the score given to
the object i by the user x, yi: the score given to the object i by the user y, n: number of objects voted jointly
by the users x and y and x, y: mean score value of the objects voted by the users x and y, respectively. 2 2 y
xi i
ρVB( ) = i
2
2 y
x i I
i Ix i y i
x.y x, y
x
y
(2)
xi and yi values given in (2) represent the votes given by the users for the object i. Vector similarity is
widely used in Object-Based Filtering techniques. Following a literature review, it is observed that it gives better results in Object-Based Filtering techniques.
After the similarities between the users were calculated, 50 users which have the highest similarity value among the users present in the database were chosen as neighbors. It is stated in the literature that sufficient number of users should be at least 20 for the Collaborative Filtering Algorithm Systems [7]. Therefore, neighbors in a number of at least 20 are specified for those users having neighbors less than 50 users. Only the Linear Matching Algorithm is applied for the users having neighbors less than 20. Results are evaluated by using the K-NN [18] Algorithm and Correlation Threshold Methods [18] in neighbor selection. Then, by taking into account other requirements of the users in regards to their neighbors and the product, the score value pertaining to L products obtained from the Linear Matching Algorithm is calculated by using the below equation.
(b - b)* ρ(a,b) (b N) (b_oylar_j) j
P(a, j) = a + ...
ρ(a,b)
(b N) (b_oylar_j) (3)
Estimated value of the score given by the user for the product j is calculated in (3).
a
represents the mean value of the votes given by the user a. bj shows the real value of the vote given by the user a for theelement j of the user b, which is one of the neighbors of the user a, while
b
gives the mean value of the votes of the user b. After the estimated score of L products is calculated by using the above formula, M products with the highest score which are considered as appealing for the user are presented as a suggestion.method and the Correlation Threshold method, respectively and, the Pearson’s Similarity Method yielded much better results than the Vector Similarity Method. Although processing times of the K-NN method and the Correlation Threshold method were similar, the K-NN algorithm delivered more accurate results by an increase of the threshold value in the Correlation Threshold Method, which means an increase of similarity resulting in an insufficient number of neighbors [18].
For reasons outlined above, Pearson Similarity method was used during the similarity calculations of the users whereas K-NN method was utilized during calculation of the estimated values of the scores given by the users for the products at the stage of comparison of the system in terms of database operations. Evaluation of ADO.NET and Entity Framework technologies, which are used at the stage of data access, will be made in Section 4.
4.
Proposed System Architecture
Test operations were performed via the Movilens data set consisting of 100 thousand data. Data found in the data set were broken into two parts in such a way that 80% of them are education data and 20% test data. In addition, this break-up was performed in 5 different ways and the methods were also tested on these five different data set. Error calculation with respect to the similarities between the users and to the real similarity values were carried out by using the Mean Absolute Error (MAE) method.
ˆ
ˆ n x - xi i
MAE(x, x) = i=1 n (4)
MAE is one of the most widely used methods in determining the accuracy of the estimates [14]. MAE method produces more accurate results in comparison to the other evaluation criteria proposed for the Collaborative Filtering Method and is an easy-to-calculate method. MAE method finds the absolute error for N products at first and, then, takes the mean value of this error value. Calculation of the MAE Method is shown in (4).
Table 2. Results Obtained with ADO.NET by Using K-NN and Pearson Similarity Number of Neighbors MAE
5 0,805339021206558 25 0,758978653250448 50 0,758304950282027 75 0,759425663426021 100 0,764395969153255 125 0,766331286077132 150 0,767673955190167 175 0,768744300159501 200 0,769924510354867
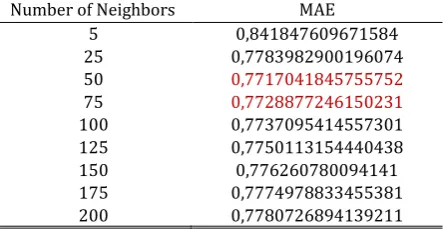
Table 3. Results Obtained with Entity Framework by Using K-NN and Pearson Similarity Number of Neighbors MAE
When Table 2 and Table 3 are analyzed, it is seen that error values calculated by using Ado.Net and Entity Framework technologies as a function of number of users are very close to each other. This shows that the system gives similar results under different technologies. It means our system is a consistent system. However, purpose of the study is twofold: to test the accuracy of the system and to compare system performance in terms of two different technologies. Therefore, we should compare the technologies used with respect to total processing time.
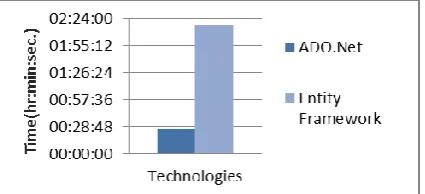
Calculation times of the Pearson’s Similarity by using two different technologies are given in Fig. 2. As can be seen from Fig. 2, total similarity calculation time by using the Entity Framework technology is approximately four times the total calculation time by using the ADO.Net technology.
Calculation of estimated values of the votes given by the user for the products, by choosing 50 neighbors with K-NN algorithm with using two different technologies, is given in Fig. 3. Processing times are given in the graph. As can be seen from the graph, total processing time by using the Entity Framework technology is approximately five times the total calculation time by using the ADO.Net technology. If it is considered that number of users and, accordingly, number of votes will be increased over time, the Entity Framework technology system will slow down the system severely.
Fig. 2. Processing time of Pearson Similarity.
Fig. 3. Processing time of K-NN algorithm.
5.
Conclusion
In this study, two different technologies, which are ADO.Net and Entity Framework technologies, were tested on the Collaborative Filtering method which is a data mining method. Both technologies have similar accuracy rates while ADO.Net technology conducted all processes in a time period about 5 times less than the Entity Framework technology. Consequently, the Entity Framework technology is not as fast as the ADO.Net technology. However, the Entity Framework technology has no database dependency and provides a flexible architecture; on the other hand, it has an object dependency since the objects on the application side and the objects in the database are MAPPED with each other.
An addition, it generates all SQL statements itself. This imposes restrictions at the SQL side.
in huge amounts. Therefore, it is understood that the ADO.Net technology is more appropriate for data mining and Filtering applications in comparison to the Entity Framework technology.
References
[1] Ministry of Industry and Trade (Republic of Turkey). (2010). Furniture Industry Report. Industry
Directorate-General. Retrieved June 11, 2015, from
http://www.sanayi.gov.tr/Files/Documents/mobilya_sektoru_raporu_oc-14022011110007.pdf [2] Butler, M. (2010). Android changing the mobile landscape. Journal of IEEE Pervasive Computing, 10(1),
4-7.
[3] Damianos, G. (2010). Development platforms for mobile applications: Status and trends. IEEE Software, 28(1), 77–86.
[4] Rafter, R. (2010). Evaluation and Conversation in Collaborative Filtering. Published PhD dissertation, University College Dublin, Dublin, Ireland.
[5] Goldberg, D., Nichols, D. M., Oki, B., & Terry, D. (1992). Using collaborative filtering to weave an information tapestry. Proceedings of the 1992 Communications of the ACM (pp. 61-70).
[6] Resnick, P., Lacovou, N., Suchak, M., Bergstrom, P., & Riedl J. (1994). GroupLens: An open architecture for collaborative filtering of netnews. Proceedings of the 1994 ACM Conference on Computer-Supported Cooperative Work (pp. 175-186).
[7] Herlocker, L. J., Konstan, J. A., Borchers, A., & Riedl, J. (1999). An algorithmic framework for performing collaborative filtering. Proceedings of the 22nd Annual International ACM SIGIR Conference (pp. 230-237).
[8] Goldberg, K., Roeder, T., Grupta, D., & Perkins, C. (2001). Eigenstate: A constant time collaborative filtering algorithm. Journal of Information Retrieval, 4(2), 133–151.
[9] Linden, G., Smith, B., & York, J. (2003). Amazon.com recommendations: item-to-item collaborative filtering. Journal of IEEE Internet Computing, 7(1), 76–80.
[10]McGinty, L., & Smyth, B. (2002). Comparison-based recommendation. Lecture Notes in Computer Science, 2416, 575–589.
[11]Bell, R. M., Koren, Y., & Volinsky, C. (2008). The BellKor Solution to the Netflix Prize, AT&T Labs. [12]Rafter, R., & Smyth, B. (2001). Towards a domain analysis methodology for collaborative filtering.
Proceedings of the ECIR 01 (pp. 1-14).
[13]Baolong, G., & Xiang, F. (2006). A modified octree color quantization algorithm. Proceedings of the First International Conference on Communications and Networking (pp. 1-3).
[14]Chen, W., & Ding, W. (2008). An improved median cut algorithm of color image quantization.
Proceedings of the International Conference on Computer Science and Software Engineering (pp.
943-946).
[15]Orchard, M. T., & Bouman, C. A. (1991). Color quantization of images. Journal of IEEE Transactions on
Signal Processing, 39(12), 2677-2690.
[16]Xie, Z., He, H., Li, Y., & Jia, J. (2014). Design and application of lighting energy consumption monitoring platform based on MVC and entity framework. Proceedings of the ICIA (pp. 473-477).
[17]Romksaiyud, W. (2014). Applying MVC data model on hadoop for delivering the business intelligence. Proceedings of the ICT (pp. 78-82).
[18]Kaya, F., Yıldız, G., & Kavak, A. (2015). A mobile and web application based recommendation system using color quantization and collaborative filtering. Turkish Journal of Electrical Engineering and Computer Science, 23(3), 900-912.
of the Sixth ACM Conference on Recommender Systems (pp. 99-106).
[20]Kaya, F., Yıldız, G., & Kavak, A. (2012). Evaluation of collaborative filtering techniques for mobile and web application based recommendation. Proceedings of the 9th International Conference on Electronics, Computer and Computation (pp. 314-317).
Fidan Kaya Gülağız received B.E. degree in computer engineering from Kocaeli University, Kocaeli, Turkey in 2010. And she received the M.E. degree in computer engineering from Kocaeli University, Kocaeli, Turkey in 2012. She is currently pursuing the Ph.D. degree in computer engineering from Kocaeli University. His research interests include filtering methods, data mining applications and cloud computing.
Uğur Başaran received B.E. degree in computer engineering from Kocaeli University, Kocaeli, Turkey in 2013. He is currently working at Onay Bilişim company as a computer engineer.
![Fig. 1. Architecture of the dekorasist system [18].](https://thumb-us.123doks.com/thumbv2/123dok_us/7813024.1663280/3.595.196.399.220.500/fig-architecture-of-the-dekorasist-system.webp)
![Table 1. Comparison of Color Quantization Methods [18]](https://thumb-us.123doks.com/thumbv2/123dok_us/7813024.1663280/4.595.140.455.325.376/table-comparison-color-quantization-methods.webp)