Abstract—Very little empirical work has been done to
measure brand defection as one dimension of consumer-based brand equity. The purpose of the present research is to investigate and build the new model of consumer-based brand equity by exploring the knowledge of brand defection. The empirical survey was conducted using online closed-ended questionnaire which was sent to a sample of 350 users of social networks. Out of these we received 301 usable responses from mainland China. The main issues covered in the questionnaire are primarily related to consumer attitude toward seven telecom brands in the mainland Chinese market. These brands were: China Telecom, China Mobile, China Unicom, Nokia, Motorola, Huawei, and ZTE. Our findings concluded that brand defection has negative effect on brand equity; brand awareness has positive effect on brand defection; both brand loyalty and perceived quality have the negative effect on brand defection. The result also showed that Chinese consumers demonstrated a strong affinity toward the following brands (in order of priority): China Mobile, Nokia, Motorola, Unicom, China Telecom, Huawei, ZTE. On the other hand, consumers demonstrated a strong willing of defection toward the following brands (in order of priority): China Telecom, Huawei, ZTE, Motorola, Unicom, China Mobile, Nokia. In the end, we discussed both theoretical and practical implication.
I. INTRODUCTION
Consumer-based brand equity (CBBE) is an essential way to occupy the market and make more profit for companies. The procedure of building CBBE is to create the equity for the whole company, and many empirical studies have been done according to the CBBE models. On the contrary, brand defection is the way that decreases brand equity. From consumer perspective, analysis of brand defection could deeply understand the composition of CBBE, also could help better building CBBE models. However, recent studies have not considered brand defection as one dimension to measure CBBE. The main trend of researches related to brand defection is often theoretical orientated and very little empirical research has been done.
The purpose of this study is to investigate and build the new model of brand defection influenced CBBE. We developed the CBBE model which was borrowed from Asker
Manuscript received February 15, 2013; revised April 20, 2013. Mingyue Qi is with the Institut Mines-Telecom/Telecom Ecole de Management, 9 rue Charles Fourier, 91011 Evry, France (E-mail: [email protected]).
Guoqin Zhao is with Institute of Finance and Economics, Centre University of Finance and Economics, No. 39 South road of academy,
[1] and Keller [2]. Meanwhile we designed the brand defection scale based on the theory of Svetlana [3], who suggested the reasons of brand defection. In our study, brand defection from consumer perspective is the defection of consumer’s psychological activity, and the defection begins with the defected willingness of consumer. Each dimension of the model represented the measurement of the overall brand equity. We aim to know the relevance of the dimensions and also the items (observation variable) according to each dimension (latent variable). By analyzing the correlation of the dimensions, the affect factors for creating CBBE were listed. We concluded that brand defection has negative effect on brand equity. Brand awareness has positive effect on brand defection. Both brand loyalty and perceived quality have the negative effect on brand defection.
In this paper, we selected seven brands from Chinese telecom market. There are three kinds of telecom companies: the state-owned companies, the foreign companies and the local private enterprise. For the state-owned companies, we chose China Telecom, China Mobile, and Unicom. For the foreign companies, we chose Nokia and Motorola. For the local private enterprises, we chose ZTE and Huawei. Our study focused on the corporate brand, which is the name of the company. The experiment was carried on a data set which was gathered from two social networks in China (http://bbs.pinggu.org/and http://www.sojump.com/). Our findings showed that Chinese consumers demonstrated a strong affinity toward the following brands (in order of priority): China Mobile, Nokia, Motorola, Unicom, China Telecom, Huawei, and ZTE. Moreover, consumers demonstrated a strong willing of defection toward the following brands (in order of priority): China Telecom, Huawei, ZTE, Motorola, Unicom, China Mobile, and Nokia. In the following parts, we first build the theoretical model and put forward research hypotheses. Next we discuss our methodology of item generation and purification, brand stimuli, data collection and data analysis. Then, we assess the construct reliability and validity of the overall scale. After building the structural equation model and discussing the relevance of each dimension, we finally discuss the implication in both theoretical and practical way.
II. REVIEW OF THE LITERATURE
A. Consumer-Based Brand Equity
Keller [4] identified brand equity from a consumer point of view; he believed that brand equity is a reaction when consumers show their attitude according to the product or services provided by company. CBBE becomes the main trend in research of brand equity both in the practical field
An Empirical Study of Brand Defection Influenced
Consumer-Based Brand Equity
Mingyue Qi, Guoqin Zhao, and Shengliang Zong
Index Terms—Brand defection, consumer-based brand
equity, telecom brand.
and the academic field. Many scholars found that consumers play an important role in brand strategy. They analyze CBBE by identifying variable dimensions, which compose the brand equity model.
According to scholars, the main effective dimensions for measuring CBBE are: brand awareness, brand association, perceived quality, and brand loyalty [1], [2], [5]. Literature reviews of CBBE demonstrate that these basis four conceptual hypotheses which constitute the basis for measuring CBBE, these hypotheses are as follows:
PH1: Brand awareness has significant positive direct effect on brand equity.
PH2: Brand association has significant positive direct effect on brand equity.
PH3: Brand loyalty has significant positive direct effect on brand equity.
PH4: Perceived quality has significant positive direct effect on brand equity.
Previous studies have already empirically supported the above hypotheses in varies product categories or industries. We continue testing the hypotheses in our new model.
B. Brand Defection
From CBBE aspect, brand defection is consumer defection, which means that consumer process the willingness to switch brand to another, brand defection begins with the change of consumer’s attitude. The key rationale for this views the belief that if brand management focuses on regaining lapsed customers, rather than attracting new ones, the return on investment will be higher[3]. To assess the potential win back of lapsed customers is to examine their thoughts and feelings with regard to their former brand. Such cognitive information about a brand is an aspect of customer brand equity [2], [6].In our research, brand defection is the willingness of consumer who defect the brand.
There are three reasons of brand defection [3]: firstly, push away or expectation disconfirmation. The defection happens when consumers feel unsatisfied with the brand. Secondly, pull away or utility maximization. It happens when consumers are attracted by the promotion from other competitors. Thirdly, move away or beyond the central of brand management. It happens during the change of consumer’s life style. These three reasons help us to design the items on how to measure brand defection.
Little empirical research has been done to solve the issue between brand equity and brand defection. Brand defection is a key factor to build consumer-based brand equity, if we know the relevance between brand defection and the dimensions of CBBE model. We could build CBBE through preventing or reducing brand defection.
III. CONCEPTUAL FRAMEWORK OF ANALYSIS
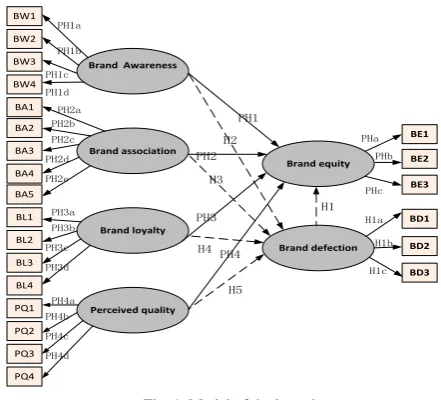
A. Model of the Hypotheses
Our model of hypotheses was composed by two elements, one is the previous hypotheses that identified in many previous studies, and the other is the hypotheses of our research. As shown in Fig.1, there are 5 dimensions to measure CBBE. We would test the relevance of these dimensions with brand defection. Take PH1a, PH1b, PH1c and PH1d for example, they are the hypotheses to test
whether these four items are identified to be useful for the measurement of the brand awareness. For instance, BW1 is the observed variable; brand awareness is the latent variable, and so on.
Perceived quality Brand Awareness
Brand association
Brand loyalty
Brand defection
BW2 BW3 BW4
BA4 BA5
BL4 BL3 BL2 BL1
PQ4 PQ3 PQ2 PQ1 BW1
BA3 BA2
BD1 BD2 BD3
BA1
PH1
PH2
PH3
PH4
H1
PH1a PH1b PH1c PH1d PH2a PH2b PH2c PH2d PH2e
PH3a PH3b PH3c PH3d
PH4a PH4b PH4c PH4d
H1a H1b H1c
Brand equity
BE1 BE2 BE3
PHa PHb
PHc
H2
H3
H4
H5
Fig. 1. Model of the hypotheses.
B. Hypotheses
Brand defection is the results of consumer’s negative attitude towards brand, while the brand equity is the consumer's positive attitude towards brand. Brand equity increases with lower brand defection. Based on the above discussion, we formulated the following hypothesis:
H1: Brand defection has a significant negative direct effect on brand equity.
Brand awareness is the ability of a buyer to recognize a brand as a member of a certain product category. [7], [8]. Consumer always intends to purchase the products or services with the brand they know, which in their memory. It will hardly cause defection if consumers are quite familiar with the brand. Thus the following hypothesis is formulated: H2: Brand awareness has a significant negative direct effect on brand defection.
Brand association is the thing which is special linked in memory of consumer to a brand. [4]. It creates brand equity by helping to process information, differentiate the brand, create positive attitudes, provide reasons for consumers to buy, and provide a basis for extensions [7]. It will prevent the consumer from changing the brand. So we would also have the following hypothesis:
H3: Brand association has a significant negative direct effect on brand defection.
Brand loyalty is considered as a behavior whereby the individual who buys the same brand consistently [8]. According to Assael [9], brand loyalty is a favorable attitude towards a brand. So this is more about an attitudes rather than a behavior. This attitude could decrease the brand defection. So the following hypothesis would be formulated:
H4: Brand loyalty has a significant negative direct effect on brand defection.
follows:
H5: Perceived quality has a significant negative direct effect on brand defection.
IV. METHODOLOGY
A. Item Generation and Purification
In the pretest, after the literature review and 21 on line interviews, 48 items were selected from 65 collections. For each item we asked about the consumer’s attitude.
Based on the result of our pretest, we designed four items to measure brand awareness, five items to measure brand association, four items to measure brand loyalty, four items to measure perceived quality, three items to measure brand defection, and three items to measure brand equity.
B. Brand Stimuli
Seven telecom company brands were selected by meeting the following requirements: early market entry, providing both telecommunication services and products. First group contained China Telecom, China Mobile, and Unicom. These three companies were dominated companies, and they take responsible for the main telecom services and products in China. The second group contained Nokia and Motorola. They are the foreign telecom companies and entered the market early with influential reputation. The third group contained Huawei and ZTE. These two brands are the private telecom brands with high speed development. According to the classification of brand content which includes corporate brand, consumer brand, business brand and service brand [13], we focused on the corporate brand from consumer’s point of view. Our objective is to analyze the corporate brand equity among the seven telecom companies.
C. Sample and Data Collection
We used the online survey instrument, then we distributed the survey (conducted both Chinese version and English one) on two social networks in China: http://bbs.pinggu.org/ and http://www.sojump.com/. In the end, we received 301 valid answers from different regions of China. About 72% answers were from the developed cities, such as Beijing, Shanghai, while about 28% answers were from the undeveloped cities. The gender ratio of respondents was 67% male and 33% female. Participants gave the score to all items on 5-point Likert scale, in which from 1 to 5 present “strongly disagree” to “strongly agree”.
D. Data Analysis
We used the factor analysis and structural equation model to test the reliability, validity and the goodness-of -fit indices of the model, which could be used to measure the brand equity in telecom market. And the details are as follows.
We conducted the research into four steps by using SPSS21.0 and AMOS21.0. The first step was the item analysis. In this step, we attempted to find and delete the item which was not achieving the significance level. We adopted CR (critical ratio) to evaluate and select items. The second step was the factor or validity analysis. The KMO [14] was used to test the validity of the scale. According to Kaiser, the KMO should be greater than 0.5, which could confirm a good validity. The third step was the reliability analysis. This step
V. RESULT
A. Construct Reliability and Validity
TABLEI:SELECTED ITEMS AND THE RELIABILITY AND VALIDITY
Variables and items Standard factor loading
T-value
Brand awareness (α=0.78)
BW1: I can recognize X among other brands.
0.611 10.769
BW3: I know what X’s brand image looks like.
0.683 16.032
Brand association (α=0.809)
BA1: I can recall image and logo of X quickly.
0.587 10.385
BA3: X is familiar to me 0.730 17.054 BA4: I can tell the different functions of X
easily.
0.713 15.609
Brand loyalty (α=0.863)
BL1: I will continue use X 0.782 18.677 BL3: I will recommend X to my friends 0.829 24.657 BL4: I used to use X 0.783 23.214
Perceive quality (α=0.860)
PQ2: The money I spent on X is very worth cost
0.723 13.426
PQ3: X is the best brand in this industry 0.823 22.020 PQ4: The technological quality of X is
high.
0.791 18.594
Brand defection (α=0.710)
BD1: I feel unsatisfied about X; I will change to another brand
0.632 0.518
BD2: I am attracted by other brand, I will give up X
0.547 2.707
BD3: If I change my neighborhood, I will not use X anymore
0.653 1.417
Brand equity (α=0.916)
BE1: Comparing with other brand, even they possess the same functions, I prefer X
0.839 23.935
BE2: Comparing with other brand, even they possess the same feature, I prefer X.
0.839 23.282
BE3: Comparing with other brand, even there is no difference between them, I think X is a wise choice
0.793 19.910
First we used CR value to evaluate the items, and BW2, BA2 were deleted because they were with unexpected CR value. And in the correlation part the BA5, BW3 and BL2 were not correlated with the groups. In the factor analysis, PQ1, BA2 had a low communality which were lower than 0.5. After the item purification, the reliability and validity were tested again. The α of the total scale was 0.893, as well as the internal dimensions, all of them were accepted with α>0.7, which showed the reliability of the scale was quite satisfied. was to test the reliability and validity of the multi-item scale. With this step, we could see the internal consistency of a psychometric test score for a sample of examinees. The Cronbach’s α is a coefficient of reliability [15]. If α>0.7, it means the level of reliability is accepted. The fourth step was to develop the structural model. In this step, we tested the hypotheses of relationships between dimensions and the fitness of the model. The model fit criteria we used is suggested by Hu and Bentler [16]: Chi-square test ( χ2 ), degree of freedom (df), goodness of fit (GFI), adjusted goodness of fit (AGFI), comparative fit index (CFI), root mean square residual (RMR), Normed Fit Index (NFI), Relative fit index (RFI). The acceptable model should posses:
The KMO of the total scale was 0.809, and with the (χ2=1210.516, df =15) significant at 0.000 level. This showed that the scale was reliability and validity. Furthermore, it quite fit to do the factor analysis. Details can be seen in Table I. The reliability and validity of the whole scale as well as each item were satisfied.
B. Correlation and Standard Deviation
We aim to identify the correlation and standard deviation among the dimensions. As shown in Table II.
TABLEII:CORRELATION AND STANDARD DEVIATION
BW BA BL PQ BD BE
BW 1
BA 0.803** 1
BL 0.526** 0.644** 1
PQ 0.544** 0.605** 0.754** 1
BD 0.197** 0.177** -0.059 -0.060 1
BE 0.506** 0.584** 0.802** 0.787** -0.107 1
St.dev 1.279 1.171 1.253 1.079 1.015 1.195
** means the result is significant at the level of 0.01
The correlation between brand awareness and brand defection was 0.197 significant at the level of 0.01; the correlation between brand association and brand defection was 0.177 significant at the level of 0.01. The influence was positive, which was the reverse of brand loyalty, perceive quality and brand equity. The correlation of brand defection with brand equity, brand loyalty and perceive quality were -0.107, -0.059, and -0.06 respectively.
C. Structural Equation Model
After confirmation of the principle analysis, we built our structural equation model by using AMOS 21.0. First we built model based on the hypnoses model and dimensions listed in Table I. We found the Chi-square and degree of freedom were not accepted with the RMR>0.1, GFI<0.9, thus the model was rejected. Then we checked the result of covariance. According to result of M.I, H3 was unsupported. So we rebuilt the model by reducing constrain of brand association. The model was finally accepted with the Chi-square=204.499, Degree of Freedom=68, RMR=0.081, GFI=0.916, AGFI=0.87, NFI=0.93, RFI=0.907, CFI=0.952. As shown in Fig. 2.
The standardized direct effect of brand defection on brand equity was -0.016. That is, due to the direct effect of brand defection on brand equity, when brand defection goes up by 1 standard deviation, brand equity goes down by 0.016 standard deviations. The standardized direct effect of brand awareness on brand defection was 0.229, the standardized direct effect of brand loyalty on brand defection was -0.043, and the standardized direct effect of perceived quality on brand defection was -0.041.
The result of the hypnoses test and the path are shown in the Table III. According to the output of model analysis, H1, H4 and H5 were supported, as to say, brand defection had a significant negative direct effect on brand equity, brand loyalty had a significant negative direct effect on brand defection, and perceived quality had a significant negative direct effect on brand defection. In contrary, H2 was
unsupported, as to say, brand awareness had positive effect on brand defection. Specifically, when brand awareness goes up by 1 standard deviation; brand defection goes up by 0.229 standard deviations.
Perceived Quality Brand Awareness
Brand Loyalty
Brand Defection
BW3
BL4 BL3 BL1
PQ4 PQ3 PQ2 BW1
BD1
BD2
BD3 Brand equity
BE1
BE2
BE3
1.823
-0.016
0.932 0.237 0.894
0.753
0.746 0.759
0.839
0.753
0.877
0.807
0.903
0.898
0.846
0.845
0.681
0.536 0.229
-0.043
-0.041
Chi-square=204.499 Degrees of freedom=68 Probability level=0.000
RMR=0.081, GFI=0.916, AGFI=0.87, NFI=0.930, RFI=0.907, CFI=0.952
Negative effect Positive effect
Fig. 2. Structure model of brand defection influenced CBBE.
TABLEIII:HYPOTHESES TEST
Hypothesis Path S.E. C.R. P Result
H1 BDBE 0.092 -0.209 0.835 Supported H2 BWBD 0.090 3.108 0.002 Unsupported
H3 BABD 0.030 4.555 0.004 Unsupported H4 BL BD 0.082 -0.584 0.559 Supported
H5 PQBD 0.067 -0.590 0.555 Supported
VI. CONCLUSIONS AND DISCUSSION
The goal of this study is to build the brand defection influenced consumer-based brand equity model. On one hand, to examine how brand defection can influence brand equity is the way to reduce defection and create brand equity. On the other hand, from brand equity perspective, through our research we could identify which dimension can lead to brand defection. And hence we can make strategies to prevent it accordingly. The new model has the theoretical and practical implications in several ways.
A. The Theoretical Implication
First, the structural model indicates that brand awareness has positive effect on brand defection, and also it is not significant related with brand equity. This conclusion shows the activities of creating brand awareness may reduce brand equity. For instance, many companies adopted using over advertising strategy that leads to the negative impression from consumers.
Second, both of brand loyalty and perceive quality are negative related to the brand defection. In order to prevent brand defection, these two dimensions should be paid more attention. Brand loyalty and perceived quality are not only the essential way to create brand equity, but also the way to gain consumers back.
B. The Practical Implication
In this work, we selected seven telecom brands in China as our sample to deal with the model. Chinese consumers demonstrated a strong affinity toward the following brands (in order of priority): China Mobile, Nokia, Motorola, Unicom, China Telecom, Huawei, and ZTE. While consumers demonstrated a strong willing of defection toward the following brands (in order of priority): China Telecom, Huawei, ZTE, Motorola, Unicom, China Mobile, and Nokia. First, Unicom and China telecom are the companies run by the government. The services they provided are almost monopoly, but the corporate brand equity from consumer point of view is less than Nokia and Motorola. Moreover, regard of our result, China Telecom has the highest coefficients of brand defection, which means consumer feel quite unsatisfied at the services or products. In the competitive market, the revolution inside is urgent needed.
Second, Nokia keeps a high position of brand equity, just after China Mobile. But the fact is that Nokia was involved in serious business crisis since the wrong technological decision has been made recently. The result shows that even Nokia is not stable as before, this brand is quite trustworthy in Chinese telecom market. The wise choice is to keep active in Chinese telecom market, and it still has the chance to win back the market even it suffered the crisis.
Third, Huawei and ZTE are in the bottom of brand equity; however, these two companies are very competitive not only in China but also in the international market. The CBBE of these two companies are too low, which does not coincide with the fact that they make good revenue. The reason is probably due to that they are focusing on the technological business, and ignore the emotional communication with consumers.
VII. LIMITATIONS AND FUTURE WORK
One limitation of our study is that we only collected data from Chinese telecom market, and our model may not be applicable for the other markets or industries. One of our potential future directions is to collect data from various industries and countries to validate our proposed model.
Another limitation is that the instrument we used to collect data was the online survey tool. It might suffer from some problems, such as we cannot collect information about consumers who did not complete the questionnaire. Moreover, the consumers who have the strong attitude towards some brands usually are eager to complain or to praise it, which may bias the results. One possible solution is that we could collect some questionnaires face to face.
REFERENCES
[1] D. Aaker, “Measuring brand equity across products and markets,”
California Management Review, vol. 38, pp. 102-120, 1996.
[2] K. L. Keller, “Brand synthesis: the multi-dimensionality of brand knowledge,” Journal of Consumer Research, vol. 29, pp. 595-600, March 2003.
[3] B. Svetlana, “Life after death? Analyzing post-defection consumer brand equity,” Journal of Business Research, vol. 63, pp. 1135-1141, November 2010.
[4] K. L. Keller, “Conceptualizing, measuring, and managing customer-based brand equity,” Journal of Marketing, vol. 57, no. 1, pp. 1-22. 1993.
[5] L. K. Keller, “Building consumer-based brand equity: a blueprint for creating strong brands,” Marketing Management, pp.15-19, July2001. [6] K. L. Keller and William Hedgcock, “Building strong brands: three models for developing and implementing brand plans,” presented at the
Institute for Research in Marketing, Carlson School of Management,
University of Minnesota, May 19-20, 2006.
[7] D. Aaker, Managing brand equity: capitalizing on the value of a brand name, N. Y: The Free Press, 1991.
[8] K. L. Keller and Don Lehmann, “How Do Brands Create Value?”
Marketing Management, pp. 26-31, May2003.
[9] Aasael (1992), Consumer Behaviour and MarketingAction, 4th edition, Boston, MA:PWS-Kent, pp. 89.
[10] B. Yoo and N. Donthu, “Developing and validating a multidimensional consumer-based brand equity scale,” Journal of Business Research, vol. 52, pp. 1-14, 2001.
[11] Lassar, Mittal and Sharma. “Measure customer-based brand equity,”
The Journal of Consumer Marketing, vol. 12, no. 4, pp. 11-19, 1995.
[12] J. Zhao, “An empirical study on influence of mobile telecommunication service to brand loyalty,” China collective
economy, vol. 15, pp. 75-76, 2008.
[14] H. F. Kaiser, “An index of factorial simplicity,” Psychometrika, vol. 39, pp. 36, March 1974.
[15] L. J. Cronbach, “Coefficient alpha and the internal structure of tests,”
Psychometrika, vol. 16, pp. 298, 1951.
[16] L. Hu and PM Bentler, “Cutoff criteria for fit indexes in covariance structure analysis: Coventional criteria versus new alternatives,”
Structural Equation Modeling, vol. 6, pp. 1-55, 1999.
[13] Zh.- H.Weng, “Brand development strategy of China mobile after the reorganization,” Dissertation of Beijing University of Posts and
Telecommunications.
Mingyue Qiwas born in China on 5thJune 1986. From
Sept. 2010 until now, she is a PhD. Candidate in Institut Mines-TELECOM Ecole de Management, Paris. France. From Sept. 2003 to June 2010 she achieved Bachelor degree and Master degree in business administration College in Lanzhou University, China. From Sept. 2004 to Sept. 2005: she was an exchange student in Yeungnam University, South Korea. Ming Yue is focusing on the research field of management, marketing and strategy, with experience of attending international conference and giving presentations. She has several publications
MS. QI is supported by The China Scholarship Council for the research in France.
Guoqin Zhao was born in China on 1stJuly 1984. From
2012 until now: work as an associate research in Centre University of Finance and Economics (China), meanwhile, entered the post-doctor station of systematical science in Beijing Normal University. From Sept. 2008-Jan.2012: achieved doctor degree from Beijing Normal University. From Sept. 2010-Sept.2011: work as a Research Fellow in Institut Mines-TELECOM Ecole de Management, Paris. France.
Guo Qin is focusing on the research field of public administration, management and strategy. With several papers published on related journal and conference.
Dr Zhao is also a member of Chinese Public Administration Association, and he acquired two research funds from Chinese Philosophy and Social Science Planning Office and Chinese Post-doctor Commit separately.
Shengliang Zongwas born in China on 10thJuly.1982.
From Sept. 2010 until now, he is a PhD. Candidate in Lanzhou University, China. From Sept. 2003 to June 2010 achieved Bachelor degree and Master degree in business administration college in Lanzhou University, China.
Sheng Liang is focusing on the research field of systems engineering management, supply chain management, with several papers published.