Global Journal of Advanced Engineering Technologies and Sciences
OPTIMIZATION
OF
PIPE
SPECIFICATION
FOR
WELDING
IN
B
WAVE
STRUCTURE
USING
TAGUCHI
PARAMETRIC
OPTIMIZATION
TECHNIQUE
Ashish Yadav
1, Ashutosh Palkhe
21,
Assistant Professor M.P.C.T.,Gwalior
2,Students, M.P.C.T.,Gwalior.
ABSTRACT
This work is a step to find out best optimized parameter of a frame taking material of pipe, pipe diameter and the thickness of pipe as prime parameter. .This stress analysis we have accomplished with the help of ANSYS software and Taguchi methodology. The objective of this project is to design best frame. We did this to avoid any possibilities of failure in the structure and also to provide an enough stronger supporting member to make the frame stronger in term of deformation. After making the frame we analyze it for stress due to inertia load and found the region of maximum stress and its possible value. We did same procedure for nine combinations of material, thickness and diameter according to orthogonal array and observed the induced stress. We predicted that the M3+T3+D3 will give the optimum result of induced stress. We checked the stress for M3+T3+D3 and found
it satisfactory. Finally we derived a mathematical model for induced stress for impact loading with the help of MATLAB software. Result of induced stress both from ANSYS and mathematical model are approximately same.
Keywords: Structure, Yield Stress, Thickness .Diameter, Taguchi, ANSYS, MATLAB
INTRODUCTION
Frame is like a skeleton which gives support to the whole infrastructure of any item Design of frame depends upon load which is to be carry and other requirement of item regarding comfort, ergonomics, strength, utility, transportation and aesthetic of item. . Force considered on the frame always is equal to the rate of change of momentum of the body during the impact. During collision of frame maximum stress induced in chassis is crushing stress .Although shearing and tensile stress will also occur but value which we had calculate is the induced compressive stress during the collision We have taken pipes of different material, thickness and diameter to make frame.
OBJECTIVES
The objectives of paper are as follows:
a) The selection of material for B Waves frame.
b) To construct the appropriate B Waves frame.
c) To determine the maximum stress concentration areas.
METHODOLOGY
This technique is completely based on statistical concepts and. Many renowned firms have achieved great success by applying this method. Taguchi method adopted experimentally to investigate influence of parameters such as material stress, thickness and diameter of pipe on the induced stress in chassis. The Taguchi process helps to select or to determine the optimum combination for material stress, thickness of pipe and diameter of pipe and effect of these parameters on induced compressive stress on chassis during time of collision. Many researchers developed many mathematical models to optimize these parameters to get maximum induced stress in various processes.
PHILOSOPHY OF THE TAGUCHI METHOD
1. Quality of product depends on the process by which it has been produced. One can improve the quality by optimising the parameter affects the process.
2. Best quality can be achieved by minimizing uncontrollable environmental factor which leads to deviation from a target.
In this step, the controllable factors are material (M), thickness of pipe (T) and diameter of pipe (D) which was selected because these are the factors which affect the induced compressive stress. Since these factors are controllable so they are considered as controllable factors in the study? Uncontrollable factor may be the ambiance temperature, Humidity, road quality and human error.
Table 1 Selection op factors
Step–3: Selection of Orthogonal Array
There are 9 basic types of standard Orthogonal Arrays (OA) in the Taguchi parameter design. Selection of arrays depends on the degree of freedom of selected parameter. Degree of freedom of all three parameter is 6 . An L9
Orthogonal Array is selected from Appendix B, 2nd edition, 2005, Taguchi Techniques for Quality Engineering,
Philip J Ross, Tata McGraw-Hill Publishing Company limited, for this work. An L9Orthogonal Array is selected
for this work. The layout of this L9 OA is as mentioned in Table 2.
Table 2: L9 Orthogonal Array
Step–4: Conducting the experiments
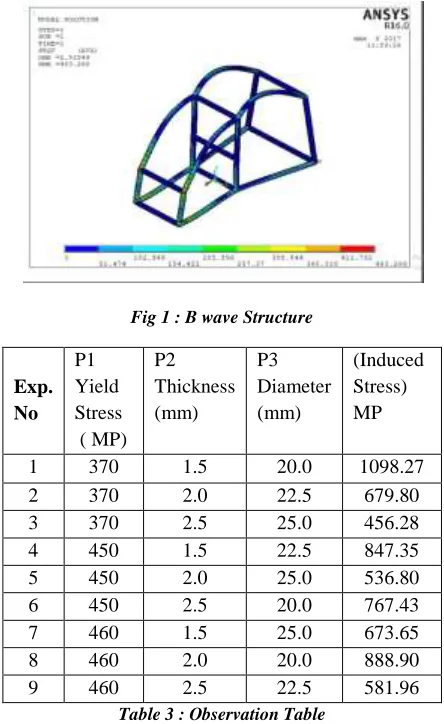
Table 3.1 illustrates the experimental settings in this study for maximum compressive stress. The parameters used in this experiment are material (three different material), thickness of pipe (three different thickness) and the diameter of pipe (three different diameter). All nine analysis have been conducted on ANSYS software result of which have been observed.
Experiment P1 P2 P3
1 1 1 1
2 1 2 2
3 1 3 3
4 2 1 2
5 2 2 3
6 2 3 1
7 3 1 3
8 3 2 1
Fig 1 : B wave Structure
Exp. No
P1 Yield Stress ( MP)
P2
Thickness (mm)
P3 Diameter (mm)
(Induced Stress) MP
1 370 1.5 20.0 1098.27
2 370 2.0 22.5 679.80
3 370 2.5 25.0 456.28
4 450 1.5 22.5 847.35
5 450 2.0 25.0 536.80
6 450 2.5 20.0 767.43
7 460 1.5 25.0 673.65
8 460 2.0 20.0 888.90
9 460 2.5 22.5 581.96
Table 3 : Observation Table
Step–5: Predicting Optimum Performance
Using the aforementioned data, one could predict the optimum combination of material, thickness and diameter for maximum compressive stress induced during impact of collision. With this prediction, one could conclude that which combination will creates the better result. A confirmation of the experimental design was necessary in order to verify the optimum variables combination.
Table 4: Optimum parameters
Step-6: Establishing the design by using a confirmation experiment
The confirmation experiment helps to verify our prediction particularly when small fractional factorial experiments are utilized. The purpose of the confirmation experiment in this study was to validate the optimum compressive stress induced during collision
DESIGN
The chassis is designed considering the factors like factor of safety - maximum load carrying capacity, force absorption capacity, required space for accessories and driver and specific dimensions.
The design of chassis is performed by using software’s ANSYS. The load distribution in the chassis should be uniform. The structural design gives the idea about the chassis.
P Controllable
Factors
Breaking Load (N)
L M H
M Material 744.78 717.19 714.83
T Thickness 873.09 701.83 601.89
MODELING
The 3-D modeling of chassis is created by ANSYS:
Analysis
The next stage after design is analysis of chassis under various impact forces and overall dynamic loads applied during race. By performing analysis, the stresses induced in the structure can be determined.
Graph1: Effect of parameters
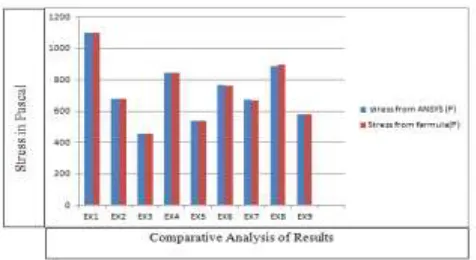
MATHEMATICAL MODELING WITH THE HELP OF MAT LAB
Induced Stress =1047901.342 (Yield Stress) 0.0356 * (Thickness)- 0.7347 * (Diameter) -2.2607
Exp. No
M T
(mm)
D(mm) Induced
stress (MP) Actual
Breaking Load (MP)
From formula
1 370
1.5
20.0 1098.27 1099.34
2 370
2.0
22.5 679.80 681.87
3 370
2.5
25.0 456.28 456.09
4 450 1.5 22.5 847.35 848.24
5 450
2.0
25.0 536.80 541.10
6 450
2.5
20.0 767.43 760.62
7 460 1.5 25.0 673.65 668.98
8 460 2.0 20.0 888.90 896.82
9 460 2.5 22.5 581.96 583.26
Graph 2:Comperision between the induced stress from actual model & Mathematical model
Table 6: Comparisons between previous structure & Modified structure
0 100 200 300 400 500
OLD STRUCTURE
MODIFIDE STRUCTURE
S.N. Particular Previous
Structure
Modified Structure
1 Material HR 7209 AISI 4130
2 Material cost 70 Rs/Kg 55Rs/Kg
3 Yield Stress 415 MP 460 MP
4 Cross Section Square (625
mm2)
Circular (491 mm2)
5 Weight Per
structure
100 kg 78.8 kg
6 Welding Cost
/Unit length
100 Rs 78.5 Rs
7 Stress
Concentration
High Low
8 Failure Rate High Less
9 Welding type Electric Electric
10 Handling Poor good
11 Ergonomic Poor Good
4 By the application of Mathematical regression modeling researcher has find out the empirical formula, which shows the relation between these three factors i.e. yield stress , thickness , diameter . By the use of this formula can be find out the value of stress at the time of impact at any given combination between given range. Formula is
Induced Stress =1047901.342 (Yield Stress) 0.0356 * (Thickness)- 0.7347 * (Diameter) -2.2607
5 Modified Structure is more economic than previous structure
REFERENCES
I. Riley Willam B, and George Albert R. “Design Analysis and testing of a formula SAE Car Chassis”
SAE international technical Paper series ,Volume ,Issue ,Page no ,2002.
II. Rahman Roslan Abd ,Tamin Mohd Nasir and Kurdin Ojo “Stress Analysis of heavy Duty truck
chassis as a preliminary data for its Fatigue life prediction using FEM” journal Mechanical, page No. (76-85), Dec. 2008.
III. Tebby Steven, Esmail zadeh Ebrahim and Barari Ahmad “Methods to determine torsion Stiffness in
an Automotive Chassis.” Computer Added Design and application , page no. (67-75),2011. IV. Renuke Pravin “A Dynamic analysis of a Car Chassis” International journal of Engineering
Research and application (IJERA), volume – 02, Issue-06, page no. (955-959), Nov. – Dec 2012.
V. Agarwal Monika S. and Razik Md. “A Review on study of analysis of chassis” International Journal
of modern Engineering Research (IJMER), volume – 03,Issue -02, Page no –(1135-1138) ,March – April 2013
VI. Patil Hemant B, Kachave Sharad D. and Deore Eknath R. “Stress analysis of Automotive Chassis
with various thicknesses” IOSR Journal of Mechanical and Civil Engineering (IOSR – JMCE), Volume- 06, Issue-01, page no. (44-49), Mar.- Apr. 2013
VII. Dr. Rajappan R. and Vivekanandhan M. “Static and modal Analysis of Chassis by using Fea” The
International Journal of Engineering and Science (Ijes), Volume-2 , Issue-2, page no. (63-67), 2013
VIII. Moaaz Ahmad O. and GhazalyNouby M. “A Review of the Fatique Analysis of heavy Duty Truck
frames” American Journal of Engineering Research (AJER), Volume-03, Issue-10, page no.-(01-06), 2014
IX. M.P. Prajwal Kumar, MurlidharanVivek and Madhusudhana G. “Design and Analysis of a tubular
space frame Chassis of high performance race car.” International Journal of research in Engineering and Technology, volume – 03, Issue – 02, page no. (497-501), Feb. 2014
X. Jogi N.G., Take Akshay P. and Aftab Sheikh M. “Review work on analysis of F1 Car frame using
ANSYS” International Journal of research in Engineering and technology, Volume-03, Issue-04, page no. (215-217), Apr.2014
XI. Ghodvinde Kiran and Wankhade S.R. “Structural stress analysis of an automotive vehicle Chassis.”
International Journal on Mechanical Engineering and Robotics (IJMER), Volume – 02, Issue -06, page no. (2321-2325), June -2014
XII. Shiva kumar M. M. and Nirmala L. “ Fatigue Life Estimation of Chassis frame FESM Bracket for
Commercial Vehicle.” Volume-03, Issue-08, page no. (441-447), Aug-2014
XIII. Moaaz Ahmad O. and Ghazaly Nouby M. “ Finite Element Stress Analysis of truck Chassis using
ANSYS: Review.” International journal of advances in Engineering & Technology, Volume – 07, Issue -05, page no. (1386-1391), Nov.-2014
XIV. Gadagottu Indu and Mallikarjun M.V. “Structural analysis of heavy vehicle Chassis using honey
comb Structure.” International Journal of Mechanical Engineering & Robotics Research, Volume-04, Issue, page no. (173-172), Jan.-2015
XV. Patil Suraj B. and Josi Dinesh G. “Structural Analysis of Chassis: A Review” international Journal
of Research in Engineering Technology, Volume-04, Issue-04, page no. (293-296), Apr.-2015
XVII. Patil Kamlesh Y. and Deore Eknath R. “ Stress Analysis of Ladder Chassis with Various Cross Sections “ IOSR journal of Mechanical & civil Engineering (IOSR-JMCR), Volume -12, Issue-04, page no.(111-116), july-Aug 2015
XVIII. Mr. Birajdar M.D. and Prof. Mule J.Y. “ Design Modification of Ladder Chassis Frame”
International Journal of Science Engineering and Technology Research, Volume- 04, Issue-10, page no. (3443-3449), Oct-2015
XIX. Dubey Ashutosh and Dubedy Vivek “Vehicle Chassis Analysis : Load cases and Boundary