DEVELOPMENT OF PERFORMANCE MODELS FOR A TYPICAL
FLEXIBLE ROAD PAVEMENT IN NIGERIA
Adebayo Oladipo Owolabi1, Obanishola Mufutau Sadiq2, Oladapo Samson Abiola3
1 Department of Civil Engineering, Federal University of Technology, Akure, Nigeria 2 Department of Civil Engineering, University of Lagos, Lagos Nigeria
3 Department of Civil Engineering, University of Agriculture, Abeokuta, Nigeria
Received 19 January 2012; accepted 17 April 2012
Abstract: The results of a study conducted to facilitate the development of road pavement performance models that are appropriate for Nigeria and similar developing countries and could predict the rate of deterioration over their lifespan have been presented. Comprehensive investigations were carried out on the expressway linking Lagos (the economic nerve centre of Nigeria) with Ibadan (the largest city in West Africa) - apparently one of the most heavily trafficked roads in the country. Data relating to traffic characteristics, pavement condition ratings, distress types, pavement thickness, roughness index, rainfall and temperature, were collected. Models were developed to determine Pavement Condition Score (PCS) and International Roughness Index (IRI). Stepwise Regression was used to analyse the data and quantify the impact of key input parameters on the PCS and IRI. Parameters such as depth of ruts and area of pot holes were found to be statistically significant in predicting PCS while number of patches, length of longitudinal cracks and depth of ruts were statistically significant in predicting IRI. The models can be used for planning road maintenance programs, thus minimizing the need for comprehensive data collection on pavement condition before the maintenance exercise, which is costly and time consuming.
Keywords:pavement, performance, models, road, maintenance.
1. Introduction
1 Corresponding author: [email protected]
Accurate prediction of rates of deterioration of roads is important in road management systems, to ensure efficient prioritisation and for setting budget levels (Fwa and Sinha, 1985). A road pavement deteriorates under the combined actions of traffic loading and environment, thus reducing quality of ride (Haas et al., 1994). Useful models should be able to quantify the contribution
of relevant variables such as strength of pavement materials, traffic, and environmental conditions to pavement deterioration (Flora et al., 2001; Madanat et al., 2001).
therefore not surprising that deterioration modelling of infrastructural facilities with particular interest in pavements abounds in literature (Madanat et al., 1995; Flintsch, 2003; Loizos et al., 2002).
Traditionally, ranking of highway sections for maintenance operations in Nigeria have been based wholly on the experience and judgement of highway engineers and maintenance personnel. However, due to the randomness and complex interactions of the factors involved in pavement deterioration mechanism, this approach is inefficient, prone to errors and may lead to improperly scheduled maintenance activities. It is disheartening to note that most of the roads in the country are in various states of disrepair and many of them have become hazardous and sources of economic drain in terms of high road users cost, loss of lives and property and loss of highway investment (Abiola et al., 2010). The officials of various transportation departments wait for small potholes to deteriorate into craters before taking action. As a road is constructed and opened to traffic, all sort of activities develop around it and the hopes of people in the locality are raised. These hopes and aspirations become dashed as the road deteriorates and its level of service diminishes. (Owolabi and Abiola, 2011)
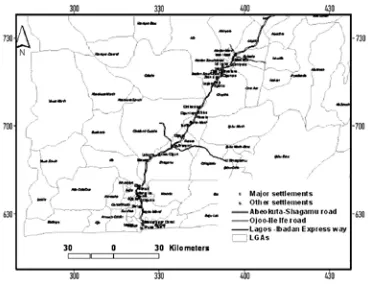
In this study, road performance models capable of simulating the deterioration process of a typical pavement and predicting the conditions over time were developed using Lagos-Ibadan expressway (Fig. 1) as case study. The expressway links Lagos (the economic nerve centre of Nigeria) with Ibadan (the largest city in West Africa) and is one of the most heavily trafficked roads in the country. The road, which is one of the first expressways in Nigeria lies within longitude 30 30’ to 30 48’ East of Greenwich Meridian and latitude 60 40’ to 60 50’ North of the equator, within the South-Western region of Nigeria. Its pavement is presently characterized by cracks, ruts, depressions and potholes making riding quality poor. Pavement performance models have never been developed for the road in question, thus resulting in numerous unscheduled and costly maintenance operations on it. Against this backdrop, this article presents the methodology for developing models for predicting the pavement condition of a representative Nigerian road using multiple linear regression and putting into consideration the interplay of all possible factors that affect pavement deterioration process. The results of this study are applicable to other developing countries of the world with similar climatic, soil and traffic conditions.
2. Development of Pavement Condition
Prediction Models
A number of pavement condition rating systems which simulate the deterioration process of road pavements and forecast their condition over time have been developed for use by road maintenance agencies in various countries. They include Pavement Condition Index (PCI), Present Serviceability Rating (PSR), Present Serviceability Index (PSI), International Roughness Index (IRI) and Maintenance Needs Index among others (Theberge, 1987; WSDOT, 2005). However, the processes of obtaining most of these indices are very demanding in terms of personnel training required and complicated survey procedures (WSDOT, 2005). In this research, a pavement condition rating system for a typical Nigerian road - the Pavement Condition Score (PCS) - and a model for obtaining its values were developed. Another model was also formulated for predicting the International Roughness Index based on data on road distresses.
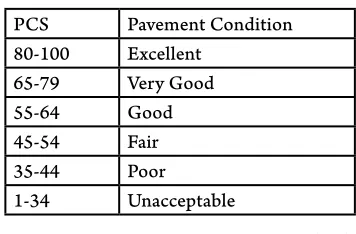
The Pavement Condition Score (PCS), combines, in a systematic manner, severity levels of the distress types occurring within a given road section into a scale of 1 to 100, where 1 represents a very poor pavement and 100 a pavement in excellent condition. The distress categories considered include potholes, cracks, rut and patches, which are major features of Nigerian roads.
The IRI is an expression of irregularities in pavement surface that adversely affect the quality of ride of vehicles and also their operational cost. The index measures pavement roughness in terms of the number
of metres per kilometre that a laser mounted in a specialised van jumps as it is driven across a road. Lower values of IRI are indicative of highways with little surface imperfections and consequently, smoother ride.
2.1. Data Collection
In order to determine the model parameters, data on the road under study were collected for four consecutive years to obtain a broad picture of pavement conditions under various climatic and traffic situations. The Information on pavement distresses such as length of cracks, rut depths and area of potholes were obtained through field survey.
Data on PCS were obtained by painstakingly assigning values ranging from 1 to 100 to various sections of the expressway, 1 representing a very poor pavement and 100 a pavement in excellent condition. This is further explained in Table 1.
Table 1
Pavement Condition Rating
Data on International Roughness indices (IRI) for the road were obtained from the Pavement Evaluation Unit of the federal ministry of Works, Nigeria.
The data collected were subjected to multiple linear regression analysis to determine the
PCS Pavement Condition 80-100 Excellent
65-79 Very Good
55-64 Good
45-54 Fair
35-44 Poor
Where:
β0 - value of constant term
β1, β2 and β3 - coefficients of the independent variables
e - error term.
Calg - severity level of alligator crack (depending on length of alligator crack)
Clong - severity level of longitudinal crack (depending on length of longitudinal crack Pa - number of patches
R - severity level of rut (depending on rut depth)
Ph - severity level of pothole (depending on
area of pothole)
The severity level of distresses is measured on a scale of 0 to 5 where 0 represents a case where there is no distress and 5, a case of severe occurrence of distress. The ordinary least square method in which the best-fitting line for the observed data is calculated by minimizing the sum of the squares of the vertical deviations from each data point to the line was used for estimating model parameters with the aid of SPSS software.
3. Results and Discussion
The developed models for determining the PCS and IRI are given in Eq. (3) and Eq. (4): relationships between PCS and IRI values
and the severity levels of various road defects such as cracks, ruts, potholes and patches.
2.2. Multiple Linear Regression Analyses
Regression is one of the most widely used and powerful analysis techniques used for
model development.Multiple linear regression attempts to model the relationship between two or more explanatory variables and a response variable by fitting a linear equation to observed data. The relationships between the dependent variables and independent variables were represented by the following equations (Eq. (1) and Eq. (2)):
(1) (2)
(3) (4)
The Standard error test and the student’s test of null hypothesis were used in determining the confidence that may be placed in the estimates of the parameters. The test of significance also reveals the influence of model parameters on PCS and IRI. These are shown in Table 2 and Table 3.
The P values indicate that only Ph, R and the
Std. Error T P-Value
Constant 5.626 13.431 0.000
Calg 0.070 0.161 0.873
Clong 0.215 -0.762 0.451
Pa 1.427 0.078 0.939
Ph 1.755 -2.274 0.029
Ru 0.089 -2.704 0.010
R2 = 0.61
Table 2
Parameters of Pavement Condition Score (PCS) Model
Table 3
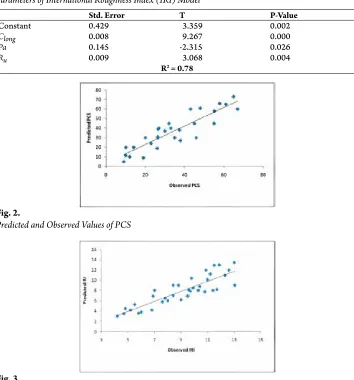
Parameters of International Roughness Index (IRI) Model
Table 2
Parameters of Pavement Condition Score (PCS) Model
Std. Error T P-Value
Constant 0.429 3.359 0.002
Clong 0.008 9.267 0.000
Pa 0.145 -2.315 0.026
Ru 0.009 3.068 0.004
R2 = 0.78
Fig. 2.
Predicted and Observed Values of PCS
Fig. 3.
Ignoring all insignificant parameters in the PCS model, the equation is reduced to Eq. (5):
The goodness of fit of the models or their robustness could be determined from the R square values. R2 values of 0.61 and 0.78 for PCS and IRI respectively indicate that both models are fairly robust in replicating the observed data. However, the IRI model is more robust in prioritizing road maintenance activities. Fig. 2 and Fig. 3 show the relationship between the observed and predicted values of PCS and IRI.
4. Conclusion
Road pavement performance models that are appropriate for predicting rate of deterioration of roads in Nigeria and other developing countries of the world with similar climatic, soil and traffic conditions have been developed. The models were based on data collected for PCS and IRI on the expressway linking Lagos (the economic nerve centre of Nigeria) with Ibadan, (the largest city in west Africa) - apparently one of the most heavily trafficked roads in the country. Parameters such as rut depth and area of potholes were found to be statistically significant for predicting PCS while number of patches, length of longitudinal cracks and rut depth were statistically significant in predicting IRI. The models were validated using current data. The validation showed that the models can predict pavement deterioration with reasonable accuracy, and as such, can be used to update pavement condition data prior to each maintenance program. This will eliminate the need for comprehensive data collection on pavement condition prior to the maintenance exercise, which is costly and time consuming.
References
Abiola, O.S.; Owolabi, A.O.; Odunfa, S.O.; Olusola, A. 2010. Investigation into causes of premature failure of highway pavements in Nigeria and remedies. In Proceedings of the Nigeria Institution of Civil Engineers (NICE) conference.
Bandana, N.; Gunartne, M. 2001. Current and future pavement maintenance prioritization based on rapid visual condition evaluation, Journal of transportation engineering. DOI: http://dx.doi.org/10.1061/(ASCE)0733-947X(2001)127:2(116), 127(2): 116-123.
Flintsch, G.W. 2003. Soft computing applications in pavement and infrastructure management: state of the art. In Proceedings of the 2003 transportation research board annual meeting, Washington, DC.
Flora, W.F.; Gulen, S.; Shan, J.; Weaver, J.; Zhu, K. 2001.
Development of improved pavement performance prediction models for the Indiana pavement management system. DOI: http:// dx.doi.org/10.5703/1288284313192. Joint transportation research program. Project No. C36-78H. File 3-10-8. SPR-2403. West Lafayette, Indiana. 11 p.
Fwa, T.F.; Sinha, K.C. 1985. Routine maintenance and pavement performance, Journal of transportation engineering. DOI: http://dx.doi.org/10.1061/(ASCE)0733-947X(1986)112:4(329), 112(4): 329-345.
Haas, R.; Hudson, W.R.; Zaniewski, J. 1994. Modern pavement management systems. Krieger publishing company, USA. 583 p.
Loizos, A.; Roberts, J.; Crank, S. 2002. Asphalt pavement deterioration models for mild climatic conditions. In
Proceedings of the 9th international conference on asphalt pavements,
ISAP, Copenhagen: 926-942.
Madanat, S.; Bulusu, S.; Mahmoud, A. 1995. Estimation of infrastructure distress initiation and progression models,
Madanat, S.; Prozzi, J.A.; Michael H. 2001. Effect of performance model accuracy on optimal pavement design,
Computer-aided civil and infrastructure engineering journal,
17(1): 22-30.
Owolabi, A.O; Abiola, O.S. 2011. Development of priority index assessment model for road pavements in Nigeria. In Proceedings of the 8th International Conference on Managing Pavement Assets (ICMPA), Chile.
Theberge, P.E. 1987. Development of mathematical models to assess highway maintenance needs and establish rehabilitation threshold levels, Journal of transportation research board, 1109: 27-35.
WSDOT. 2005. Washington State Department of Transportation Pavement Guide. Available from Internet: <http://training.ce.washington.edu/WSDOT/>.
RAZVOJ MODELA PERFORMANSI
FLEKSIBILNE BETONSKE KOLOVOZNE
KONSTRUKCIJE U NIGERIJI
Adebayo Oladipo Owolabi, Obanishola Mufutau Sadiq, Oladapo Samson Abiola
Sažetak: U radu su predstavljeni rezultati studije sprovedene u cilju razvoja modela performansi betonske kolovozne konstrukcije, koji su karakteristični za Nigeriju i slične zemlje u razvoju i kojima je moguće predvideti stopu pogoršanja u toku eksploatacionog veka kolovozne konstrukcije. Detaljna istraživanja su sprovedena na jednoj od najopterećenijih saobraćajnica u državi, autoputu koji povezuje Lagos (ekonomski centar Nigerije) i Ibadan (najveći grad Zapadne Afrike). Prikupljeni su podaci koji se odnose na karakteristike saobraćaja, ocenu stanja kolovoza, vrste oštećenja, debljinu kolovozne konstrukcije, indeks hrapavosti, padavine i temperaturu. Razvijeni su modeli za određivanje ocene stanje kolovoza (PCS) i međunarodog indeksa hrapavosti (IRI). Za analizu podataka i ocenu uticaja ključnih ulaznih parametara na PCS i IRI, primenjena je multipla regresiona analiza. Utvrđeno je da su za određivanje PCS statistički značajni parametri poput dubine kolotraga i površine udarnih rupa, dok su broj zakrpa, dužine longitudinalnih pukotina i dubine kolotraga značajani za predviđanje IRI. Razvijene modele je moguće koristiti za planiranje programa održavanja puteva čime se minimizira skup i dugotrajan proces prikupljanja podataka o stanju kolovozne konstrukcije pre održavanja.