VAR Analysis of the Monetary Transmission
Mechanism in Kyrgyzstan
Nurlan ATABAEV*, Junus GANIYEV**
Abstract
This article examines the effects of monetary transmission on real output and price level in Kyrgyzstan which is very important issue for central banks. We analyzed the relationships between the money supply, real output, price level, interest rate, credit and real exchange rate by using the vector autoregression approach (VAR) and monthly data for 2003-2011. As a result the interest rate channel remains weak, on the other hand it have been revealed that the credit channel has some affects to real output, the exchange rate channel affects the prices. Exchange rate channel remains still the most effective channel. Based on these results, it can be argued that government can use credit and interest rate channel in increasing real output, and the exchange rate channel in achieving price stability in Kyrgyzstan.
Keywords: Monetary policy, transmission mechanism, vector autoregression,
Kyrgyzstan
JEL Code Classification: E51, E52, E58, O40
1. Introduction
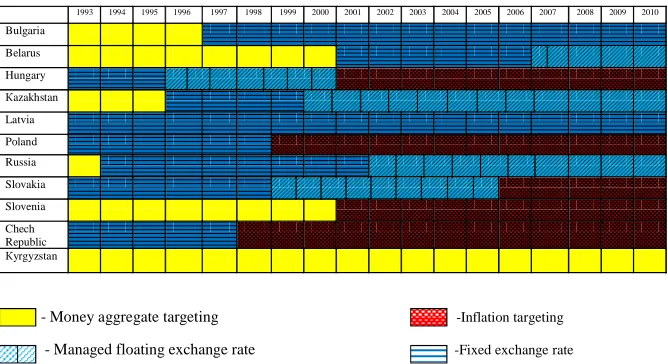
Political and economic transition proved to be difficult and challenging process in Kyrgyzstan (Kurmanalieva, 2008:85). Kyrgyzstan was the pioneer country in Central Asia who introduced national currency and started independent monetary policy. The primary objective of the National Bank of Kyrgyz Republic (NBKR) as defined in the law of NBKR in 1992 (1997) is to maintain price stability and to assist economic growth. For 20 years NBKR has not changed the monetary policy target which is monetary aggregates as seen in Figure 1.
Figure 1: Evolution of regimes of monetary policy within the transition
economies countries
When the neighbor and other CIS countries were adopted different targets because of change the world economy, global financial crises and financial integrations. At the beginning and mid 1990 Central Bank of Kyrgyz Republic succeeded in stabilizing prices by managing high inflation process. Since 2000 in Kyrgyz Republic globalization and high degree of dollarization changes the demand and money supply in money market which make monetary policy limited. We go on to analyze the transmission mechanisms of monetary policy and evaluate the empirical evidence on them to understand better the role of the monetary policy in the Kyrgyz Republic.
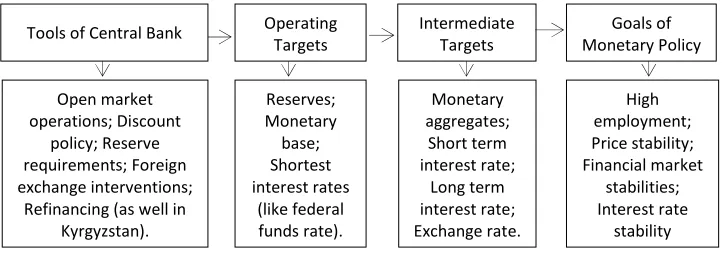
By using tools the central bank can regulate the monetary base and reserves to aim for change money supply, which have impact on macroeconomic process. The strategy in Kyrgyz Republic is written in red as seen in Figure 2. Which are as final goal of monetary policy is price stability, intermediate target is monetary aggregate, and operating target is monetary base, also NBKR has all arsenal tools of monetary policy. To find out the efficiency of monetary policy we will start from analyzing the link between monetary targets and price stability.
1993 1994 1995 1996 1997 1998 1999 2000 2001 2002 2003 2004 2005 2006 2007 2008 2009 2010
Bulgaria
Belarus
Hungary
Кazakhstan Latvia
Poland
Russia
Slovakia
Slovenia
Chech Republic
Кyrgyzstan
- Money aggregate targeting -Inflation targeting
The advantages of monetary targets are that: first monetary targets can send almost immediate signals to both the public and markets about the stance of monetary policy to keep inflation in check. Second monetary targets promote almost immediate accountability for monetary policy to keep inflation low and so constrain the monetary policymaker from falling into the time-inconsistency trap. The advantages of monetary aggregate targeting will work if there will be a strong and reliable relationship between the goal variable (price stability) and the targeted aggregate and if targeted monetary aggregate must be well controlled by the central bank. If the relationship between the monetary aggregate and the goal variable is weak, or the weak control of money supply than monetary aggregate targeting will not work. By the VAR approach analyzes results shows on a Figure 2 that the monetary aggregate does not impact to inflation and output.
Figure 2: Strategy of Central Bank
2. Literature
Many researches have been done on monetary transmission mechanism in developed and developing countries. Transmission mechanism studies in USA has been done by Bernanke and Blinder (1992), Bernanke and Garter (1995). Kakes (1998) in Holland; Hsing (2004) in Argentine; Morsink and Bayoumi (2001) in Japan; Chow (2004) Singapore; Drobyshewsky (2008) in Russia, in Turkey the transmission mechanism researches have been done by Cavusoglu (2002), Seyrek (2004) and Gunduz (2001) but they had different results. According to Ornek (2009) monetary transmission mechanism impact to real GDP was mainly through the interest rate channel. And the exchange rate channel was efficient as well but the asset and bank lending channels were insignificant. In Kyrgyzstan before has not been done any study on transmission mechanism on monetary policy.
3. Data and Methodology
We use seasonally adjusted data from 2003/01 to 2012/12 to study the monetary transmission mechanism empirically in Kyrgyz Republic. The dataset included the following variables:
Reserves; Monetary base; Shortest interest rates
(like federal funds rate). Open market
operations; Discount policy; Reserve requirements; Foreign exchange interventions;
Refinancing (as well in Kyrgyzstan).
Monetary aggregates;
Short term interest rate;
Long term interest rate; Exchange rate.
High employment; Price stability; Financial market
stabilities; Interest rate
stability Goals of Monetary Policy Intermediate
Targets Operating
gdp: Real Gross Domestic (2000 base year price); cpi: Consumer Price Index;
m2: Monetary Aggregate (mill. som); er: Nominal Exchange Rate of USA dollar;
irate: Average Interest Rate of given credits by commercial banks; credit: Volume of given credits by commercial banks (mill. sоm).
These variables are taken from the National Bank of Kyrgyz Republic and the National Statistic Committee.
To eliminate the spurious regression problem we use Augmented Dickey Fuller test where we get all variables stationary by their logarithm and first-differences as shown in Table 1.
Table 1: ADF Unit Root Test’ Results
Level First Differences
Variable Lags t-value p-value Variable Lags t-value p-value
lgdp_sa 0 -4,94* 0,000 - - - -
lcpi 0 -6,36* 0,000 - - - -
lm2 0 -0,69 0,841 dlm2 0 -10,51* 0,000
Ler 1 -1,40 0,578 dlеr 0 -6,39* 0,000
lirate 4 -2,24 0,193 dlirate 0 -8,59* 0,000
lcredit 0 -0,11 0,994 dlcredit 0 -7,74* 0,000
Note: All of these tests include only a constant term as an exogenous variable.
* indicates stationarity on the 1% level.
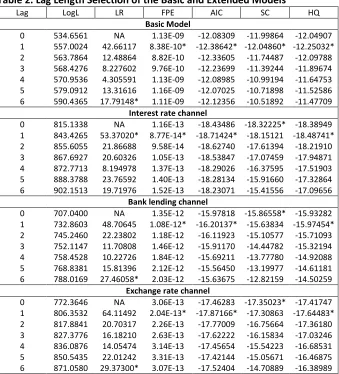
Akaike (AIC) and Schwarz (SC) information criteria suggested same optimal one lag lengths in the basic model and other transmission channels for VAR model as seen in Table 2.
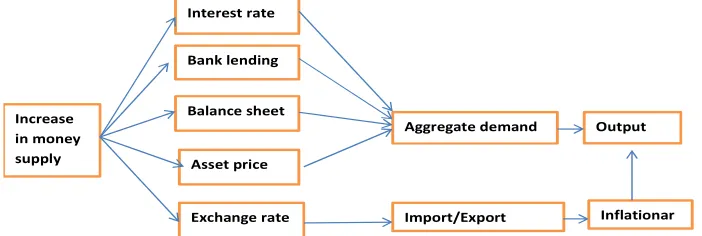
In this paper first analyzed the Granger causality tests in order to estimate VAR model regarding to methodology. The order of the variables is based on the assumption that shock to the money supply would be transmitted through the transmission channels to the price level and output as shown in Figure 3 below.
Figure 3: Transmission mechanism of monetary policy
Increase in money supply
Exchange rate Asset price Balance sheet Bank lending
Aggregate demand Output
Inflationar Import/Export
Table 2. Lag Length Selection of the Basic and Extended Models
Lag LogL LR FPE AIC SC HQ
Basic Model
0 534.6561 NA 1.13E-09 -12.08309 -11.99864 -12.04907
1 557.0024 42.66117 8.38E-10* -12.38642* -12.04860* -12.25032*
2 563.7864 12.48864 8.82E-10 -12.33605 -11.74487 -12.09788
3 568.4276 8.227602 9.76E-10 -12.23699 -11.39244 -11.89674
4 570.9536 4.305591 1.13E-09 -12.08985 -10.99194 -11.64753
5 579.0912 13.31616 1.16E-09 -12.07025 -10.71898 -11.52586
6 590.4365 17.79148* 1.11E-09 -12.12356 -10.51892 -11.47709
Interest rate channel
0 815.1338 NA 1.16E-13 -18.43486 -18.32225* -18.38949
1 843.4265 53.37020* 8.77E-14* -18.71424* -18.15121 -18.48741*
2 855.6055 21.86688 9.58E-14 -18.62740 -17.61394 -18.21910
3 867.6927 20.60326 1.05E-13 -18.53847 -17.07459 -17.94871
4 872.7713 8.194978 1.37E-13 -18.29026 -16.37595 -17.51903
5 888.3788 23.76592 1.40E-13 -18.28134 -15.91660 -17.32864
6 902.1513 19.71976 1.52E-13 -18.23071 -15.41556 -17.09656
Bank lending channel
0 707.0400 NA 1.35E-12 -15.97818 -15.86558* -15.93282
1 732.8603 48.70645 1.08E-12* -16.20137* -15.63834 -15.97454*
2 745.2460 22.23802 1.18E-12 -16.11923 -15.10577 -15.71093
3 752.1147 11.70808 1.46E-12 -15.91170 -14.44782 -15.32194
4 758.4528 10.22726 1.84E-12 -15.69211 -13.77780 -14.92088
5 768.8381 15.81396 2.12E-12 -15.56450 -13.19977 -14.61181
6 788.0169 27.46058* 2.03E-12 -15.63675 -12.82159 -14.50259
Exchange rate channel
0 772.3646 NA 3.06E-13 -17.46283 -17.35023* -17.41747
1 806.3532 64.11492 2.04E-13* -17.87166* -17.30863 -17.64483*
2 817.8841 20.70317 2.26E-13 -17.77009 -16.75664 -17.36180
3 827.3776 16.18210 2.63E-13 -17.62222 -16.15834 -17.03246
4 836.0876 14.05474 3.14E-13 -17.45654 -15.54223 -16.68531
5 850.5435 22.01242 3.31E-13 -17.42144 -15.05671 -16.46875
6 871.0580 29.37300* 3.07E-13 -17.52404 -14.70889 -16.38989
Note: * indicates lag order selected by the criterion; LR: sequential modified; LR test statistic (each test
at 5% level); FPE: Final prediction error; AIC: Akaike information criterion; SC: Schwarz information criterion; HQ: Hannan-Quinn information criterion.
4. Basic Model
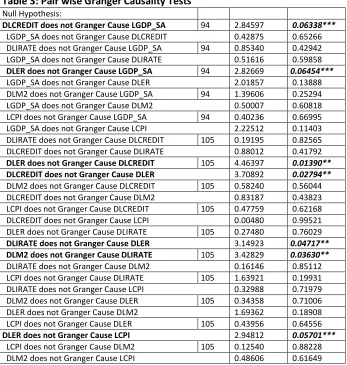
The test indicates that in a basic model monetary aggregate has an insignificant Granger effect on output and on price level. An extended model Granger causality test results are as seen in Table 3.
Table 3: Pair wise Granger Causality Tests
Null Hypothesis:
DLCREDIT does not Granger Cause LGDP_SA 94 2.84597 0.06338***
LGDP_SA does not Granger Cause DLCREDIT 0.42875 0.65266
DLIRATE does not Granger Cause LGDP_SA 94 0.85340 0.42942
LGDP_SA does not Granger Cause DLIRATE 0.51616 0.59858
DLER does not Granger Cause LGDP_SA 94 2.82669 0.06454***
LGDP_SA does not Granger Cause DLER 2.01857 0.13888
DLM2 does not Granger Cause LGDP_SA 94 1.39606 0.25294
LGDP_SA does not Granger Cause DLM2 0.50007 0.60818
LCPI does not Granger Cause LGDP_SA 94 0.40236 0.66995
LGDP_SA does not Granger Cause LCPI 2.22512 0.11403
DLIRATE does not Granger Cause DLCREDIT 105 0.19195 0.82565
DLCREDIT does not Granger Cause DLIRATE 0.88012 0.41792
DLER does not Granger Cause DLCREDIT 105 4.46397 0.01390** DLCREDIT does not Granger Cause DLER 3.70892 0.02794**
DLM2 does not Granger Cause DLCREDIT 105 0.58240 0.56044
DLCREDIT does not Granger Cause DLM2 0.83187 0.43823
LCPI does not Granger Cause DLCREDIT 105 0.47759 0.62168
DLCREDIT does not Granger Cause LCPI 0.00480 0.99521
DLER does not Granger Cause DLIRATE 105 0.27480 0.76029
DLIRATE does not Granger Cause DLER 3.14923 0.04717** DLM2 does not Granger Cause DLIRATE 105 3.42829 0.03630**
DLIRATE does not Granger Cause DLM2 0.16146 0.85112
LCPI does not Granger Cause DLIRATE 105 1.63921 0.19931
DLIRATE does not Granger Cause LCPI 0.32988 0.71979
DLM2 does not Granger Cause DLER 105 0.34358 0.71006
DLER does not Granger Cause DLM2 1.69362 0.18908
LCPI does not Granger Cause DLER 105 0.43956 0.64556
DLER does not Granger Cause LCPI 2.94812 0.05701***
LCPI does not Granger Cause DLM2 105 0.12540 0.88228
DLM2 does not Granger Cause LCPI 0.48606 0.61649
Note: *, **, and *** denote rejection of the null at the 1%, 5%, and 10% levels, respectively.
4.1. Impulse Responses
analyses because of high level of dollarization. But the monetary view on money supply leads to increase output confirmed by the impulse response function, which as shown peaking after first month gradually declines after 6th month.
Figure 4: Impulse response function for the Basic Model
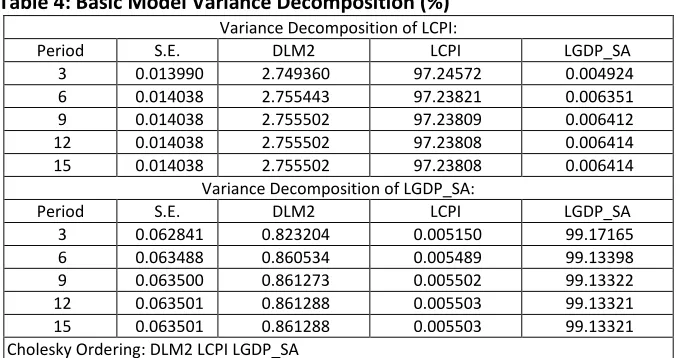
The variance decomposition demonstrates that money shock is account for 2.75% in price while own shocks account for 97% and money supply account for 0.86% in output while own shock account for 99% as seen in Table 4.
Transmission channels of monetary transmission mechanism transfers through the extended channels as: interest rate channel; bank lending channel; exchange rate channel; asset price channel and balance sheet channel. Because of undeveloped capital market and opaque corporate accounting we will not consider the last two channels which are asset price and balance sheet channels.
Table 4: Basic Model Variance Decomposition (%)
Variance Decomposition of LCPI:
Period S.E. DLM2 LCPI LGDP_SA
3 0.013990 2.749360 97.24572 0.004924
6 0.014038 2.755443 97.23821 0.006351
9 0.014038 2.755502 97.23809 0.006412
12 0.014038 2.755502 97.23808 0.006414
15 0.014038 2.755502 97.23808 0.006414
Variance Decomposition of LGDP_SA:
Period S.E. DLM2 LCPI LGDP_SA
3 0.062841 0.823204 0.005150 99.17165
6 0.063488 0.860534 0.005489 99.13398
9 0.063500 0.861273 0.005502 99.13322
12 0.063501 0.861288 0.005503 99.13321
15 0.063501 0.861288 0.005503 99.13321
Cholesky Ordering: DLM2 LCPI LGDP_SA
-.005 -.004 -.003 -.002 -.001 .000 .001 .002
2 4 6 8 10 12 14
Response of LCPI to DLM2
-.010 -.005 .000 .005 .010 .015 .020
2 4 6 8 10 12 14
4.2. Interest Rate Channel
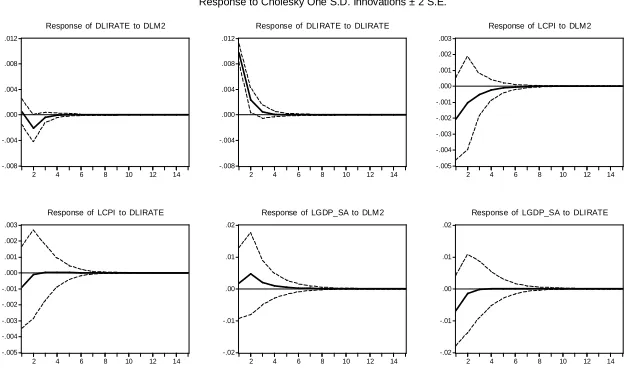
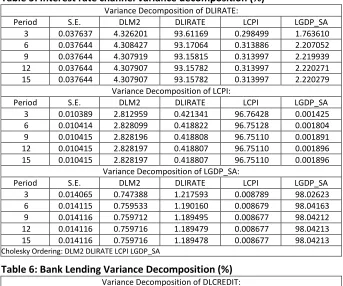
Traditional Interest Rate channel is the key monetary transmission mechanism in the Keynesian IS-LM model. In order to analyze the effect of the interest rate channel, we add the commercial banks interest rate for credits to the basic model. This permits us to consider how money supply impacts interest rate, how interest rates affect output and inflation. As shown on Figure 5 the monetary change impact to interest rate negatively as confirmed in theory. The monetary shock effect to interest rate remains only for 3 month. Interest rate shock impact to inflation and output negatively as anticipated and effect lasted for 2 month in a both cases.
Figure 5. Impulse response functions to interest rate
The interest rate variance decomposition indicates innovations to money supply account for 4.3% of the fluctuation in interest rate as seen in Table 5. The decrease of interest rate increase output as seen in impulse response function than NBKR can increase output by increasing money supply though the interest rate channel.
In general interest rate channel in money transmission mechanism is not efficient. Due to these reasons: 1) there is no correlation between the discount rate and commercial banks interest rate; 2) because of weak competition between commercial banks interest rates are remains high and the low levels of financial intermediation and monetization (average given credit to GDP in 2003 – 2011 was 10.16%). -.008 -.004 .000 .004 .008 .012
2 4 6 8 10 12 14
Response of DLIRATE to DLM2
-.008 -.004 .000 .004 .008 .012
2 4 6 8 10 12 14
Response of DLIRATE to DLIRATE
-.005 -.004 -.003 -.002 -.001 .000 .001 .002 .003
2 4 6 8 10 12 14
Response of LCPI to DLM2
-.005 -.004 -.003 -.002 -.001 .000 .001 .002 .003
2 4 6 8 10 12 14
Response of LCPI to DLIRATE
-.02 -.01 .00 .01 .02
2 4 6 8 10 12 14
Response of LGDP_SA to DLM2
-.02 -.01 .00 .01 .02
2 4 6 8 10 12 14
Response of LGDP_SA to DLIRATE
Table 5: Interest rate channel variance decomposition (%)
Variance Decomposition of DLIRATE:
Period S.E. DLM2 DLIRATE LCPI LGDP_SA
3 0.037637 4.326201 93.61169 0.298499 1.763610
6 0.037644 4.308427 93.17064 0.313886 2.207052
9 0.037644 4.307919 93.15815 0.313997 2.219939
12 0.037644 4.307907 93.15782 0.313997 2.220271
15 0.037644 4.307907 93.15782 0.313997 2.220279
Variance Decomposition of LCPI:
Period S.E. DLM2 DLIRATE LCPI LGDP_SA
3 0.010389 2.812959 0.421341 96.76428 0.001425
6 0.010414 2.828099 0.418822 96.75128 0.001804
9 0.010415 2.828196 0.418808 96.75110 0.001891
12 0.010415 2.828197 0.418807 96.75110 0.001896
15 0.010415 2.828197 0.418807 96.75110 0.001896
Variance Decomposition of LGDP_SA:
Period S.E. DLM2 DLIRATE LCPI LGDP_SA
3 0.014065 0.747388 1.217593 0.008789 98.02623
6 0.014115 0.759533 1.190160 0.008679 98.04163
9 0.014116 0.759712 1.189495 0.008677 98.04212
12 0.014116 0.759716 1.189479 0.008677 98.04213
15 0.014116 0.759716 1.189478 0.008677 98.04213
Cholesky Ordering: DLM2 DLIRATE LCPI LGDP_SA
Table 6: Bank Lending Variance Decomposition (%)
Variance Decomposition of DLCREDIT:
Period S.E. DLM2 DLCREDIT LCPI LGDP_SA
3 0.037637 2.599114 96.42528 0.932691 0.042916
6 0.037646 2.606114 96.30439 1.034956 0.054539
9 0.037646 2.606097 96.30324 1.035890 0.054769
12 0.037646 2.606096 96.30323 1.035896 0.054772
15 0.037646 2.606096 96.30323 1.035896 0.054773
Variance Decomposition of LCPI:
Period S.E. DLM2 DLCREDIT LCPI LGDP_SA
3 0.037600 2.750957 0.369898 96.86696 0.012181
6 0.037629 2.754689 0.367589 96.86134 0.016386
9 0.037630 2.754739 0.367581 96.86110 0.016577
12 0.037630 2.754739 0.367581 96.86110 0.016582
15 0.037630 2.754739 0.367581 96.86110 0.016582
Variance Decomposition of LGDP_SA:
Period S.E. DLM2 DLCREDIT LCPI LGDP_SA
3 0.014069 0.833562 6.375947 0.037113 92.75338
6 0.014116 0.879440 6.454955 0.036541 92.62906
9 0.014116 0.880374 6.456634 0.036573 92.62642
12 0.014116 0.880392 6.456665 0.036575 92.62637
15 0.014116 0.880393 6.456665 0.036575 92.62637
4.3. Bank Lending Channel
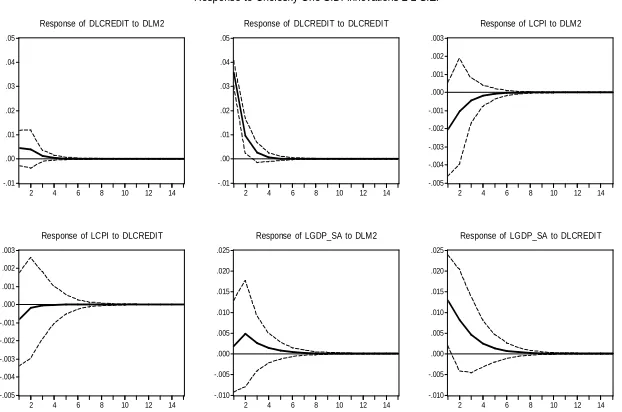
Expansionary monetary policy increase bank reserves which increase the quantity of bank loans available. One – standard deviation bank lending shock impact on output statistically significant. The impulse response function positively effect on output as anticipated and remains for 6 month but effect on price insignificant as shown in Figure 6. Bank lending channel is more efficient than the interest rate channel.
The variance decomposition innovations to money supply account for 2.5% of the fluctuation in bank lending as seen in Table 6. Innovations to bank loan account for 6.7% of the fluctuation in output. Despite the low level of crediting economy by banks.
To increase the output in Kyrgyz Republic the NBKR can use the bank lending channel. The NBKR can improve the bank lending channel by implementing the discount loans and refinancing to increase the reserves of commercial banks. Nowadays average interest rate is 21% in Kyrgyz Republic which is very expensive. That is why loans are invests in a trade rather than in a real economy. The reasons for weak crediting the real economy are: 1) low integration of economic agents with the banking system; 2) creditworthiness of the economic agents is low due to opaque corporate accounting as they are not willing to show profitability of the company; 3) as an alternative source of financing for business serves remittances.
Figure 6: Impulse response functions to Bank lending channel
-.01 .00 .01 .02 .03 .04 .05
2 4 6 8 10 12 14 Response of DLCREDIT to DLM2
-.01 .00 .01 .02 .03 .04 .05
2 4 6 8 10 12 14 Response of DLCREDIT to DLCREDIT
-.005 -.004 -.003 -.002 -.001 .000 .001 .002 .003
2 4 6 8 10 12 14 Response of LCPI to DLM2
-.005 -.004 -.003 -.002 -.001 .000 .001 .002 .003
2 4 6 8 10 12 14 Response of LCPI to DLCREDIT
-.010 -.005 .000 .005 .010 .015 .020 .025
2 4 6 8 10 12 14 Response of LGDP_SA to DLM2
-.010 -.005 .000 .005 .010 .015 .020 .025
2 4 6 8 10 12 14 Response of LGDP_SA to DLCREDIT
4.4. Exchange Rate Channel
The exchange rate channel is the most important transmission channel in small open economies with floating exchange rates. The nominal exchange rate shock impact on price significant but the impulse response function shows that the price first 2 month response negatively than between 3 to 10 months remains positively. The paradox situation can be explained by the huge exchange rate intervention by NBKR especially when the foreign currency (USA dollar) appreciates. In dollar appreciation NBKR sells the dollar for 2 months to smooth the price of dollar and that is why first two month response of price to nominal exchange rate is negative as shown in Figure 7.
Figure 7: Impulse response functions to exchange rate channel
Variance decomposition shows that both the money supply and inflation were important sources of shocks in nominal exchange rate. Money supply accounted for 13.08% of the shocks in nominal exchange rate, where the price level accounted for 3.9% of the shock while own shock accounted for 82.26% as shown in Table 7.
The exchange rate transmission policy can be used as a price stabilization policy.
The main reason of importance exchange rate channel in Kyrgyz Republic: 1) high level of dollarization which is officially shows 23% and unofficially counted up to70% (saving account in foreign currency/ M2X). 2) Flouting exchange rate
-.008 -.004 .000 .004 .008 .012 .016
2 4 6 8 10 12 14
Response of DLER to DLM2
-.008 -.004 .000 .004 .008 .012 .016
2 4 6 8 10 12 14
Response of DLER to DLER
-.008 -.006 -.004 -.002 .000 .002 .004
2 4 6 8 10 12 14
Response of LCPI to DLM2
-.008 -.006 -.004 -.002 .000 .002 .004
2 4 6 8 10 12 14
Response of LCPI to DLER
-.015 -.010 -.005 .000 .005 .010 .015 .020
2 4 6 8 10 12 14
Response of LGDP_SA to DLM2
-.015 -.010 -.005 .000 .005 .010 .015 .020
2 4 6 8 10 12 14
Response of LGDP_SA to DLER
regime. 3) Kyrgyz Republic is small open developing country which is highly dependent on imported products (more than 90% imported products to GDP).
Тable 7: Exchange Rate Variance Decomposition (%)
Variance Decomposition of DLER:
Period S.E. DLM2 DLER LCPI LGDP_SA
3 0.037602 13.15881 83.15405 3.088231 0.598904
6 0.037632 13.08316 82.28115 3.904297 0.731388
9 0.037633 13.08188 82.26951 3.915120 0.733492
12 0.037633 13.08191 82.26948 3.915114 0.733492
15 0.037633 13.08191 82.26948 3.915117 0.733492
Variance Decomposition of LCPI:
Period S.E. DLM2 DLER LCPI LGDP_SA
3 0.014108 1.874016 8.482542 89.62000 0.023447
6 0.014223 2.322076 9.650395 87.93312 0.094409
9 0.014224 2.331724 9.677311 87.88691 0.104057
12 0.014224 2.331725 9.677285 87.88662 0.104368
15 0.014224 2.331726 9.677287 87.88661 0.104373
Variance Decomposition of LGDP_SA:
Period S.E. DLM2 DLER LCPI LGDP_SA
3 0.013959 0.714337 0.231831 0.025884 99.02795
6 0.014118 0.832466 0.393013 0.027912 98.74661
9 0.014123 0.836902 0.401146 0.029913 98.73204
12 0.014123 0.836973 0.401271 0.030045 98.73171
15 0.014123 0.836973 0.401271 0.030048 98.73171
Cholesky Ordering: DLM2 DLER LCPI LGDP_SA
5. Conclusion
In order to provide monetary policy in efficient way, the central bank should possess a thorough understanding of the monetary transmission mechanism. Our VAR approach analysis has found that the impact of monetary policy to inflation and economic activity is weak. Despite NBKR has come a long way in developing the whole arsenal instruments of monetary policy is still limited. Due to undeveloped capital market and opaque corporate accounting we could not include the asset price channel and balance sheet channel into our analyses. However we found the exchange rate channel statistically significant impact on inflation and bank lending channels statistically significant impact on output while the interest rate channel remains insignificant. Moreover we found in basic model analysis that inflation and output did not respond to money supply.
capital inflow is driven by external financing and remittance money. Exchange rate channel efficient because of these reasons: high share of imports in GDP; economy of Kyrgyzstan highly dollarized and depends on remittance flows from abroad; high degree of dollarization. Bank lending channel needs to enforce and increase efficiency of impact to output by making discount loans, refinancing commercial banks and by increasing the bank reserves.
References
Bernanke, Ben and Alan S. Blinder; (1992), “The Federal Funds Rate and the Channels of Monetary Transmission”, American Economic Review, 82(4), pp. 901-921.
Bernanke, Ben and Mark Gertler; (1995), “Inside the Black Box: The Credit Channel of Monetary Policy Transmission”, The Journal of Economic Perspectives, 9(4), pp. 27-48.
Cavusoğlu, A. Tarkan; (2002), “Credit Transmission Mechanism in Turkey: An Empirical Investigation”, ERC Working Papers in Economics, 02/03.
Dabla-Norris, Era and Holger Floerkemeier; (2006), “Transmission Mechanisms of Monetary Policy in Armenia: Evidence from VAR Analysis”, IMF Working Paper, WP/06/248,
http://www.ccee.edu.uy/ensenian/catmetec/material/IMF%20Dabla-Norris%20Armenia%20wp06248.pdf, 16.09.2012.
Drobyshewski, Sergey M. i dr.; (2008), “Analiz transmissionnyh mehanizm ovdenejno-kreditnoy politiki v rossiyskoy ekonomike” (in Russian), Institute of Economic Policy, Scientific Researches No:116P, http://www.iep.ru/files/text/working_papers/116.pdf, 10.09.2012
Drobyshewski, Sergey i Kozlovskaya A.; (2002), “Vnutrenniye Aspekty denejno-kreditnoy politiki Rossii” (in Russian), İEPP No 45. http://ecsocman.hse.ru/text/19190351/, 10.09.2012
Engle, Robert F. and Clive W.J. Granger; (1987), “Co-integration and Error Correction: Representation, Estimation, and Testing”, Econometrica (55): 251-276.
Ganiyev, Cunus; (2008), “Kırgızistan’da Enflasyon Dinamikleri, 1998-2006”, KTMÜ Sosyal Bilimler Dergisi (20): 33-43.
Gunduz, Lokman; (2001), “Monetary Transmission Mechanism and Bank Lending in Turkey”, ISE Review 5(18): 13-31.
Hsing, Yu; (2004), “Responses of Argentine Output to Shocks to Monetary Policy, Fiscal Policy and Exchange Rates: A VAR Model”, Applied Econometrics and International Development, 4(1): 21-36.
Hung, Le Viet and Wade D. Pfau; (2008), “VAR Analysis of the Monetary Transmission Mechanism in Vietnam”, http://ssrn.com/abstract=1257854, 17.09.2012
Chow, Hwee Kwan; (2004), "A VAR Analysis of Singapore's Monetary Transmission
Mechanism". Research Collection School of Economics. Paper 792.
http://ink.library.smu.edu.sg/soe_research/792, 16.09.2012
Kakes, Jan; (1998), “Monetary Transmission and Bank Lending in the Netherlands”, Research
Report No. 98C30.
http://som.eldoc.ub.rug.nl/FILES/reports/1995-1999/themeC/1998/98C30/98c30.pdf, 09.09.2012.
Mishkin, Frederic S.; (1995), “Symposium on the Monetary Transmission Mechanism”, Journal of Economic Perspectives, 9 (4: 3-10.
Morsink, James and Tamim Bayoumi; (2001), “A Peak Inside the Black Box: The Monetary Transmission Mechanism in Japan”, IMF Staff Papers, 48(1), pp. 22-57.
Ornek, Ibrahim; (2009), “Türkiye’de Parasal Aktarım Mekanizması Kanallarının İşleyişi”, Maliye Dergisi (156): 104-125.
Seyrek, Ismail, Duman, Mehmet ve Murat Sarikaya; (2004), “Parasal Aktarım Mekanizması ve Para Politikası Aracı: Türkiye’de Aktarım Mekanizması”, Cumhuriyet Üniversitesi İktisadi ve İdari Bilimler Dergisi, 5 (1): 201-212.