Abstract:The rules that guide fiscal policy in many countries are often specified in terms of cyclically-adjusted measures of the budget deficit. Accounting for the cycle is important because public finances are flattered when the economy is cyclically strong. However measuring the cycle is difficult as the uncertainty surrounding estimates of potential output is significant, especially when the economy is hit by structural shocks. As a consequence, a fiscal framework targeting measures of cyclically-adjusted budget positions and point forecasts has led to spending and taxes being influenced by contentious forecasting assumptions. A more robust approach would take account of the unreliability of the cyclical adjustment or forecasts. A suggestion is to focus on risks around medium-term fiscal forecasts, supported by an independent watchdog. This would contribute to sustainable policy, while avoiding excess sensitivity to forecasts.
I INTRODUCTION
T
he rules that guide fiscal policy in many countries are often specified in terms of cyclically-adjusted measures of the budget deficit. For example, in his post-2017 election autumn budget, the UK Chancellor of the Exchequer confirmed that the government was committed to “reducing the cyclically-adjusted deficit to below 2 per cent of GDP by 2020-2021”.1 Similarly, the Stability and Growth Pact of the103
Measuring the Cycle and Structural Shocks
Marta Lopresto *
National Institute of Economic and Social Research, UK
Garry Young
National Institute of Economic and Social Research, UK
Acknowledgements: We are grateful to participants at the IFAC ‘Path for the Public Finances’ conference and an anonymous referee for comments on an earlier draft of this paper. The authors are solely responsible for the content and the views expressed.
European Union emphasises the structural balance defined as the cyclically-adjusted balance net of one-off and temporary measures (Sherwood, 2015).
Accounting for the cycle is important because public finances are flattered when the economy is cyclically strong and it is sensible for the deficit to fluctuate over the cycle: in an expansion the budget could accumulate revenues to offset higher deficits in a contraction, thereby maintaining unchanged the overall structural budget balance. Measuring the cycle is useful in principle as it allows the sources of output growth to be decomposed into a sustainable trend and cyclical fluctuations. However, in practice, the uncertainty surrounding estimates of potential output is significant, especially when the economy is hit by structural shocks.
This has led to calls for changes to the Stability and Growth Pact to recognise the uncertainty around estimates of potential output. As an example, Pisani-Ferry (2015) asserts that “the focus of policy discussions should not be the latest potential GDP revision, but whether a country is on track to ensure public finance sustainability”.
Widespread dissatisfaction with mechanical methods of cyclical adjustment has led many fiscal authorities to downgrade cyclically-adjusted budget deficits as targets of policy. Instead there is now more focus on forward-looking assessments of fiscal trends, based on economic forecasts. To enhance the credibility of these forecasts and fiscal assessments, their preparation has in many cases been delegated to independent bodies such as the UK Office for Budget Responsibility (OBR) and the Irish Fiscal Advisory Council (IFAC). While this is an undoubted improvement it is not possible to avoid the fact that economic developments are uncertain and forecasts subject to revision. As a consequence, there are several cases where the expenditure and taxation decisions that affect the lives of many people have been changed because of seemingly arbitrary changes in forecasting assumptions.
We therefore propose that the uncertainty around economic forecasts is taken more explicitly into account when formulating fiscal policy. The aim is to avoid short-term adjustments to policy as the economic outlook changes. The purpose of the fiscal framework that many countries operate is to lengthen the time horizon of policy and, at the same time, make decision-makers more aware of the debt-sustainability challenges that they face. We believe that taking uncertainty more explicitly into account will help achieve this aim. On the same principle, Besley and Scott (2010) state: “governments must be allowed to build into their fiscal plans contingencies that enable them to use public finance as a buffer in the face of unexpected shocks”.
II APPROACHES TO MEASURING THE CYCLE
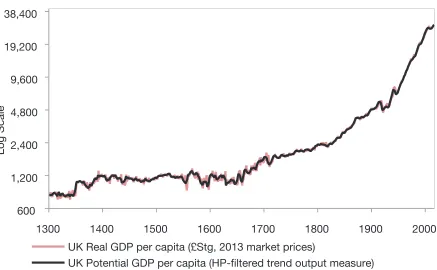
Potential output is defined as the level of output that an economy can sustainably produce using its full capacity, but without causing inflation to rise. The output gap measures the difference between actual GDP and potential, expressed as a percentage of potential output. There are many difficulties in measuring potential output, not least because it is unobservable and can only be proxied by imperfect estimates. And it is unlikely to develop in a smooth trend-like manner. Instead it varies substantially over time because of structural shocks, reflecting changes in the rate of labour augmenting technical progress and the growth rate of the labour force; Figure 1 illustrates the extent of the variation in the level and growth rate of actual and potential output in the United Kingdom over the past 800 years.
Figure 1: Real and Potential GDP Per Capita in the UK
Source: Bank of England, A millennium of macroeconomic data for the UK.
There are a number of approaches that can be used to estimate output gaps, such as statistical filters, cyclical indicators and a production function approach.
2.1 Statistical Filters
Univariate filters, such as the Hodrick-Prescott (HP) filter, produce a series for trend output based on the observed path of actual output alone. The HP filter removes business cycle fluctuations in a time series and extracts the long-term trend.
1300 1400 1500 1600 1700 1800 1900 2000
600 1,200 2,400 4,800 9,600 19,200 38,400
UK Real GDP per capita (£Stg, 2013 market prices)
UK Potential GDP per capita (HP-filtered trend output measure)
According to a specified smoothing parameter, it minimises cyclical fluctuations as well as changes in the growth rate of the trend component (Koske and Pain, 2008).
Estimates using this method are best thought of as “trend”, rather than potential, growth, since these filters do not incorporate any economic structure and represent a purely statistical approach to approximating potential output (Casey, 2018). Also, they can be overly influenced by recent movements in actual output, the so-called “end-point problem”, and are generally revised substantially as new output data become available. Because they are simply statistical tools to smooth the actual GDP series, they can be misleading across structural breaks, as the HP filter would typically moderate a break when it occurs and spread its effect forwards and backwards over several years, depending on the value of l. These caveats have led some researchers to define HP-filtered trend output measures as “worse than useless” (Christiano and Fitzgerald, 2003).
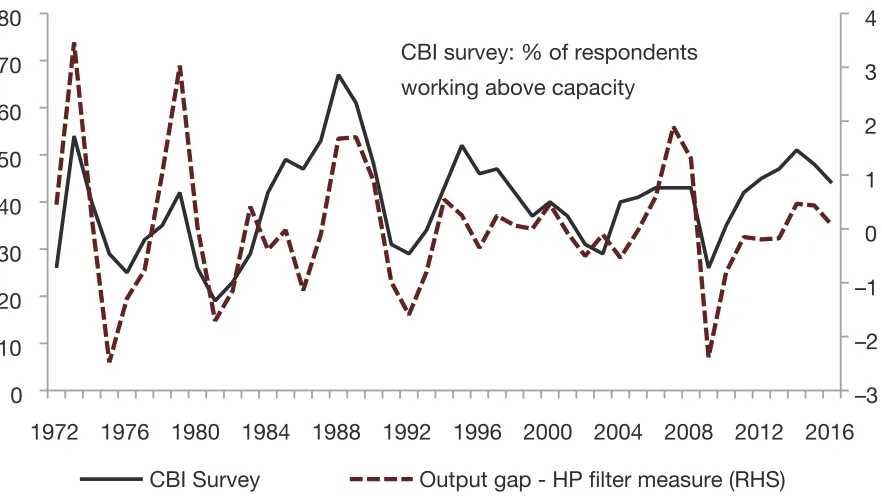
Figure 2: CBI Survey and HP Filter
Sources: CBI survey and NiGEM database.
Blagrave et al. (2015) derive estimates of the output gap using the Phillips curve and Okun’s law (see Casey, 2018, for more details). But they note these multivariate filters are the “least bad” among a host of mediocre choices and go on to argue that there is “no panacea” to the problem of estimating potential output.
2.2 Cyclical Indicators
Cyclical indicatorsattempt to measure the state of the cycle directly from measures such as business surveys, recruitment difficulties and others. Prior information on
1972 1976 1980 1984 1988 1992 1996 2000 2004 2008 2012 2016 0
10 20 30 40 50 60 70 80
–3 –2 –1 0 1 2 3 4
CBI Survey Output gap - HP filter measure (RHS) CBI survey: % of respondents
sectoral shares or statistical techniques may be used to derive weights for each of the indicators in order to produce an overall measure of the output gap.
However, there are issues with these indicators too as they generally tend to over-weight sectors where measurement is easy, such as the manufacturing sector in the UK. Furthermore, it is not obvious how to weight different indicators to produce the overall estimate (Casey, 2018).
2.3 Production Functions
Macroeconomic models, such as the National Institute Global Econometric Model (NiGEM), often include measures of potential output. For example, NiGEM uses a production function approach to estimate potential output:
1 a
Y = g
5
[s(K)–r + (1 – s)(Lelt)–r]– –r6
M1–a (1)where K is the net capital stock, L is trend employment, M is material inputs and l is labour augmenting technical progress.
This structural approach has several advantages. In particular, it allows an examination of the underlying economic factors which are driving any observed changes in the potential output indicator and establishes a meaningful link between policy reform measures with actual outcomes. Also, production function methods allow making forecasts and/or building scenarios of potential output growth by making explicit assumptions on the future evolution of demographic, institutional and technological trends.
However, this approach also has drawbacks as it relies on assumptions on the functional form of the production technology, returns to scale, TFP and the representative utilisation of production factors.
III IMPACT OF SHOCKS ON ESTIMATES OF THE OUTPUT GAP
In the presence of mainly demand-side shocks, measures of the output gap should perform quite well, as potential output ought to grow at a fairly constant rate while actual output is subject to fluctuations driven by demand shocks.
3.1 Stop-Go Cycle (1950-1973)
of shocks to supply and the output gap was simply calculated as the deviation of the actual output from it.
Figure 3: “Stop-Go” Period in the UK
Source: Dow (1998) from Economic Trends.
Output gap measures are helpful if demand shocks predominate and the supply side is stable and predictable. However, it becomes harder to measure potential output in the presence of structural shocks. An example of supply-side shocks is the disappointing productivity growth in most advanced countries over the past decade or so.
3.2 Productivity Shock
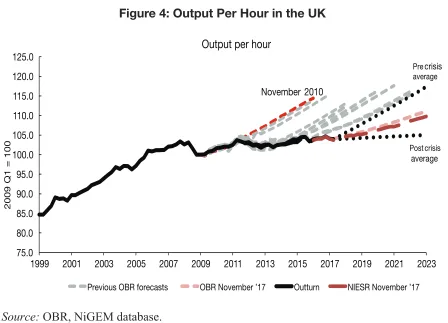
Productivity growth after the financial crisis has deteriorated significantly in stark contrast with the good performance of the labour market where employment has grown strongly. That is particularly the case in the UK (Figure 4).
on investment in new capital. At the same time over the last decade, bank forbearance led to an increasing survival of “zombie firms”, such as unproductive firms that would generally be crowded out in a competitive market.
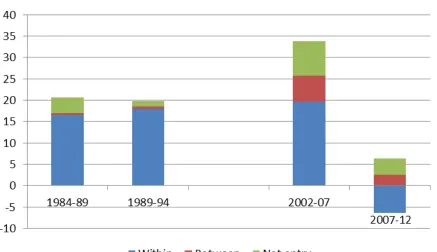
Consistent with demand weakness, firm-level evidence indicates that the productivity weakness has been generated “within-sector” rather than “between-sectors” (see Riley et al., 2015). Figure 5 illustrates the decomposition of five-year changes in labour productivity and shows that the drop in productivity growth since the recent crisis is mainly due to the within-firm productivity weakness in the UK.
3.3 Hysteresis
Estimating potential output is again problematic when demand and supply shocks are related. The high rates of unemployment that have been observed since the financial crisis in many advanced countries have failed to recover to pre-crisis levels even though output has recovered in several cases. The demand-side shock of lower output turned demand-deficient unemployment – where firms lay off workers as demand for production is temporarily lower – into structural unemployment, determining a supply-side shock. That is because workers that have lost their jobs during the crisis when the cycle turns are not competitive as they have been unemployed for too long, or because their skillset becomes outdated. Therefore, the level of potential output shifts due to a shock to actual output.
Figure 4: Output Per Hour in the UK
Source: OBR, NiGEM database. 75.0
80.0 85.0 90.0 95.0 100.0 105.0 110.0 115.0 120.0 125.0
1999 2001 2003 2005 2007 2009 2011 2013 2015 2017 2019 2021 2023
2009 Q1 = 100
Previous OBR forecasts OBR November ’17 Outturn NIESR November ’17
Post crisis average
Pre crisis
average
November 2010
IV FISCAL SUSTAINABILITY
Cyclical adjustment of budget deficits will, it is hoped, ensure that negative cyclical components in recessions and positive cyclical components in booms largely balance each other out, and thus debt caused by cyclical components does not accumulate systematically over time. However, the unreliability of estimating potential output and therefore the output gap, in particular in presence of supply-side shocks, consupply-siderably complicates the fiscal policy process. Chadha et al. (2018) show that changes to the expected path of GDP growth are the key factors in explaining revisions to public expenditure plans in the United Kingdom.
4.1 Euro Area Fiscal Mandate
The Stability and Growth Pact (SGP) was adopted in 1997 as a measure of fiscal surveillance applying to the whole European Union without exception. The preventive arm was reformed in 2005 to allow countries more flexibility and replacing the headline deficit target with a structural measure, subtracting the cycle and one-off measures. It incorporates a benchmark path towards the achievement of the Medium Term Objective (MTO) of an annual adjustment of 0.5 per cent of GDP set in structural terms, with more adjustment expected when the economic cycle is strong, and less otherwise (Sherwood, 2015).
Figure 5: Decomposition of Five-Year Changes in Labour Productivity (%) Across Recessions in the UK
In 2011, a new set of rules, the so-called “Six-Pack” entered into force. Under these new rules, financial sanctions can be imposed in the case of repeated non-compliance by Euro Area Member States. The new rules also define an “expenditure benchmark” to help assess progress towards the MTOs. Under the expenditure benchmark, spending increases which go beyond a country’s medium-term potential economic growth rate must be matched by additional revenue measures (European Commission, 2011).
The uncertainty around the estimates of the output gap, which was being persistently underestimated in many countries prior to the crisis, may have contributed to the post-crisis fiscal debt deterioration, as public debt has risen to unprecedented peacetime levels and in some countries it is still growing. What was believed to be prudent fiscal policy before the crisis was revealed not to be the case as the debt deteriorated. The pre-crisis financial booms had made the fiscal accounts look stronger than they actually were as the size of the output gap was often being underestimated.
4.2 UK Fiscal Mandate
The UK also expresses the budget target in structural terms. Currently, the government’s fiscal target is for the cyclically-adjusted net borrowing to lie below 2 per cent of GDP in 2020-2021.
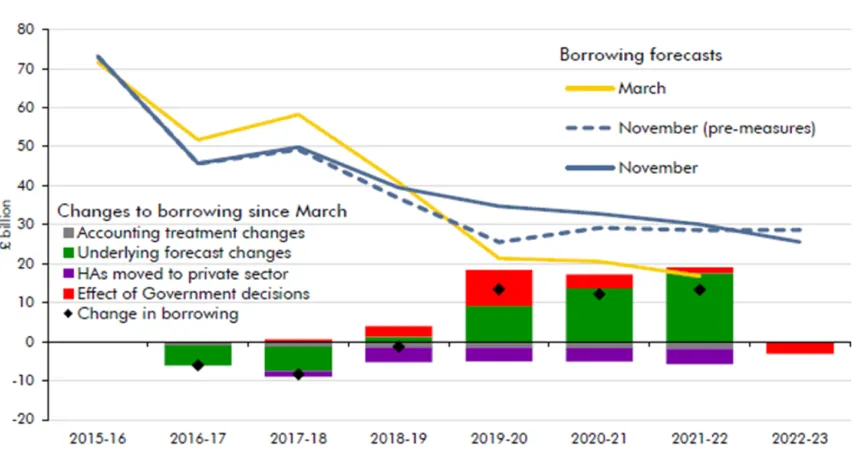
In the Autumn Statement of November 2017, the independent OBR revised down its projections of net borrowing for 2017/2018, while they revised considerably higher those for the medium term. The forecast of a worse fiscal position in the medium term is mostly due to the OBR’s downward revision of future productivity growth. Figure 6 shows different factors changing the borrowing forecasts. It shows that the forecast change is driven mostly by the “underlying forecast changes”, such as changes to the productivity outlook.
This revision took away a lot of the Chancellor’s room to relax austerity. Changes to estimates of potential output can force policy to respond immediately to meet deficit targets, which raises questions about how fiscal policy is set.
between £12 billion and £15 billion by including years of relatively low spending and high tax revenues in the calculation. This led to accusations that the Chancellor of the Exchequer was “fiddling the rules” and “acting as referee in the game he’s playing” (Daily Telegraph, 20 July 2005).
Clearly, it is up to democratically elected governments to set their own fiscal rules, but the credibility of these rules is undermined by the perception that they can be manipulated in the governments’ interests. NIESR’s view at the time (Weale, 2005) was that events between 1997 and 1999 did not have much practical bearing on the soundness of fiscal policy in 2005 and recommended that the “Golden Rule” of maintaining the current budget in balance or surplus should be replaced by an independent expert assessment of whether the current budget is expected to be in balance or surplus in the medium term.
It is for this type of reason that independent fiscal councils have proliferated in recent years with the mandate to provide an independent assessment of official budgetary forecasts and proposed fiscal policy objectives. For example, in the UK the OBR is responsible for economic and fiscal forecasting, evaluating performance against targets, sustainability and balance sheet analysis, evaluation of fiscal risks, scrutiny of costings. In Ireland, IFAC provides an independent assessment of official budgetary forecasts and proposed fiscal policy objectives.
However, even in the presence of an independent body monitoring budgetary forecasts and objectives, using output gaps as a benchmark for assessing fiscal policy sensibility is still problematic.
Portes and Wren-Lewis (2014) argue that “the key point is that targets for the deficit just one or two years ahead are foolish things to have, and cyclically
Figure 6: Changes to Borrowing Forecasts
correcting the target only makes them slightly less foolish.” They hold the view that deficits should be allowed to absorb shocks rather than spending or taxes and that the government should target cyclically-unadjusted deficits five years ahead, held to account by an independent and robust fiscal council. However, it is not clear that five-year-ahead point forecasts are a better guide as borrowing forecasts are often revised substantially (Figure 7).
Figure 7: Historic Forecasts of Government Budget Balance (% GDP)
Source: NiGEM database and successive vintages of NIESR forecasts.
V ALTERNATIVES TO CYCLICAL ADJUSTMENT
Due to the prevalence of structural shocks, it is unlikely that the sensitivity of deficit forecasts to new developments can be easily remedied and therefore it is important to develop an alternative policy framework that is robust to the uncertainty about cycle. The monetary policy framework, subject to similar pressures, is less dependent on a single forecast. When central banks have operational independence, clear forward-looking targets, transparency and accountability, they also have room to respond flexibly to new developments. As long as the long-term risks to the inflation target are contained, monetary policymakers can have discretion as to how quickly they bring inflation back to target depending on the trade-off between inflation and the output gap.
1978 1980 1982 1984 1986 1988 1990 1992 1994 1996 1998 2000 2002 2004 2006 2008 2010 2012 2014 2016 2018 2020 2022
-15 -12 -9 -6 -3 0 3 6 UK
% of GDP
1980 1982 1984 1986 1988 1990 1992 1994 1996 1998 2000 2002 2004 2006 2008 2010 2012 2014 2016 2018 2020 2022
-8 -6 -4 -2 0 2 Germany
% of GDP
1978 1980 1982 1984 1986 1988 1990 1992 1994 1996 1998 2000 2002 2004 2006 2008 2010 2012 2014 2016 2018 2020 2022
-60 -50 -40 -30 -20 -10 0 10 Ireland
% of GDP
1980 1982 1984 1986 1988 1990 1992 1994 1996 1998 2000 2002 2004 2006 2008 2010 2012 2014 2016 2018 2020 2022
-18 -16 -14 -12 -10 -8 -6 -4 -2 0 2 4 US
% of GDP
A similar approach can be applied to fiscal policy by providing short-term discretion within a clear long-term framework. According to the IMF, desirable properties of fiscal rules are “simplicity, flexibility and enforceability” (Eyraud et al., 2018). In line with these properties, we propose a risk-based framework as a basis for discretionary fiscal policy. The suggestion is to have targets that focus on the risks around the government’s balance sheet or other suitable target, and adjust policy according to changes in risks as validated by an independent fiscal authority. Accordingly, a rule could be that fiscal action is required if the probability of the budget deficit in any given future year being greater than 4 per cent of GDP is higher than 20 per cent. Much as in the monetary policy context, in this framework governments have discretion about how quickly their long-term fiscal goals are achieved, as judged by an independent fiscal authority.
As an example the fan charts in Figure 8, generated from the National Institute’s Global Econometric Model (NiGEM), show estimates of the range of possible values around the central forecast of the government’s surplus and the probabilities
Figure 8: Risk Around Forecasts of Government Budget Balance (% GDP)
Source: NiGEM database and NIESR forecasts.
Notes: The fan chart is intended to represent the uncertainty around the central forecast shown by the central line. There is a 90 per cent chance that GDP growth in any particular year will lie within the upper and lower lines of the chart. There is a 10 per cent chance that GDP growth will lie outside the upper and lower lines of the chart.
-6 -5 -4 -3 -2 -1 0 1 2
2015 2016 2017 2018 2019 2020 2021 2022
-5 -4 -3 -2 -1 0 1 2 3
2015 2016 2017 2018 2019 2020 2021 2022
Ireland Government Budget Balance - Base UK Government Budget Balance - Base
-5 -4 -3 -2 -1 0
2015 2016 2017 2018 2019 2020 2021 2022
France Government Budget Balance - Base
-5 -4 -3 -2 -1 0 1 2
2015 2016 2017 2018 2019 2020 2021 2022
attached to those for Germany, Ireland, UK and US.2 According to this method,
using the projections from the February 2018 National Institute Economic Review
(NIER) as a baseline, the risks around the sustainability of the budget balance in the US are becoming substantial. In fact, the probability that the deficit is above 4 per cent of GDP over the next two years is around 60 per cent (Figure 8) which would suggest that action is needed to consolidate the fiscal position. On the other hand, the probability of the UK and Ireland budget deficits exceeding 4 per cent of GDP stands in both scenarios at around 5 per cent. Similarly, in Germany, with the budget currently in surplus, the probability of the deficit being greater than 2 per cent of GDP over the next four years is negligible. Based on its current and projected budget balance and public debt, Germany should arguably take measures to increase public spending, being one of the few countries in the Euro Area with fiscal space, as discussed in the August 2018 NIER (Figure 9).
2 See Barrell et al. (2003) and McCarthy (1972) for details on how the fan charts are created. Figure 9: 2017 Budget Balance (% GDP) and Debt-to-GDP ratio
Sources: NIER (August 2018), European Central Bank database.
Key: OE Austria; BG Belgium; CY Cyprus; ES Estonia; EA Euro Area; FN Finland; FR France; GE Germany; GR Greece; IR Ireland; IT Italy; LV Latvia; LI Lithuania; LU Luxembourg; MT Malta; NL Netherlands; PT Portugal; SR Slovakia; SL Slovenia; SP Spain.
BG
FN FR
GE IR
IT
NL OE
PT SP
GR
ES
LI LV
SL
SR
CY
LU
-4.0 -2.0-2.0 0.00.0 2.02.0 0
30 60 90 120 150
180 Debt
Of course, the deficit is only one metric of the government’s fiscal position. Greece currently has a budget balance in surplus, but its public debt is around 180 per cent of GDP, which is three times the debt limit imposed by the Maastricht Treaty. Therefore, the size of the public debt as a percentage of GDP and the risks around its path are also sensible benchmarks for setting fiscal policy.
VI CONCLUSION
Cyclical adjustment is important but is unreliable in face of structural shocks. This highlights the need to design a fiscal policy framework that is robust to uncertainty and to avoid important fiscal decisions being driven by arbitrary forecasting changes. A framework of targeting measures of cyclically-adjusted budget positions and point forecasts has led to spending and taxes being too sensitive to technical adjustments. A more robust approach would take the unreliability of the cyclical adjustment or forecasts into account. Instead of relying only on the central scenario, a suggestion is to focus on risks around medium-term fiscal forecasts, supported by an independent watchdog. In view of the IMF guides for good fiscal rules (“simplicity, flexibility, and enforceability”), this risk-based framework represents a simple operational rule guiding fiscal policy in the short term, to incorporate into a context of a debt anchor establishing a medium-term objective. It allows for flexibility in the sense that this model responds to changing circumstances and varying degrees of uncertainty, and it is enforceable if the underlying analysis of the risks is done by an independent body. While we have proposed an example of how this might work in practice, more work is needed to come up with robust rules to make this suggestion practical.
REFERENCES
Barrell, R., K. Dury and I. Hurst, 2003. “International Monetary Policy Coordination: An Evaluation of Cooperative Strategies Using Large Econometric Model”, Economic Modelling, Vol. 20, No. 3, pp. 507-527.
Besley, T. and A. Scott, 2010. “A New Watchdog Would Guard Us from Debt”, VOX CEPR Policy Portal. Available at: https://voxeu.org/article/time-independent-fiscal-policy-committees. Blagrave, P., R. Garcia-Saltos, D. Laxton and F. Zhang, 2015. “A Simple Multivariate Filter for
Estimating Potential Output”, IMF working paper, Washington, DC: International Monetary Fund.
Casey, E., 2018. “Inside the ‘Upside Down’: Estimating Ireland’s Output Gap”, Irish Fiscal Advisory Council.
Chadha, J. S., A. Hantzsche, T. Lazarowicz, A. Pabst and G. Young, 2018. “Understanding and Confronting Uncertainty: Revisions to UK Government Expenditure Plans”, National Institute of Economic and Social Research.
Christiano, L. J. and T. J. Fitzgerald, 2003. “The Band Pass Filter”, International Economic Review,
Dow, C., 1998. Major Recessions. Britain and the World, 1920-1995, Oxford University Press. European Commission, 2011. “EU Economic Governance ‘Six-Pack’ Enters into Force”, MEMO/
11/898.
Eyraud, L, X. Debrun, A. Hodge, V. Lledó and C. Pattillo, 2018. “Second-Generation Fiscal Rules: Balancing Simplicity, Flexibility, and Enforceability”, IMF Staff Discussion Note SDN/18/04, International Monetary Fund, Washington, DC.
HM Treasury, 2017. Autumn Budget 2017 (22 November 2017). Available at: https://www.gov.uk/ government/publications/autumn-budget-2017-documents/autumn-budget-2017.
Koske, I. and N. Pain, 2008. “The Usefulness of Output Gaps for Policy Analysis”, OECD Economics Department Working Papers, No. 621, Paris: OECD Publishing.
Lopresto M., 2018. “Intra-Euro Area Spillovers – Simulating the Effect of Fiscal Stimulus”,
National Institute Economic Review, August 2018 (Box B, page F48). Available at: https://www.niesr.ac.uk/publications/intra-euro-area-spillovers-%E2%80%93-simulating-effects-fiscal-stimulus.
McCarthy, M., 1972. “Some Notes on the Generation of Pseudo-structural Errors for Use in Stochastic Simulation Studies” in Hickman, B.G. (Ed.), Econometric Models of Cyclical Behaviour, New York: Columbia University Press, pp. 185-191.
Pisani-Ferry, J., 2015. “Why Europe Needs to Change its Fiscal Pact”, World Economic Forum. Portes, J. and S. Wren-Lewis, 2014. “Issues in the Design of Fiscal Policy Rules”, Department of
Economics, University of Oxford.
Riley, R., C. Rosazza-Bondibene and G. Young, 2015. “The UK productivity puzzle 2008-2013: Evidence from British Businesses”, Bank of England SWP No. 531.
Sherwood, M., 2015. Medium-Term Budgetary Frameworks in the EU Member States”, European Commission Discussion Paper 021.