Remote Sensing and GIS for Hydrology and Water Resources (IAHS Publ. 368, 2015) (Proceedings RSHS14 and ICGRHWE14, Guangzhou, China, August 2014). 120
Temporal and spatial variations of precipitation in the Jinsha
River basin during 1961–2010
XIAOFAN ZENG
1,2, NA ZHAO
2, HUAIWEI SUN
2, LEI YE
2& JIANQING ZHAI
31State Key Laboratory of Simulation and Regulation of Water Cycle in River Basin, Institute of Water Resources of Hydropower Research, Beijing 100038, China
[email protected]; [email protected]
2School of Hydropower & Information Engineering, Huazhong University of Science and Technology, Wuhan 430074, China
3National Climate Center, China Meteorological Administration, Beijing 100081, China
Abstract Knowing the variations of precipitation at the basin scale is very important to study the impacts of climate change on water resources and hydrological processes. To achieve the temporal and spatial variations of precipitation on long time scales and some extreme indicators in the Jinsha River basin, some typical precipitation indices were analysed based on daily precipitation data for 1961–2010 for the research area. The results showed that AP had a certain increasing tendency without passing the significance test, while AP in the lower reach of the basin decreased slightly. PFS had no obvious changes, while MP through a year (except rainfall in September and December) had a slight increasing tendency. In addition, AP and PFS showed obvious spatial differences, and the higher rainfall area was located in the lower basin especially in the Hengduan Mountain area. LRD and MRD increased slightly in the upper and middle regions, while they decreased slightly in the lower basin. HRD increased over most of the whole basin, but it had a decreasing tendency in the headwater region and around Dege station but did not pass the significance test. DD and CDD in one year showed similar spatial change patterns and had an obvious decreasing tendency in the upper and middle basin, while they had an obvious increasing tendency in the lower basin. CWD almost decreased over the whole basin, and decreased significantly in a small part of the lower basin. The temporal changes of the typical precipitation indices may confirm the possible increasing tendency for occurrence of drier climate and even drought events in the downstream of Jinsha River basin.
Key words precipitation indices; temporal and spatial variations; Jinsha River basin
1 INTRODUCTION
Global climate warming has significant impacts on the hydrological cycle and water resources in China. With the development of the population and the social economy, the frequent floods and droughts, the contradiction of water resources supply and demand are becoming important factors restricting the development of the national economy (Kirshen et al., 2005; Wang et al., 2012).
The Jinsha River basin is the largest hydropower base in China and is the main hydropower source of the national “Transporting Western Power Eastward” project. The Jinsha River basin is located in the upper reaches of the Yangtze River basin. In the recent several decades, the Yangtze River basin has experienced frequent floods and droughts, and the possibility of floods in summer and droughts in autumn have shown an increasing tendency (Su et al., 2004; Jiang et al., 2007). Additionally, the precipitation extremes in the Jinsha River basin have increased significantly. The rainfall peak in the Jinsha River basin has advanced from July to June, which would increase the probability of floods in the Yangtze River basin flood due to the almost simultaneous peaks (Su et al., 2005).
The temporal and spatial changes of precipitation will cause changes of the hydrological processes in the Jinsha River basin, and have big impacts on utilization of water resources and hydropower (Kirshen et al., 2005). Analysis of the variations of precipitation in the Jinsha River basin, is very important for understanding the impacts of climate change on runoff and sediment yield, and can provide supportive information for integrated utilization of water resources (Du et al., 2013). Song et al. (2012) and Wang et al. (2013) studied the trends of seasonal and annual precipitation in the Jinsha River basin, while this paper focuses on the temporal and spatial changes of precipitation during 1961–2010 by applying some typical precipitation indices, to assess not only precipitation changes on longer time scales but also some extreme indicators.
2 STUDY AREA
The basin has many types of climate patterns, including a monsoon climate, a typical plateau climate and the Hengduan Mountains vertical climate. The Jinsha River basin drains an area of 4.7 × 10⁵ km2, and the stream length of the Jinsha River is approximately 2316 km.
Daily precipitation observations from 1 January 1961 to 31 December 2010 at 32 national meteorological stations (Fig. 1) in the Jinsha River basin and adjacent area are used in this study. The datasets of all stations are homogeneous with high significance. Areal rainfall was estimated by applying the Theissen polygon method to the station precipitation data.
Fig. 1 Location of Jinsha River basin and the meteorological stations.
3 METHODOLOGY
3.1 Typical precipitation indices
To analyse the precipitation variations in the Jinsha River basin, some typical precipitation indices were used (Table 1). The first type is used to analyse the precipitation changes on longer time scales. The second type is used to test the tendencies of precipitation at different levels and its proportion in a year. The third type is used to analyse the precipitation concentration degree in a year, and the successive no rainy days can represent the drought condition in the basin.
Table 1 Typical precipitation indices used in the research
Type Descriptive name Abbr. Definition Unit
Precipitation
means Annual precipitation Precipitation in flood season AP PFS Annual total precipitation Total precipitation from June to October mm mm Monthly precipitation MP Monthly total precipitation mm Rainy days
at different levels
Light rainy days LRD Days on daily precipitation < 10 mm days Moderate rainy days MRD Days on daily precipitation ≥ 10 mm and <
25 mm days
Heavy and heavier rainy days HRD Days on daily precipitation ≥ 25 mm days Other rainy
days Dry days Consecutive dry days DD CDD Maximum number of consecutive dry days days Number of dry days days Consecutive wet days CWD Maximum number of consecutive wet days days
3.2 The Mann-Kendall Method
In order to show the spatial characteristics of the precipitation indices, the Inverse Distance Weighting method (abbr. as IDW; Robinson and Metternicht 2006) was chosen to interpolate the M-K values at 32 meteorological stations.
3.3 The Empirical Orthogonal Function
To assess the spatial change patterns of different precipitation indices in the Jinsha River basin, the Empirical Orthogonal Function (abbr. as EOF) was applied to get the main spatial oscillation patterns of typical indices. The EOF can decompose the time dependent variable into two parts, a spatial component and a temporal component, which is beneficial for information concentration and reflects the main spatial pattern of meteorological factors (Zeng et al., 2008).
4 CHANGES OF MEAN PRECIPITATION 4.1 AP– Annual precipitation
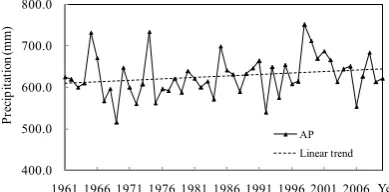
By applying the M-K test to AP during 1961–2010 in the Jinsha River basin, the M-K value was 1.85, which shows that AP increased in recent years but not significantly (Fig. 2).
According to the spatial interpolation of M-K values at 32 meteorological stations, most of the basin had an increasing tendency for AP; only a small part of the lower basin showed a slight decreasing tendency (Fig. 3(a)). Based on the EOF analysis of AP, the variance contribution of the first principal component reached 97.9%. It could be considered that the spatial pattern reflected by the first principle component basically represented the most important spatial distribution characteristics (Fig. 3(b)). AP showed obvious regional variations, and the high positive values were located in the lower basin, especially in the Hengduan Mountains due to the impacts of monsoon climate.
400.0 500.0 600.0 700.0 800.0
1961 1966 1971 1976 1981 1986 1991 1996 2001 2006
Pr
eci
pi
tat
io
n (
m
m
)
Year
AP Linear trend
Fig. 2 Changes of AP during 1961–2010 in the Jinsha River basin.
Fig. 3 Spatial changes of AP during 1961–2010 in the Jinsha River basin: (a) M-K statistics (b) EOF.
4.2 PFS – June–October precipitation
400.0 500.0 600.0 700.0
1961 1966 1971 1976 1981 1986 1991 1996 2001 2006
Pr
eci
pi
tat
io
n (
m
m
)
Year
PFS Linear trend
Fig. 4 Changes of PFS during 1961–2010 in the Jinsha River basin.
Fig. 5 Spatial changes of PFS during 1961–2010 in the Jinsha River basin: (a) M-K statistics, (b) EOF.
The spatial interpolation of M-K values showed that PFS increased slightly in the source and the middle basin, while the area around Yushu and Dege stations and the lower basin had a slight decreasing tendency (Fig. 5(a)). By applying the EOF analysis for PFS, the variance contribution of the first principal component reached 97.6%, and PFS had more obvious local variations than AP. The high positive values were located in the Hengduan Mountain (Fig. 5(b)).
4.3 MP – Monthly precipitation
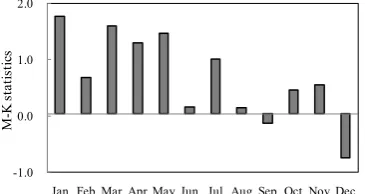
According to the M-K analysis for MP (from January to December) in the Jinsha River basin, all MP, except precipitation in September and December, and showed increasing tendency without passing the significance test. Among them, MP from January to May had a more obvious tendency, and MP in flood season, except in July when there were no obvious changes (Fig. 6).
-1.0 0.0 1.0 2.0
Jan Feb Mar Apr May Jun Jul Aug Sep Oct Nov Dec
M
-K
sta
tis
tic
s
Fig. 6 M-K statistics of MP during 1961-2010 in the Jinsha River basin.
5 CHANGES OF TYPICAL RAINY DAYS 5.1 Numbers of rainy days at different levels
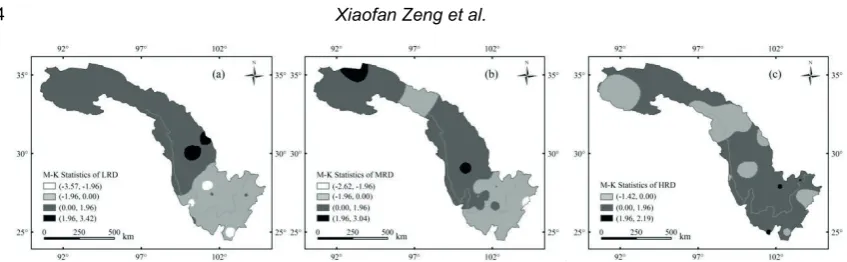
Fig. 7 Spatial changes of M-K statistics of rainy days during 1961–2010: (a) LRD, (b) MRD, (c) HRD.
HRD increased slightly over most of the area, and only decreased slightly in the source of the basin and the area around Dege station (Fig. 7(c)).
The decadal changes of numbers of rainy days at different levels are shown in Table 2. For LRD, for example, the values in Table 2 were estimated by first counting the sum of LRD at all 32 meteorological stations in one year, and secondly aggregating the number for each year in one decade, and then averaging it as an annual value. The same procedure was repeated for MRD and HRD. From 1961 to 2010, LRD and MRD decreased while HRD did not change obviously. The decadal change of LRD was more obvious among all the rainy days, especially in 1970s and 2000s. Since AP showed a certain increasing tendency, it could be inferred that precipitation intensity tended to get bigger due to the decreases of the rainy days.
Table 2 Decadal changes of rainy days at different levels.
Indices 1960s 1970s 1980s 1990s 2000s
LRD 3743 3931 3667 3656 3498
MRD 591 578 582 604 564
HRD 165 152 162 177 174
5.2 Other typical rainy days
Changes of DD, CDD and CWD were also analysed. The results showed that DD decreased in the upper and middle basin and increased in the lower basin. In the area around Zhaojue, Zhaotong and Huize stations along the downstream, the increasing tendency was very obvious and passed the significance test at 95% confidence level (Fig. 8(a)). CDD had a similar tendency to DD, but its increasing tendency in the middle and lower basin did not pass the significance test (Fig. 8(b)). CWD decreased over the whole basin, especially in some parts of the lower basin (Fig. 8(c)).
Wang et al. (2005) analysed the climate change from 1961 to 2000 in the upper Yangtze River basin and found that the warming area was mostly located in the source of the basin and the Jinsha River basin. Li et al. (2010) found that the temperature in the Hengduan Mountains increased obviously since the 1990s, and especially after 2000. The increase of the temperature might strengthen the droughts in the basin, which was consistent with the increase of DD.
6 CONCLUSIONS
For the Jinsha River basin, the biggest hydropower base in China, daily precipitation observations from 1961 to 2010 at 32 meteorological stations in the basin and adjacent area were used to analyse the temporal and spatial changes of precipitation.
During 1961–2010, overall AP showed an increasing tendency without passing the significance test, although in a small part of the downstream AP decreased slightly. PFS showed no obvious changes. MP basically showed a certain increasing tendency except it in September and December. Although not significant at 95%, LRD and MRD increased in the upper and middle basin, and decreased in the lower basin. HRD increased slightly over the whole basin. DD and CDD had similar spatial change characteristics, but the increasing range of DD was bigger and passed the significance test at the 95% confidence level. CWD decreased over the whole basin, especially in the downstream. The changes of the three types of indices showed that the possibility of the occurrence of drier climate and even drought events tended to increase, while the extreme and strong precipitation events showed a decreasing tendency.
Acknowledgements This work was supported by the National Natural Science Foundation of China (No. 51309105), and the Open Research Foundation of State Key Laboratory of Simulation and Regulation of Water Cycle in River Basin, China (Nos 201307 and IWHR-SKL-201308). The authors wish to thank the reviewers of this manuscript for their valuable comments, which helped improve the quality of this manuscript.
REFERENCES
Burn, D.H. and Elnur, M.A.H. (2002) Detection of hydrologic trends and variability. Journal of Hydrology 255, 107–122.
Du, J., Shi, C.X. and Zhang, C.D. (2013) Modeling and analysis of effects of precipitation and vegetation coverage on runoff
and sediment yield in Jinsha River Basin. Water Science and Engineering 6, 44–58.
Hamed, K.H. (2008) Trend detection in hydrologic data: The Mann–Kendall trend test under the scaling hypothesis. Journal of
Hydrology 349(3–4), 350–363.
Jiang, T., Su, B.D. and Hartmann, H. (2007) Temporal and spatial trends of precipitation and river flow in the Yangtze River
basin, 1961-2000. Geomorphology 85(3–4), 143–154.
Kendall, M.G. (1975) Rank Correlation Methods. Griffin, London, UK.
Kirshen, P., et al. (2005) Global analysis of changes in water supply yields and costs under climate change: A case study in
China. Climatic Change 68, 303–330.
Robinson, T.P. and Metternicht, G. (2006) Testing the performance of spatial interpolation techniques for mapping soil
properties. Computers and Electronics in Agriculture 50, 97–108.
Song, M.B., Li, T.X. and Chen, J.Q. (2012) Preliminary analysis of precipitation runoff features in the Jinsha River basin. 2012
International Conference on Modern Hydraulic Engineering in Procedia Engineering 28, 688–695.
Su, B.D., et al. (2004) Observed precipitation trends in the Yangtze River catchment from 1951 to 2002. Journal of
Geographical Sciences 14(2), 204–218.
Su, B.D., et al. (2005) Trends in frequency of precipitation extremes in the Yangtze River basin, China: 1960-2003.
Hydrological Sciences Journal 50(3), 479–492.
Wang, Y.J., Jiang, T. and Shi, Y.F. (2005) Changing trends of climate and runoff over the upper reaches of the Yangtze River
in 1961−2000. Journal of Glaciology and Geocryology 27(5), 709−714.
Wang, S.J., et al. (2013) Trend analysis of precipitation in the Jinsha River Basin in China. Journal of Hydrometeorology 14,
290–303.
Zeng, X.F., et al. (2008) Spatial characteristics and evolutional trends of annual precipitation in the Yangtze River basin.