Studies of MHD Stability Using Data Mining Technique
in Helical Plasmas
Satoshi YAMAMOTO, David PRETTY
1), Boyd BLACKWELL
2), Kazunobu NAGASAKI,
Hiroyuki OKADA, Fumimichi SANO, Tohru MIZUUCHI, Shinji KOBAYASHI,
Katsumi KONDO
3), Ruben JIMÉNEZ-GÓMEZ
1), Enrique ASCASÍBAR
1),
Kazuo TOI
5)and Satoshi OHDACHI
5)Institute of Advanced Energy, Kyoto University, Uji 611-0011, Japan
1)Laboratorio Nacional de Fusión, Asociación Euratom-CIEMAT, Madrid 28040, Spain 2)Australian National University, Canberra ACT 0200, Australia
3)Graduate School of Energy Science, Kyoto University, Uji 611-0011, Japan 4)National Institute for Fusion Science, Toki 509-5292, Japan
(Received 5 December 2008/Accepted 19 November 2009)
Data mining techniques, which automatically extract useful knowledge from large datasets, are applied to multichannel magnetic probe signals of several helical plasmas in order to identify and classify MHD instabil-ities in helical plasmas. This method is useful to find new MHD instabilinstabil-ities as well as previously identified ones. Moreover, registering the results obtained from data mining in a database allows us to investigate the char-acteristics of MHD instabilities with parameter studies. We introduce the data mining technique consisted of pre-processing, clustering and visualizations using results from helical plasmas in H-1 and Heliotron J. We were successfully able to classify the MHD instabilities using the criterion of phase differences of each magnetic probe and identify them as energetic-ion-driven MHD instabilities using parameter study in Heliotron J plasmas.
c
2010 The Japan Society of Plasma Science and Nuclear Fusion Research
Keywords: MHD stability, data mining, magnetic probe, energetic-ion-driven MHD instability, helical plasma DOI: 10.1585/pfr.5.034
1. Introduction
Research on toroidal plasmas aiming at realization of magnetically confined thermonuclear fusion enters a new phase as construction begins of the International Ther-monuclear Experimental Reactor (ITER), in which self-heating by alpha particle will occur. Knowledge gained from a database based on the experimental results obtained from several tokamaks has influenced the design of the ITER. An alternative design to the tokamak is the he-lical system which, in principle, can sustain steady state plasmas because its magnetic configuration is mainly pro-duced by external coil currents. The activity to build a database for helical systems has been initiated through a series of Coordinated Working Group Meeting (CWGM) and has produced an International Stellarator/Heliotorn Profile Database (ISHPDB). It is important to create a database in order to obtain a unified knowledge of heli-cal plasmas, as the different helical devices differ in mag-netic configuration (e.g. effective helical ripple and dom-inant Fourier modes) and plasma parameters. Magneto-hydrodynamic (MHD) stability, which affects the global plasma confinement and/or particle transport, is studied us-ing large amounts of data obtained at high samplus-ing fre-quency from multichannel diagnostics such as magnetic
author’s e-mail: [email protected]
probe arrays, electron cyclotron emission (ECE) measure-ments and soft-X ray diode arrays. Such large databases require sophisticated methods of analysis.
Data mining techniques [1–3] based on statistics, pat-tern recognition, artificial intelligence and information technology have been used in the areas of distribution and finance for business. Moreover, data mining techniques are also used in the scientific fields of bio-informatics, astron-omy and geology. Data mining methods can extract new information because they are able automatic pick out pat-terns (relationships between data points and parameters) in large amounts of high-dimensional data. We apply a data mining technique to analyze the fluctuation signals within a large database in order to identify MHD instabili-ties. Moreover, the entry of information about MHD insta-bility classifications into a database enables us to exactly and quickly investigate the characteristics of MHD stabil-ity through parameter studies. The data mining technique used here has been shown to be effective for the analysis of MHD stability in H-1 [4] flexible heliac plasmas [5–7] for the first time. We recently applied the data mining technique to the Heliotron J [8] whose magnetic configura-tions have magnetic well and low magnetic shear in whole plasma. This is the next step study in order to obtain a uni-fied knowledge and its effectiveness for the MHD stability
c
2010 The Japan Society of Plasma
of helical plasmas.
In this article, we discuss the data mining technique and its effectiveness for the MHD stability analysis from the results of H-1 and Heliotron J. Section 2 introduces how to apply the data mining technique to magnetic probe signals related to the MHD instability with a large amount of data. Discussed are the procedures of data mining: pre-processing and filtering of the data, the main clustering, and visualization for the interpretation of results. Section 3 discusses the results of the MHD stability analysis, espe-cially energetic-ion-driven MHD instabilities in Heliotron J plasmas, through the parameter study. A summary is given in Sec. 4.
2. Data Mining Technique for the
MHD Stability Analysis
The data mining process employed here consists of three steps, (1) pre-processing, (2) main algorithm for clus-tering and (3) visualization for the interpretation of results. In order to analyze the MHD stability in helical plasmas we choose, for our initial dataset, multichannel magnetic probe signals such as those from a poloidal array, which provides spatial information about MHD instability. The numbers of magnetic probes belonging same poloidal ar-ray are 28 and 14 channels in H-1 and Heliotron J, respec-tively.
2.1
Pre-processing for the data mining
The extraction of spatial information about MHD in-stabilities and the filtering out of noise from raw signals are required for the data mining technique to be effective. In order to achieve time resolution we split each shot into short time segments, where the time window is short com-pared to the plasma discharge time and long comcom-pared to the MHD fluctuation time. For example, data are sampled with 1 MHz, then we usually choose 1024 data points, that is, a time segment of about 1 ms. In this article, we fo-cus on the MHD instabilities, of which frequency and/or amplitude usually change in the scale of Alfvén time, but when bursting oscillation with rapid frequency and/or am-plitude changes are occurring, the width of time segment should be adjusted accordingly. We take the singular value decomposition (SVD) of all magnetic probes signals for each time segment to separate different MHD instabilities and remove the small singular values, which contain low signal energy and noise. The matrixS, which consists of Nc×Ns where NcandNsare the number of channel and
data points within time segment, are represented by SVD.
S =U AV∗ (1)
where the column of U and V correspond to the spa-tial (topo) and temporal (chrono) singular vector, respec-tively. V∗ means the conjugate transpose of V and the diagonal elements ofAare the non-negative singular val-ues. An example of SVD analysis of magnetic
fluctua-Fig. 1 Typical example of (a)∼(f) power spectra of each chrono
and (g) singular values in the NBI-heated plasmas of
He-liotron J where the line averaged electron densityne ∼
0.7×10¹⁹m−3and injected port-through NBI powerP inj∼
0.5 MW. C0,C1, . . . ,C5 are the chronos of the singular value 0,1, . . . ,5 as shown in left figure. There are two
distinct modes having the frequencyf ∼40 kHz for SV1
(C1) and SV2 (C2), and f ∼105 kHz for SV3 (C3) and
SV4 (C4).
tion signals, chrono power spectra and singular values of magnetic probes of Heliotron J is shown in Fig. 1. Here the plasma is produced by the electron cyclotron heating (ECH) and heated and sustained by the neutral beam in-jection (NBI). We can see two dominant modes having the observed frequency fexp ∼ 40 kHz in Figs. 1 (b) and (c),
and fexp∼105 kHz in Figs. 1 (d) and (e). Two chronos C1
and C2, and C3 and C4 have very similar frequency and amplitude, respectively. SVD ideally can divide the trav-elling wave such as rotating mode in the steady state with single helicity into two singular values. Chronos C1 and C2 are the orthogonal sine and cosine components of ob-served MHD instability, which have very similar frequency and amplitude under the condition that the coherenceγ be-tween C1 and C2 is high (e.g.γ >0.7) as well as C3 and C4. Group together singular values with γ > 0.7, then these groups of singular valuesαl(e.g.α1 = {a1,a2}and
α2 ={a3,a4}) are the data points, wherea is the singular
value. We take the inverse SVD to get matrixSlfor each
fluctuation structureαl,
Sl=U AlV∗. (2)
The rows of theSlcontain the time variation relating the
data points for each channel. The power spectra of the topos have a peak at a frequencyωl. The phase difference ΔψX,Y(ω=ωl) between nearest neighbor each channelsX
andYare mapped to the coordinates inΔψ-space with 2Nc
dimensions.
co-Fig. 2 Δψ-space constituted by the phase differences of sine and cosine components for each nearest neighbor magnetic probes pairs of H-1. There are three collectives with dif-ferent symbol and color. Each collective would pick out by clustering method using the expectation maximization (EM) algorithm.
sine component of the mode. In such case, we have to apply other methods to decompose the mode.
2.2
Clustering
In the 2NcdimensionalΔψ-space, a class of
fluctua-tion of distinct MHD instability is localized as shown in Fig. 2 from H-1 database. In the H-1 flexible heliac, the plasmas included in our database are produced and heated by the ion cyclotron range of frequency (ICRF) and co-herent MHD instabilities driven by the energetic ions were observed [5]. In Fig. 2, we can see three collectives with different symbol and color in aΔψ-space consisted of co-sine component in channel #7 and #8, and co-sine compo-nent in channel #1 and #2 of magnetic probe. Sine and co-sine components of nearest neighbor coil phases are used to overcome the problem of finding a suitable metric in space with 2πperiodicity. Therefore, the Δψ-space used for H-1 and Heliotron J has 56 and 28-dimensions, respec-tively. We use the expectation maximization (EM) clus-tering algorithm, which finds the most likely value of la-tent variables in a probabilistic model [9]. Here we as-sume that each type of fluctuation can be described by a 2Nc-dimensional Gaussian distribution in Δψ-space with
mean and standard deviation for each cluster as the set of latent variables. The EM method consists of two steps, ex-pectation step and maximization step, and the process is repeated until convergence criterion is reached. The ex-pectation step calculates an exex-pectation of the likelihood by including the latent variables, while maximization step calculates the maximum likelihood estimates of the param-eters by maximizing the expected likelihood found on the expectation step.
2.3
Visualization
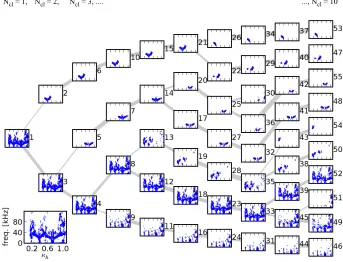
To visualize and check the result is important because choosing the best number of clusters is very difficult to au-tomate and the automatically calculated results may have errors caused by insufficiency and/or mistake of parame-ter settings for clusparame-tering. In the EM methods employed for this study, we have to optimize the parameter for both numerical scheme (e.g. convergence criterion) and maxi-mization of expectation (e.g. Gaussian width).
Figure 3 shows a dendrogram, or cluster treeof re-sults from H-1 data, which displays the cluster for each Nclmeaning the number of cluster, below some maximum
value Ncl,max, with all clusters for a givenNcl forming a
single column. Each cluster plot shows fluctuation fre-quency vs.κh, which is an experimental parameter
propor-tional to the rotapropor-tional transform. The root of the tree at Ncl =1 includes all data points in the scan experiment of
rotational transform. Each child cluster is mapped to the cluster on the parent level with which it shares the largest common subset of data points. Cluster branches which do not fork over a significant range ofNclare deemed to be
well defined, and the point where well-defined cluster start to break up suggests thatNclit too high.
3. Application Results of Data Mining
and Parameter Studies
In this section, we discuss the results of our appli-cation of the data mining technique to the Heliotron J plasmas. We analyzed 3786 shots where all of 14 mag-netic probes were acquired in the same conditions of iso-lated amplifier and analog-to-digital convertor. The sig-nals of all magnetic probes in this analysis have been ac-quired at 1 MHz sampling frequency, and 1024 data points were used for the short time segments (Δt ∼ 1 ms). The size of database with multiple data points per time inter-val exceeds 2.5 million data points, including the pre- and post-discharge, and dud-discharge (no plasma data). In our database, the magnetic field Btis set as Bt = 1.25 T
Fig. 3 An Example of cluster tree for MHD instabilities observed in H-1. In all figures, the data are plotted in the rotational transform
specified helical coil parameterκhand frequency space.
Fig. 4 (a) All data points with high coherenceγ > 0.7 plotted as time (ms) and frequency (kHz) after Hα filtering out process. (b)
Removed noise contained the pre-, post- and dud-discharge.
dataset for clustering, retaining the higher frequency fluc-tuations, some of which have previously been identified as Alfvén eigenmode destabilized by the energetic ions with Alfvénic velocity produced by NBI heating [10]. There are some difficulties to apply the SVD to low frequency fluctuation because their frequency spectra are broadband. Figure 5 shows nine clusters, which are well-defined by the data mining technique using EM algorithm. It seems that the data plots having frequencies f = 210 kHz and 430 kHz without time variation in Fig. 5 (f) are not MHD instabilities but electromagnetic noise. The frequency of MHD instabilities in each cluster shown in Fig. 5 is in the range of frequencies f = 20∼150 kHz which is close to the frequency of shear Alfvén continua with positive
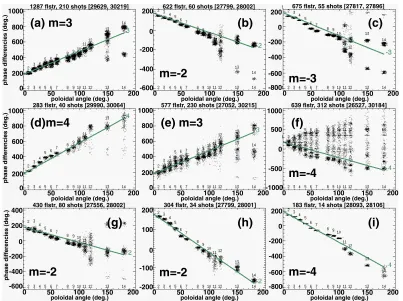
low-mand n (m andn the poloidal and toroidal mode num-bers). Figure 6 shows the phase differences between each magnetic probe for each cluster shown in Fig. 5 calcu-lated using the fast Fourier transform (FFT). Each label (a)∼(i) in Fig. 6 corresponds to those in Fig. 5. The esti-mated poloidal mode number mfor each cluster is indi-cated in Fig. 6. Although the direction of propagation of the observed mode is different, the observed modes have low poloidal mode numbers of |m| < 4. Here, the sign of poloidal mode number corresponds to the propagation direction of the mode withm > 0 and m < 0 respec-tively corresponding to the electron- and ion-diamagnetic drift directions for the condition of Bt > 0. To
Fig. 6 Phase differences of magnetic probes are illustrated for nine clusters shown in Fig. 5. The vertical and horizontal axes mean
the phase differences between magnetic probe #1 corresponding 180 (deg.) and each magnetic probe, and poloidal angle of each
magnetic probe in degree. The number near each point indicates the label of magnetic probe. The estimated poloidal mode number
mof each MHD instabilities is also indicated in each figure.
Fig. 5 Nine clusters defined in phase space are shown. Each fig-ure shows the time variation of frequency of data points within each cluster observed in Heliotron J. The number of discharge with observed MHD instabilities belonging each cluster is indicated at the upper of each figure.
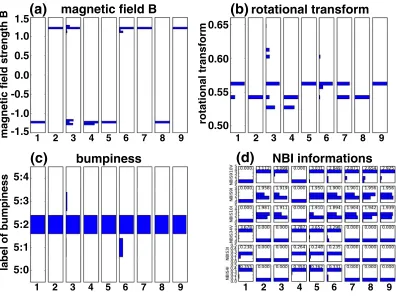
the different two directions, we searched the magnetic field strength in the database as show in Fig. 7 (a). As a result of comparison between cluster in Fig. 6 and Fig. 7 (a), al-most all of observed modes propagate in the diamagnetic
Fig. 7 Parameter dependencies of each cluster of which number showed as horizontal axis corresponds to the number of cluster in
Figs. 5 and 6. (a) magnetic field strengthBtfor each cluster, (b) rotational transform at edge, (c) label of bumpy field where the
value indicates the ratio of coil current for two kinds of toroidal coil, and (d) data of NBIs. NBIS910V and NBIS34V are the acceleration voltage of beam line 1 and 2 of NBIs. NBIS9I and NBIS10I are the beam current of ion sources consisted of beam line 1, respectively. NBIS3I and NBIS4I are the beam current of ion sources consisted of beam line 2, respectively.
therefore will distinguish between opposite poloidal rota-tion direcrota-tion determined by the direcrota-tion of the magnetic field. In order to identify the observed MHD instabilities in each cluster, we investigated the NBI conditions. Almost all observed MHD instabilities were observed in the co-injected NBI heated plasma. From these results we iden-tified the observed MHD instabilities in the nine cluster as energetic-ion-driven MHD instabilities destabilized by the co-flowing energetic ions. In the future plan, we will optimize the pre-processing and clustering algorithm and expand the database regarding to several plasma parame-ters in order for more clear identification of energetic-ion-driven MHD instabilities and low frequency MHD insta-bilities which tend to have broadband frequency spectra in Heliotron J.
4. Conclusion
We applied a data mining technique to multichannel magnetic probe signals to analyze the MHD fluctuations in several helical plasmas in order to get unified knowledge of helical plasmas with three-dimensional magnetic con-figuration. Pre-processing for the data mining technique uses the SVD to search the coherent fluctuations, which
would correspond to the MHD instabilities, and to remove noise and unnecessary signals with low intensity. The clus-tering using EM successfully classified the MHD instabili-ties from a very large database. We identified the observed MHD instabilities as energetic-ion-driven MHD instabili-ties such as global Alfvén eigenmodes due to the parameter study using the database including results of the data min-ing technique and some plasma parameters such as mag-netic field strength and rotational transform.
Acknowledgments
The authors would like to acknowledge the H-1, Heliotron J and TJ-II staff. This work was supported by the NIFS/NINS under the NIFS Collaborative Re-search Program (NIFS04KUHL005, NIFS07KUHL011 and NIFS07KUHL016) and under a project sponsored by the Formation of International Network for Scientific Col-laborations.
[1] J. Han and M. Kamber,Data Mining: Concepts and
Tech-niques(Morgan Kaufmann, 2001).
[3] D. Hand, H. Mannila and P. Smyth,Principles of Data
Min-ing(MIT Press, Cambridge, MA, 2001).
[4] B.D. Blackwell, Phys. Plasmas8, 2238 (2001).
[5] B.D. Blackwellet al., Contribution paper of Fusion Energy
Conference, EX/P6-3 (2006).
[6] D.G. Pretty and B. Blackwell, Comput. Physics Comm.
180, 1768 (2009).
[7] D.G. Pretty, PhD thesis, Australian National University (2007).
[8] T. Obikiet al., Nucl. Fusion40, 261 (2001).
[9] I.H. Witten and E. Frank,Data Mining: Practical Machine
Learning Tools and Techniques (Morgan Kaufmann, 2nd edition, 2005).