159
Volume LIX 19 Number 4, 2011
CHOSEN ASPECTS OF HUMAN CAPITAL
DEVELOPMENT IN REGIONS OF THE CR
B. Minařík, J. Borůvková
Received: March 8, 2011
Abstract
MINAŘÍK, B., BORŮVKOVÁ, J.: Chosen aspects of human capital development in regions of the CR. Acta univ. agric. et silvic. Mendel. Brun., 2011, LIX, No. 4, pp. 159–166
The essential measurable part of human capital is education. Educational, research and development capacities, economic development of regions, labour market, education of the population, and educational eff ects in regions of the CR in 2008 are the theme of this paper. The authors have analysed the total of 15 indices, which were shown in logical and conclusive mutual relations. The authors tried to quantify and from this point of view to compare the regions of the CR in light of the economic eff ect of education, which is based on the status of people with university education in the labour market – this is a combination of higher remuneration, higher economic activity and better employability of people with university education. The eff ect of education was assessed in the relation to the values of corresponding indices for the whole CR. In this case, a special status of the capital city of Prague and Central-Bohemian Region were manifested, while the opposite end of the ladder was occupied by Karlovy Vary Region and Ústí Region. In most cases, the status of university educated population of the regions corresponds with the values determined for all the CR. An interesting view can be presented by a comparison inside regions, in the relation to the values of indices for the given region. Here the largest eff ects from education were manifested mainly in some less developed regions, while e.g. Prague, a traditional leader in all similar analyses, is from this point of view found almost at the back.
human capital, education, development, labour market, regions of the Czech Republic
Since the times of Becker and Schultz1, human capital as a sum of productive knowledge, skills and motives, which result from native abilities, education, and family and social environment, has been perceived more and more as a signifi cant productive factor. However, measuring human capital in all the range of its defi nitions remains a problem. For this reason, the problem of human capital measuring is usually reduced to measuring its educational component. Nevertheless the educational component itself is not easy to measure, either. Although there are some rather accurate methods (e.g. tests of functional literacy of the adult), these are not generally and widely applicable as they
are money and time-consuming and serve rather for research purposes.
Generally the education of an individual derives from their graduation from educational institutions. Even if we forget the fact that the graduation from an educational institution itself does not have to guarantee obtained education fully, measuring and namely aggregation of this variable is not easy. Various authors make attempts to measure (and aggregate) education (and thus indirectly also human capital) of certain population by allocating scores to individual levels of education, determining average length of study (in number of years) or determining so called expected average length of
study (analogically to average lifespan expected at birth)2.
In common investigations, European (and consequently also Czech) statistics discriminates only three levels of education – primary, secondary, and university education. As we have drawn from readily available data of the Czech Statistic Offi ce regional statistics, we will stay within this classifi cation in this paper. We will deal with various aspects of university education and the degree of success of its graduates and the use of its science and research in the conditions of diff erently economically developed regions of the CR. However, it is not only about repeating the widely known fi ndings that university graduates are better paid for their work, are economically active above average, and do not run such a risk of unemployment.
By the way, besides these fi ndings, researches from rather a quaint category can be found when studying sources, proving a direct relation of health condition and lifespan to the level of obtained education as well as the fact that with growing level of education the consumption of alcoholic beverages decreases for men (converted to rubbing alcohol), while for higher educated women the consumption of alcohol rises3. There is a certain problem of signifi cant dependence of not only the latter fi nding, but of practically all fi ndings connected with human capital on the gender. We have deliberately avoided this problem in our paper.
MATERIAL AND METHODOLOGY
Data is drawn from regional annual publications of the CSO referring to 2008. Dispensable information can be divided into four areas:
• educational capacities and interest in university education (Tab. I),
• personnel and fi nancial provision of research and development (Tab. II),
• economic level of regions (Tab. III), • labour market characteristics (Tab.III),
• eff ects issuing from education in relation to the values for the whole CR (Tab.IV),
• educational level of population and eff ects issuing from education within the regions of the CR in wage area, in economic activity and employability (Tab. V),
• all by regions of the CR for 2008, drawn from regional annual publications of the CSO 2009. Common statistic methods were used to process the data. Relations among variables were examined by means of the factor analysis.
To measure the economic eff ect of educational level, an index was constructed, issuing from three components. We start from the fact that costs invested into education (we did not deal with their measuring in this work) are compensated for by yields or “economic eff ects” in three areas:
• In the area of wages by higher than average wages of employees with university education. The wage eff ect will be determined as a ratio between the average wage in the category of “brain workers”
2 Mazouch, 2010, pp. 29–35. 3 Mazouch, 2010, p. 71, p. 75
I: Distribution of university students in regions of the CR in % (2008)*
Region Students according to the school seat Students according to permanent residence Share in the age category of 20–29 years
1. Prague, the capital 38.8 14.8 26.8
2. Central Bohemian 0.5 10.0 19.8
3. South Bohemian 3.5 6.2 23.6
4. Plzeň 4.8 4.6 19.6
5. Karlovy Vary 0.4 2.1 16.1
6. Ústí 3.2 6.5 18.5
7. Liberec 2.5 3.5 19.2
8. Hradec Králové 2.2 5.0 22.4
9. Pardubice 2,5 4,7 21,9
10. Vysočina 0,7 5,1 23,4
11. South Moravian 20,2 11,5 23,7
12. Olomouc 5,6 6,5 24,0
13. Zlín 3,6 6,6 26,7
14. Moravian-Silesian 11,6 12,7 24,2
(according to the branches of OKEČ – Branch Classifi cation of Economic Activities, as average wages of university graduates for 2008 were not available) and the average wage of the region as a whole.
• In the area of economic activity by higher economic activity of university graduates than the average of the corresponding region. The principle of construction is the same as with wage eff ect.
• In the area of employment by better employability (lower unemployment then the region’s average) of university graduates. To preserve the same direction of working for all the eff ects (and the possibility to determine their common infl uence), this index was set as a ratio of a regional common unemployment rate and the common unemployment rate of university graduates. II: Research capacities and expenses in regions of the CR (2008)
Region A B C D E
1. Prague, the capital 25.5 17.1 11.0 39.4 18.3
2. Central Bohemian 10.1 4.3 2.5 16.8 8.0
3. South Bohemian 10.1 3.0 1.3 14.2 3.1
4. Plzeň 10.8 3.2 1.3 17.0 3.1
5. Karlovy Vary 6.3 0.4 0.3 6.5 0.3
6. Ústí 5.4 1.0 0.5 9.1 1.0
7. Liberec 76 3.3 1.7 11.5 3.5
8. Hradec Králové 10.6 2.6 1.3 15.9 2.2
9. Pardubice 9.7 4.3 2.3 14.0 3.9
10. Vysočina 9.5 1.3 0.8 11.9 1.4
11. South Moravia 13.7 6.6 4.1 23.0 5.3
12. Olomouc 9.8 3.2 1.7 13.4 2.2
13. Zlín 9.5 3.1 1.4 15.6 2.8
14. Moravian-Silesian 10.9 2.3 1.3 12.4 2.1
University educated population (in% of 15+ population) Employees in research per 1,000 persons (converted) Research employees per 1,000 persons (converted) Scientists and engineers (number of people)
Research expenses (in thousands CZK per inhabitant of region)
III: Chosen economic indices of regions of the CR (2008)
Region GDP in PPS
per inhabitant
DIH per inhabitant
(thousands CZK)
Average gross wage (thousands
CZK)
Common unemploy-ment
rate (%)
Economic activity (%)
1. Prague, the capital 43.0 229 35.9 1.9 61.4
2. Central Bohemian 18.8 181 26.4 2.6 59.6
3. South Bohemian 17.2 163 22.8 2.6 59.4
4. Plzeň 18.4 169 25.0 3.6 59.9
5. Karlovy Vary 14.3 150 22.8 7.6 60.8
6. Ústí 15.9 147 24.2 7.9 57.2
7. Liberec 15.4 156 24.7 4.6 56.5
8. Hradec Králové 17.0 163 23.1 3.9 58.2
9. Pardubice 16.7 159 23.4 3.6 58.1
10. Vysočina 16.9 161 23.5 3.3 58.3
11. South Moravia 18.4 165 25.1 4.4 57.0
12. Olomouc 14.8 155 23.9 5.9 57.0
13. Zlín 16.3 162 22.7 3.8 57.9
RESULTS AND DISCUSSION
In 2008 there were 71 tertiary educational institutions in the CR, 26 of them public, i.e. 36.6% from the total number of universities and colleges. In individual regions, the number of tertiary educational institutions ranged from one in fi ve regions (among these, there was no university in Central Bohemian and Karlovy Vary regions) to 32 tertiary institutions (8 of them public) in the capital city Prague. The total number of enrolled students was 374,766; 338,435 of them citizens of the Czech Republic. At public schools, there were 296,249 students, i.e. 87.5% from the total number of students with Czech citizenship. While the “average size” of a university measured by the number of students was 11,394 students for public schools (from 370 at Academy of Fine Arts in Prague to 48,054 at Charles
University in Prague), for private schools it was only 951 students (from 7 to 8,404 students). The number of students at universities residing in individual regions is given by the historical development (traditional academic centres as Prague, Brno, and Ostrava), although sometimes (especially as for private schools) it is relatively recent “history”. At colleges and universities in Prague, there were studying 38.8% from the total number of all students, in the South Moravian region it was 20.2% and in the Moravian-Silesian region 11.6%. At the opposite end of the spectrum, there are Karlovy Vary region (0.4%), Central Bohemian region (0.5%) and Vysočina region (0.7%).
Considerably more interesting information from regional point of view can be seen if we consider the number of students not according to the seat IV: Economic eff ects of education with regard to the CR average
Region Wage eff ect Economic activity eff ect Employment eff ect Summary eff ect
1. Prague, the capital 1.86 1.31 3.38 8.24
2. Central Bohemian 1.36 1.31 3.67 6.54
3. South Bohemian 1.25 1.32 2.93 4.83
4. Plzeň 1.36 1.32 2.20 3.95
5. Karlovy Vary 1.30 1.31 0.94 1.60
6. Ústí 1.37 1.32 1.05 1.90
7. Liberec 1.33 1.16 1.52 2.35
8. Hradec Králové 1.25 1.32 2.00 3.30
9. Pardubice 1.28 1.30 1.47 2.45
10. Vysočina 1.27 1.33 2.59 3.28
11. South Moravia 1.43 1.29 2.00 3.69
12. Olomouc 1.29 1.33 1.52 2.61
13. Zlín 1.29 1.33 2.75 4.72
14. Moravian-Silesian 1.29 1.27 1.91 3.13
V: Economic eff ects of education within regions of the CR
Region Wage eff ect Economic activity eff ect Employment eff ect Summary eff ect
1. Prague, the capital 1.22 1.25 1.46 2.23
2. Central Bohemian 1.21 1.29 2.16 3.37
3. South Bohemian 1.29 1.30 1.77 2.97
4. Plzeň 1.28 1.29 1.80 2.97
5. Karlovy Vary 1.34 1.26 1.62 2.74
6. Ústí 1.33 1.35 1.88 3.38
7. Liberec 1.27 1.20 1.59 2.42
8. Hradec Králové 1.27 1.32 1.79 3.00
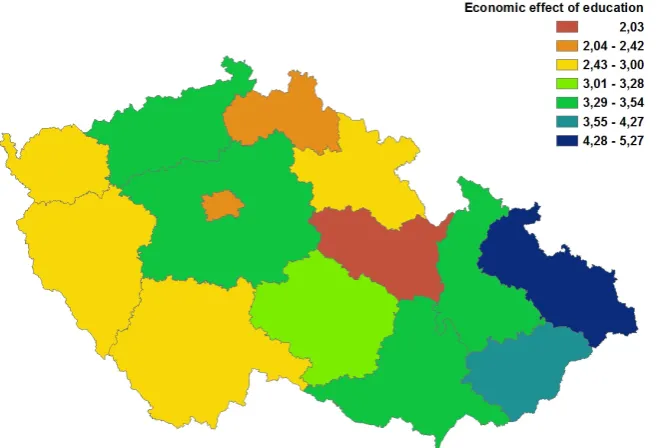
9. Pardubice 1.29 1.31 1.20 2.03
10. Vysočina 1.27 1.33 1.94 3.28
11. South Moravia 1.34 1.32 2.00 3.54
12. Olomouc 1.27 1.36 2.03 3.51
13. Zlín 1.34 1.34 2.38 4.27
of the school, but according to their permanent residence. Here we could expect much more even representation of individual regions’ inhabitants, which, however, is true only partly. In the fi rst place, there is Prague again (14.8% from the total number of students has a permanent residence in Prague), Moravian-Silesian region (12.7%) and South Moravian region (11.5%). At the opposite end of the spectrum there were Karlovy Vary region (2.1%), Liberec region (3.5%) and Pardubice region (4.7% from the total number of students have a permanent residence in the mentioned regions). As these numbers are logically infl uenced by various sizes of regions from the point of view of the number of inhabitants of the corresponding age group, we have consequently calculated this percentage for the age group of 20–29. From the data in the table it is apparent that the regions with the relatively highest representation of university students in the corresponding age group are Prague (26.8%) and rather surprisingly Zlín region (26.7%) followed by Moravian-Silesian region (24.2%). At the opposite end of the ladder there is Karlovy Vary region (16.1%), Ústí nad Labem region (18.5%) and Liberec region (19.2%).
Strong academic centres are traditionally not only educational centres, but also research and development ones. Tab. II brings regional overview of some indices connected with research capacities and expenses connected with them. Again, the unrivalled status of Prague exceeds as for both personnel provision and fi nancial provision of science and research. In a big distance, South Moravian region comes next, followed by Plzeň and South Bohemia Regions. By contrast, we can see a very bad status of Karlovy Vary, Ústí and Vysočina regions.
The economic level of regions and chosen characteristics of the labour market are shown in Tab. III. In Fig. 1 there is a cartogram created from the basic characteristics of the labour market (wages, unemployment, economic activity), which compares the situation in regions with values for the whole CR.
In Tab. IV there are calculated economic eff ects of university education in regions of the CR in comparison with the population average. We issue from the fact that costs invested to education (we did not deal with their measuring in this work) are compensated by yields or “economic eff ects” in three areas:
• In the area of wages by higher than average wages of employees with university education. The wage eff ect will be determined as a ratio between the average wage in the category of “brain workers” (according to the branches of OKEČ – Branch Classifi cation of Economic Activities, as average wages of university graduates for 2008 were not available) and the average wage of the region as a whole. The wages of brain workers are 21% (Central Bohemian region) to 34% (Karlovy Vary, South Moravia, Zlín regions) higher than the regional average.
• In the area of economic activity by higher economic activity of university graduates than the average of the corresponding region. Their economic activity is 20% (Liberec region) to 36% (Olomouc region) higher than what corresponds to the regional average.
• In the area of employment by better employability (lower unemployment then the region’s average) of university graduates. To preserve the same direction of working for all the eff ects (and
the possibility to determine their common infl uence), this index was set as a ratio of a regional common unemployment rate and the common unemployment rate of university graduates. Here the eff ect appears the most apparent. The unemployment of university graduates is less than a half compared to the regional average in Central Bohemian region and all Moravian regions. The total economic eff ect will be determined as a product of partial eff ects. The results are shown in the cartogram in Fig. 2. From that it implies that
compared to values for the whole CR (=1) in 2008, university education “paid off ” most in Prague and in Central Bohemian region. By contrast, in brought the leas eff ect compared to the values for the CR in Karlovy Vary and Ústí regions. This evaluation almost replicates the position of regions from the point of view of chosen labour market characteristics with regard to the CR average (see Fig. 1).
In Tab. V there are calculated economic eff ects of university education in regions of the CR compared to the average of the corresponding region.
2: Economic eff ect of education with regard to the CR average
The total economic eff ect will again be determined as a product of partial eff ects. The results are shown in the cartogram in Fig. 3. From that it implies that in 2008 university education “paid off ” most in Moravian-Silesian and Zlín region, and it brought the lowest eff ect compared to regional average (=1) in Pardubice region, Prague, and Liberec region.
Figures in Tab.I to Tab. V were further submitted to factor analysis with the aim to identify the groups of variables which show signifi catn inner relationships and to try to interpret them. It resulted in three clearly depicted common factors which group these indices:
Factor 1 (share in the total variability 40%) • GDP per 1 inhabitant,
• disposable income per 1 inhabitant,
• common unemployment rate (with negative relation),
• a region’s position from the point of view of chosen labour market characteristics,
• summary eff ect of education with regard to the CR average,
• number of persons in the category “scientists and engineers“,
which documents conclusively the relation between the economic level of a region, its position in the labour market, the number of scientists and engineers and the eff ect brought by university education to those who have it.
Factor 2 (share in the total variability 30%) • students according to the seat of school,
• students according to their permanent residence,
• share of university graduates in the age group 20 to 29,
• share of university graduates in the population, • summary eff ect of education within a region (with
negative relation).
The factor documents regional diff erence of educational capacities of colleges and universities and in the interest in education in individual regions, leading up to a certain “over-education”, which has a negative impact on the status of university graduates in the labour market.
Factor 3 (share in the total variability 25%) • employees in research per 1,000 persons, • research employees per 1,000 persons, • expenses for research per 1 inhabitant, • average gross wage.
This factor is evidently connected with research capacities of regions. These capacities are higher in regions with higher economic level, which explains average gross wage as one of the variables grouped under this factor.
All correlations were determined as ordinal (disparities elimination, namely the exceptional status of the capital city of Prague, which would otherwise have to be excluded). It is remarkable that none of the 15 indices remained isolated and all of them were included under some of the factors. The character of a certain “link element” among the factors was possessed by the index of the share of university graduates in the population which (with a lower weight) was featured also in the remaining two factors.
CONCLUSION
Using the data of regional statistics of the CSO for 2008, the paper deals with the situation in education, research and development in regions of the CR in the relation to their economic level and situation at the labour market. The authors see the economic eff ect of tertiary education in a combined contribution of higher wages, higher economic activity, and easier employability of people with university education in comparison with the whole population. The result of quantifi cation of the summary eff ect of education is shown by the cartograms in Fig. 2 and Fig. 3, which document the economic eff ect of tertiary education in regions of the CR in 2008 compared to the average of the Czech Republic and to the average of regional population. Inside regions, the positive eff ect of education is manifested especially in some regions, where it is probably a structural problem: in Moravian-Silesian and Zlín regions, the lowest eff ect compared to the regional average was shown in Pardubice region, Prague, and Liberec region. On the contrary the comparison with the values for the whole CR led to a signifi cantly diff erent order: in 2008 tertiary education “paid off ” most in Prague and Central Bohemian region. By contrast, education brought the smallest eff ect compared to the values of the CR in Karlovy Vary and Ústí region. This evaluation almost replicates the position of regions from the point of view of chosen labour market characteristics with regard to the CR average.
REFERENCES
BARRO, R., 2000: Education and economic growth. [online], [quot. 18 Aug 2010]. Accessible at WW: http://www.oecd.org/dataoecd/5/49/1825455.pdf. BECKER, G. S., 1975: Human Capital: A Theoretical and
Empirical Analysis, with Special Reference to Education, 2nd ed. [online], [quot. 18 Aug 2010]. Accessible at www: http://ideas.repec.org/b/nbr/nberbk/ beck75-1.html.
MAZOUCH, P., 2010: Aspekty rozvoje lidského kapitálu. Doktorská disertační práce. Praha: VŠE, 2010. URBÁNEK, V., 2003: Nehmotné investice a jejich
návratnost: měření lidského kapitálu. [online], [cit. 18
Aug 2010]. Accessible at www: http://kvf.vse.cz/ storage/1168948787_sb_urbanek.pdf.
SVATOŠOVÁ, L., 2006: Analýza potenciálu lidských zdrojů v regionech. Acta Universitatis Meridionales, The Scientifi c Journal for Economics, Management and Trade. 9, 71–74.
SVATOŠOVÁ, L., 2007: Lidské zdroje jako předpo-klad regionálního rozvoje. Acta Universitatis Agri-culturae et SilviAgri-culturae Mendelianae Brunensis, 3: 157– 162. ISSN 1211-8516.
Krajské ročenky ČSÚ. [online], [quot. 18 Aug 2010]. Accessible at www: http://www.czso.cz/csu/redakce. nsf/i/krajske_rocenky.
Address