Synthesis, Structural and Optical Behavior of Cerium Oxide
Nanoparticles by Co-Precipitation Method
N.Ramjeyanthi1*, M.Alagar2, D.Muthuraman3
*1Department of Physics, PSN College of Engineering & Technology, Tirunelveli, Tamil Nadu, India 2Centre for Research and Post Graduate Studies, Department of Physics, Ayyanadar Janakiammal College,
Sivakasi, Tamil Nadu, India
3Department of Physics, PSN College of Engineering & Technology, Tirunelveli, Tamil Nadu, India
ABSTRACT
In this paper, cerium oxide (CeO2) nanoparticles were synthesized by co-precipitation method and validate its
physical, chemical and optical properties. X-ray diffraction (XRD) pattern confirms the formation of cubic fluorite structured CeO2 nanoparticles with Fm3 space group. Comparative study for crystallite size of CeO2
nanoparticles was realized with the help of Debye-Scherer’s method and Williamson-Hall (W-H) plot analysis. The appearance of Ce-O stretching band in the Fourier transformed infrared (FTIR) spectrum confirms the formation of CeO2 nanoparticles. Scanning electron microscopy (SEM) results exposed the formation of
spherical shaped particles with nanosize regime. Optical properties of CeO2 nanoparticles were analyzed from
UV-visible diffuse reflectance spectroscopy and the direct band gap value was found to be 3.30 eV. Photoluminescence (PL) spectrum display the broad emission peak in the wavelength ranges of 450-495 nm under the excitation of 325 nm.
Keywords: CeO2, Nanoparticles, co-precipitation, crystallite size, optical properties
I.
INTRODUCTION
Recently, rare earth oxide nanoparticles are attracted for their many applications due to their interesting structural and optical properties with outstanding luminescence efficiency in the visible region [1, 2]. Luminescence behavior of rare earth oxides is mainly originates from the partially-filled 4f electronic shell.
Amongst rare earth oxides, cerium oxide (CeO2)
nanoparticles are interesting materials for many potential applications such as solid state electrolyte for electrochemical devices [3], catalyst for automobile exhauster [4], sun screen for UV absorbents [5], luminescent materials [6], gas sensors [7], polishing materials [8], and oxygen storage capacity [9]. Since,
CeO2 nanoparticles offer many active sites for free
radicals scavenging because of their large surface to volume ratio and their mixed valence states for unique redox chemistry [10]. Moreover, the crystallites with nanosize regime can be easy to confine the movement of phonons. In earlier days, CeO2 nanoparticles have
been prepared by several synthesis techniques such as sol-gel [11], chemical precipitation [12], thermal
decomposition [13], hydrothermal [14], and
combustion method [15]. Among these, co-precipitation offers many advantages include the simple process, low cost, and the crystallization degree and particle size of powders are controllable [16].
In this regard, CeO2 nanoparticles were prepared from
nitrate hexahydrate (Ce(NO3)3.6H2O) as a precursor
and sodium hydroxide (NaOH) can act as a chelating
agent. Furthermore, the physical, chemical,
morphological and optical properties of obtained CeO2
nanoparticles were characterized by using the XRD, FTIR, SEM, UV-Visible DRS and PL analytical tools respectively.
II.
METHODS AND MATERIAL
A. Materials
Cerium (III) nitrate hexahydrate (Ce(NO3)3.6H2O
(434.22 g/mole; 99.9% purity) and Sodium hydroxide (NaOH) (40.00 g/mole; 99.9% purity) were purchased from Himedia Laboratories Pvt. Ltd. These chemicals were used without any further purification. Distilled water and ethanol were used for solvent and washing process.
B. Synthesis of CeO2 nanoparticles
0.1 M of cerium nitrate was dissolved in distilled water with constant stirring for 30 minutes at room temperature. Afterwards, 0.3 M aqueous NaOH solution was added to the cerium nitrate solutions by drop-wise at room temperature with constant stirrer and allows to the settle down of solution. An un-reacted nitrate present in the resultant precursor solution was completely removed by washing process with the help of water and ethanol in several times. During this washing process, appearance of the final precursor solution was changes from dark blackish into whitish color. The final product was filtered and dried at room temperature for 96 hours. At last, obtained powder samples were grained by using mortar and pestle and obtain the ultrafine CeO2
nanoparticles.
III.
RESULTS AND DISCUSSION
A. XRD analysis
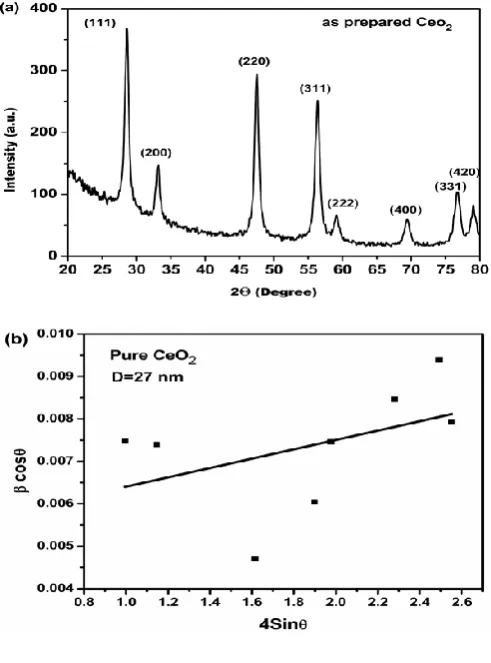
The crystalline behavior of as prepared CeO2 sample
was characterized by X-ray diffraction (XRD) in the
of as prepared CeO2 sample is shown in Fig. 1(a). The obtained results shows that the maximum intensity peak was observed at (111) and other intensity peaks were observed at (200), (220), (311), (222), (400), (331), and (420) crystal planes. All the identified peaks are good agreement with the JCPDS file (34-0394) and well consistent with earlier report [17]. It clearly indicates the formation of polycrystalline CeO2 (space
group: Fm3m) with cubic fluorite structure.
Figure 1. (a) XRD Pattern (b) W-H Plot of the as prepared CeO2 nanoparticles
The average crystallite size (D in nm) of the CeO2
nanoparticles was found to be 21 nm by using the Debye-Scherrer formula [18] as follows,
D = Kλ/βcosθ
crystallite size of CeO2 nanoparticles also calculated
by using Williamson-Hall plot analysis [19]. Fig. 1(b) illustrates the W-H plot for CeO2 nanoparticles. From
this plot, the crystallite size of CeO2 nanoparticles was
found to be 27 nm. The crystallite size observed from the W-H method is slightly high compared to the size measured from the Debye-Scherrer method. It may ascribe to be removal of broadening error was achieved in the W-H plot. In addition to the crystallographic parameters of as prepared CeO2
nanoparticles were summarized in Table 1.
Table 1. Crystallographic properties of as prepared CeO2 nanoparticles
Lattice Parameter
(a=b=c) (Å)
Unitcell Volume (V)
(Å)3
Average Crystallite size (nm)
Debye-Scherrer
method
Williamson -Hall method
5.4033 157.75 21 27
B. FTIR Spectra analysis
The functional group of as synthesized CeO2
nanoparticles was analyzed by using FTIR
spectroscopy. FTIR spectra (Fig. 2) of CeO2
nanoparticles were measured in the wave number range of 400 to 4000 cm-1. The obtained bands were good agreement with the literature [20, 21]. A strong absorption band at 3400 and 1632 cm-1 represents the
water and hydroxyl stretches (O-H stretching). The bands observed 2925 and 2848 cm-1 are arising due to
C-H bonding. The band at 2365 and 1399 cm-1 may
appear from the absorption of atmospheric CO2. The
absorption band at 855, 743 and 614 cm-1 represent
the metal-oxygen Stretching (Ce-O stretch) which confirm the formation of CeO2 nanoparticles.
Figure 2. FTIR Spectra of as prepared CeO2
nanoparticles
C. SEM analysis
Scanning electron microscope (SEM) is the powerful magnification tool to detect surface morphology of nanoparticles. The obtained SEM image of the as prepared CeO2 nanoparticles was shown in Fig. 3. It
evident that the surface of CeO2 consists of spherical
shaped particles with homogenous distribution. Apart from this some less number of agglomerations was also identified in the SEM images. The obtained morphology was also well connected with Literature [21, 22]. Due to the greater agglomerations, an exact value of particle size was not easy to calculate. An approximate value of average particle size was found to be 45 nm by using the ImageJ software.
Figure 3. SEM image of the as prepared CeO2
nanoparticles
The optical behavior of as prepared CeO2
nanoparticles was analysed by using UV visible diffuse reflectance spectroscopy.
Figure 4. Room temperature (a) optical reflectance spectra and (b) K-M Plot of CeO2 nanoparticles
The reflectance spectra of CeO2 nanoparticle was
shown in Fig. 4(a). From this data, the direct band gap value of CeO2 nanoparticles was calculated by using
Kubelka-Munk (K-M method) equation [23, 24], (hυ F(R))2= A(hυ-Eg)
where F(R) = (1-R)2/2R, h is a Planks constant, υ is the
light frequency, A is the absorption coefficient and Eg
is the band gap energy. The K-M plot was drawn between (hυ F(R))2 and hυ as shown in Fig. 4(b). A
straight line is drawn tangent to the point of interaction with hυ axis which gives the bandgap energy value 3.30 eV. The obtained Eg value shows
that blue shift occur on the CeO nanoparticles. The
E. PL spectra analysis
The electronic structure of as prepared CeO2
nanoparticles was examined by using
Photoluminescence (PL) spectroscopy. Compared to other optical characterization tools PL is the more leading technique to find optical properties of the material without destructing the sample. The obtained PL spectra of CeO2 nanoparticles in the wavelength
range of 330-900 nm was recorded under the excitation of 325 nm. The PL spectra of CeO2
nanoparticles (Fig .5) exhibits a fine UV emission at 358nm (3.47 eV) and four visible emission peaks 452 nm (2.74 eV), 469 nm (2.64 eV), 483 nm (2.57 eV), 493 nm (2.52 eV) observed in the blue region. Apart from this, strong green emission was also observed at 574 nm (2.16 eV). The emission band observed in the wavelength from 358 to 574 nm is originates from the relative oxygen vacancies (surface defects) of CeO2
nanoparticles. It may causes from the changes in particle size. The relative oxygen vacancies can be also explained on the basis of transfer of charge carrier between 4f conduction band (Ce) to the 2p valance band (O) of CeO2 nanoparticles. This result is similar
to the earlier reports [26, 27].
Figure 5. Room temperature PL spectra of CeO2
Ultrafine cerium oxide nanoparticles were successfully synthesized by co-precipitation method at room
temperature. The cubic phase of the CeO2
nanoparticles were confirmed from XRD pattern and crystallite size of the particles is found to be 21 nm (Scherrer method) and 27 nm (W-H Plot). The SEM images of CeO2 nanoparticles shows that the particles
are spherical in shape with less number of agglomerations. The strong absorption band identified in the wavelength of 325 nm indicates that the CeO2
nanoparticles have high UV absorption characteristics. The PL spectrum indicates the CeO2 nanoparticles
having the violet-blue light emission.
V.
REFERENCES
[1]. G. Adachi, N. Imanka, Z. C. Kang, "Binary rare earth oxides", Kluwer Academic Publishers, Newyork (2004).
[2]. A. Kitai, "Luminescent material and
application", John Wiley & Sons Ltd,Canada (2008) .
[3]. M. Mogensen, N. M Sammes, G. A Tompsatt, Solid State Ionics, 129 (2000) 63-94.
[4]. O. Zawam, Journal Alloys Compounds, 886
(1998) 275-277.
[5]. J. F. D. Lima, R. F. Martins, C. R. Neri, O. A. Serra, Applied Surface Science, 255 (2009) 9006-9009.
[6]. X. J. Yu, P. B. Xie, Q. D. Su, Physical Chemistry Chemical Physics, 3 (2001) 5266-5269.
[7]. N. Izu, W. Shin, N. Murayama, S. Kanzaki, Sensors and Actuators B, 87 (2002) 95-104. [8]. S. H. Lee, Z. Y. Lu, S. V. Babu, E. Matijevic,
Material Research, 17 (2002) 2744-2749.
[9]. N. Kakuta, N. Morishima, M. Kotobuki, T. Iwase, T. Mizushima, Y. Sato, S. Matsuura, Applied Surface Science, 121- 122 (1997) 408-412.
[10]. R. J. Hunter, V. R. Preedy, "Nanomedicine in Health and Disease", CRC Press, (2017) 271-272.
[11]. M Alifanti, B. Baps, N. Blangenois, Chemical material, 15 (2003) 395-403.
[12]. H.R. Pouretedal, A. Kadhodaie, Chinese Journal of Catalysis, 31 (2010) 1328-1334.
[13]. Y. Wang, T. Mori, J. Li, T. Ikegami, Journal of American Ceramic Society, 85 (2002) 3105-3107.
[14]. S. Phoka, S. Pinisoontorn, P. Chirawatkul, Y. Poo-arporn, S. Maensir, Nanoscale Research letters, 7 (2012) 425-443.
[15]. S. Bojana, A. Zeljka, A. Nadica, K. Radenka, M. Mitric, M. Ametia, D.D. Miroslav, Acta Chimica Slovenica, 55 (2008) 486-491.
[16]. J. Luo, J. Chen, W. Li, Z. Huang, C. Chen, MATEC Web of Conferences, 26 ( 2015) 01007-01007-5.
[17]. G. Wang, Q. Mu, T. Chen, Y. Wangi, Journal of alloy and compounds , 493 (2010) 202-207. [18]. H. Chang, H. Chen, Journal of Crystal Growth
283 (2005) 457-461.
[19]. G. K. Williamson, W. Hall, Acta Metallurgica, 1 (1953) 22-31.
[20]. S. Phoka, P. Laokul, E. Swatsitang, V. Promarak, S. Seraphin, S. Maensir, Material chemistry and Physics 115 (2009) 423-428.
[21]. E. Kumar, P. Selvarajan, K. Balasubramanian, Recent Research in Science and technology, 2(4) 2010 37-41.
[22]. M. Chelliah, J.B. Rayappan, U. Krishnan, Journal of Applied Sciences 12(16) (2012)1734-1737. [23]. P. Kubelka, F. Munk Z Tech phys 12 (1931)
593-601.
[24]. P. Kubelka Journal of the Optical Society of America B, 38 (1948) 448-457
[25]. D. M. D. Prabaharan, K. Sadaiyandi, M. Mahendran, S. Sagadevan, Materials Research, 19(2) (2016) 478-482.
[26]. M. A. Majeedk khan, W. Khan, M. Ahamed, A.Alhazaa, Scientific reports, (2017) 25-32. [27]. K. K. Babitha, A. Sreedevi, K. P. Priyanka, B.