244
Fusion Algorithm For Medical Images Using
Non-Subsampled Contourlet Transform
Bhuvaneswari Balachander, D.Dhanasekaran
Abstract: Medical Image fusion has become an integral part in diagnosis and treatment planning. Medical Image fusion is the process of combining two or more images from different modalities to form a new image containing complemented details than the source images. Image fusion improves resolution of the image thereby helping the medical practitioners in determining the position of the disease. Fusion of medical images for different cross-sectional modalities is widely used, mostly where functional images are fused with anatomical data. Ultrasound has for some time now been the standard imaging technique used for treatment planning in prostate cancer, Alzheimer‘s, stroke, Glioma, dementia and many more. While this approach is laudable and has yielded some positive results, latest developments have been the integration of images from ultrasound and other modalities such as PET-CT to complement the missing properties of ultrasound images. Non-subsampled contourlet transform based image fusion is proposed that will help greatly in modern radiation therapy treatment planning.
Keywords: Multi-modality, MRI, CT, Weighted averaging method, Non-subsampled contourlet Transform, image fusion, radiation therapy, treatment planning, medical images.
————————————————————
1.
INTRODUCTION
Image processing focuses mainly on enhancing the quality of the image. Among which ‗Image fusion‘ technique that combines relevant information from two or more images into a single image [1]. Image fusion has been widely used in various areas. Medical imaging techniques play a vital role in the field of medicine in patient treatment and diagnostics, where two or more images of different characteristics and different modalities can be fused together that provides more information to the medical practitioner in treating patients. Images of various formats can be fused together for instance, in the field of medicine Computed Tomography (CT), Magnetic Resonance Image (MRI), Positron Emission Tomography (PET), satellite images, optical images, IR images, UV images and many more [4]. Medical images have a wide range of image characteristics and also provide structural information of various organs. For example CT and MRI medical images have high spatial resolution whereas, PET images produces greater information on metabolic activities of the human body though PET images have low spatial resolution. Imaging techniques are considered to be the first step in diagnosing various diseases. And hence there is a greater need to combine medical images of different characteristics for advancement in clinical diagnosis [6].
2.
LITERATURE SURVEY
Yufeng Zheng et al (2004) have proposed an advanced method that incorporates principal component analysis and morphological processing into a regular DWT fusion algorithm. At every session of the transformed images using wavelet, a main vector was derived from more than one input images and then applied to same number of the images‘ approximation coefficients. For the detail coefficients, larger absolute values are chosen and subjected to morphological processing which served to verify selected pixels. Further, the images were subjected to filling and cleaning process in image fusion. Though the proposed work seems to analyze the coefficients needed for fusion in a proper way it fails to overcome the information loss due to filling and cleaning. Addition or deletion of information from the images may lead to improper decision making.
R. Balasubramanian et al (2008) have proposed an Image fusion algorithm based on contrast using Wavelet Packet Decomposition. In this algorithm, source images are decomposed into low and high frequency sub-bands followed by applying inverse wavelet transform to reconstruct the fused image. However, wavelet packet decomposition transform is limited to one direction.
Amir Fareed et al (2012) have developed a hybrid enhancement fusion algorithm for brain images. This work uses Discrete Wavelet Transform and Inverse Discrete wavelet Transform to separate frequencies of the images. Also this work uses unsharp masking filter for image enhancement. The accuracy of the work improves decision making capacity for the physician towards diagnosis. However, this work lacks in identification of edge information from the brain images as it uses Discrete Wavelet Transform.
Te-Ming Tu et al (2001) have implemented an intensity hue based algorithm for fusing the remote sensing images. This kind of image fusion entirely depends in color space in the images. This methodology overcomes effect of saturation that occurs during image fusion. But the proposed intensity hue based algorithm and Brovey
______________________________ Bhuvaneswari Balachander, D.Dhanasekaran
Assistant Professor, Department of Electronics and Communication Engineering,
Saveetha School of Engineering, Saveetha Institute of Medical and Technical Sciences, Chennai, India.
Principal, Saveetha School of Engineering, Saveetha Institute of Medical and Technical Sciences, Chennai, India.
transform for color space identification is not suitable in MRI, SPECT and CT scan image.
Yang et al (2008) analyzes multimodal medical images, also proposes a comparative study for all the multimodal image fusion methods. Author also emphasizes on numerous significant imaging applications; image display edges and discontinuities crosswise over bends. In biological imagery, this happens at whatever point two organs or tissue structures meet. Particularly in image fusion the edge preservation is significant in acquiring the correlative subtleties of the source image. As edge portrayal in Curvelet is better, Curvelet based image combination is most appropriate for therapeutic images. The image utilized here are grayscale CT and MRI image. Existing research work seems to face challenges such as limitation of direction, insufficient information, time complexity, less accuracy, unsuitable technique of image fusion, filling and cleaning, noise, mis-registration, difference in pixel intensity of source images, signal to noise ratio, etc. To overcome these above mentioned challenges, this synopsis presents a new medical image fusion technique using Discrete Wavelet Transform, Haar Wavelet Transform, Contourlet Transform and Neural Network.
3.
IMAGE FUSION ALGORITHM
Aim of image fusion is to integrate complementary and redundant information from multiple images to create a composite image that contains a better description when compared with the individual source images. The main requirement of image fusion process is to identify the most significant features in the source images and to transfer them without losing any information [3].
Image fusion process takes place at four different levels namely,
(i) Signal-Level Image Fusion (ii) Pixel-Level Image Fusion (iii) Feature-Level Image Fusion (iv) Decision-Level Image Fusion
In signal level Image fusion, signals from various sensors are combined together to produce a signal with better signal to noise ratio (SNR) when compared with the original signals [12]. Pixel-level image fusion is the lowest processing level of image fusion and Pixel level fusion is performed on a pixel by pixel basis [1]. Feature- Level image fusion requires extraction of features from the source image. Features such as intensity of size, shape, contrast, pixels, edges and textures are extracted. These similar features from the input images are fused [13]. Decision-Level image fusion consists of merging of information at a higher level of abstraction, combines results from various algorithms to generate the final fused decision. Some of the Image fusion Algorithms include Averaging Method, Select Maximum method, Select Minimum Method, Principal Component Analysis method, Filter Subtract Decimate Pyramid method, Laplacian Pyramid Method, Gradient Pyramid Method, Ratio Pyramid Method, Morphological Pyramid Method, Haar Wavelet Method, DBSS Wavelet Method. [1][3]
4. DWT BASED MEDICAL IMAGE FUSION
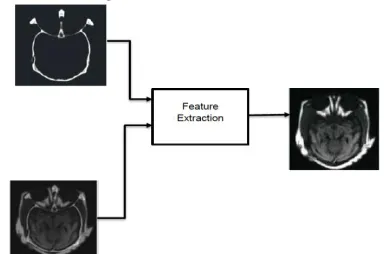
CT scan image provides information on bony features of the brain and MRI scan image provides superior soft tissue information. Fusing a MRI image with a CT image contains more important details than that of the individual source images which greatly helps in disease diagnosis. The block diagram representation of discrete wavelet based image fusion is shown in fig. 1.
Figure 1: Block Diagram Representation of CT and MRI Fusion
To address the variation in edges fusion of CT and MRI using Discrete Wavelet Transform is proposed. The initial step in the proposed fusion algorithm entails the pre-processing of MRI and CT images, in which the CT image and MRI image are converted from RGB to Gray scale image components. This step also entails noise controlling or suppressing the noise that emanates during image acquisition. Noise sources acquired in MRI images are usually based on Gaussian noise models. After pre-processing the source images are decomposed using discrete wavelet transform. On decomposing the source images using discrete wavelet transform, discrete wavelet coefficients are obtained. Discrete wavelet based image fusion rule is applied to combine the appropriate discrete wavelet coefficients of the input source images. After this there is a reconstruction of the processed coefficients which is undertaken after applying image fusion rule through the use of inverse discrete wavelet transform to produce a fused image. Image features available in the source images are highly sensitive to human visual system because these images exist at different scaling levels. Discrete wavelet transform based image fusion preserves better features when compared with pixel level image fusion. In spite of the advantages edges and textured region of the fused image are not preserved in the proposed discrete wavelet transform based medical image fusion. Also, discrete wavelet based fused image lacks directional information. To overcome the drawbacks stated in DWT non-subsampled contourlet transform is proposed.
246 Figure 3: (A) MRI image (B) CT image (C) DWT fusion
results
Figure 4: (A) MRI image (B) CT image (C) DWT fusion results
Figure 5: (A) MRI image (B) CT image (C) DWT fusion results
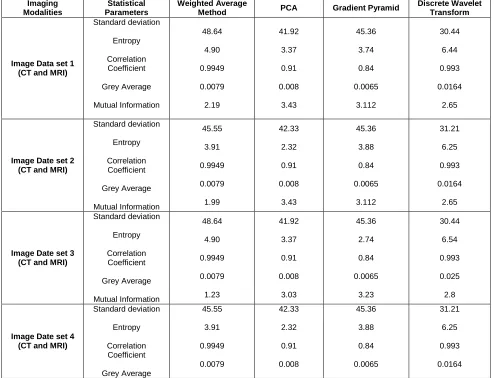
Table 1: Performance Evaluation index for various Fusion Methods
Imaging Modalities
Statistical Parameters
Weighted Average
Method PCA Gradient Pyramid
Discrete Wavelet Transform
Image Data set 1 (CT and MRI)
Standard deviation Entropy Correlation Coefficient Grey Average Mutual Information
48.64 4.90 0.9949 0.0079 2.19
41.92 3.37 0.91 0.008 3.43
45.36 3.74 0.84 0.0065
3.112
30.44 6.44 0.993 0.0164
2.65
Image Date set 2 (CT and MRI)
Standard deviation Entropy Correlation Coefficient Grey Average Mutual Information
45.55 3.91 0.9949 0.0079 1.99
42.33 2.32 0.91 0.008 3.43
45.36 3.88 0.84 0.0065
3.112
31.21 6.25 0.993 0.0164
2.65
Image Date set 3 (CT and MRI)
Standard deviation Entropy Correlation Coefficient Grey Average Mutual Information
48.64 4.90 0.9949 0.0079 1.23
41.92 3.37 0.91 0.008 3.03
45.36 2.74 0.84 0.0065
3.23
30.44 6.54 0.993 0.025 2.8
Image Date set 4 (CT and MRI)
Standard deviation Entropy Correlation Coefficient Grey Average
45.55 3.91 0.9949 0.0079
42.33 2.32 0.91 0.008
45.36 3.88 0.84 0.0065
Mutual Information
2.55 3.12 3.22 2.2
Imaging Modalities
Statistical Parameters
Weighted Average
Method PCA Gradient Pyramid
Discrete Wavelet Transform
Image Data set 1 (CT and MRI)
Standard deviation Entropy Correlation Coefficient Grey Average Mutual Information 48.64 4.90 0.9949 0.0079 2.19 41.92 3.37 0.91 0.008 3.43 45.36 3.74 0.84 0.0065 3.112 30.44 6.44 0.993 0.0164 2.65
Image Date set 2 (CT and MRI)
Standard deviation Entropy Correlation Coefficient Grey Average Mutual Information 45.55 3.91 0.9949 0.0079 1.99 42.33 2.32 0.91 0.008 3.43 45.36 3.88 0.84 0.0065 3.112 31.21 6.25 0.993 0.0164 2.65
Image Date set 3 (CT and MRI)
Standard deviation Entropy Correlation Coefficient Grey Average Mutual Information 48.64 4.90 0.9949 0.0079 1.23 41.92 3.37 0.91 0.008 3.03 45.36 2.74 0.84 0.0065 3.23 30.44 6.54 0.993 0.025 2.8
Image Date set 4 (CT and MRI)
Standard deviation Entropy Correlation Coefficient Grey Average Mutual Information 45.55 3.91 0.9949 0.0079 2.55 42.33 2.32 0.91 0.008 3.12 45.36 3.88 0.84 0.0065 3.22 31.21 6.25 0.993 0.0164 2.2 Imaging Modalities Statistical Parameters Weighted Average
Method PCA Gradient Pyramid
Discrete Wavelet Transform
Image Data set 1 (CT and MRI)
Standard deviation Entropy Correlation Coefficient Grey Average Mutual Information 48.64 4.90 0.9949 0.0079 2.19 41.92 3.37 0.91 0.008 3.43 45.36 3.74 0.84 0.0065 3.112 30.44 6.44 0.993 0.0164 2.65
Image Date set 2 (CT and MRI)
Standard deviation Entropy Correlation Coefficient Grey Average Mutual Information 45.55 3.91 0.9949 0.0079 1.99 42.33 2.32 0.91 0.008 3.43 45.36 3.88 0.84 0.0065 3.112 31.21 6.25 0.993 0.0164 2.65
Image Date set 3 (CT and MRI)
248
The values of performance evaluation index for various fusion methods were listed in Table 1. From Table 1, it is observed that the value of standard deviation, entropy, correlation coefficient and grey average obtained by Discrete Wavelet Based image fusion method using Mallat‘s algorithm is has better results when compared with weighted averaging image fusion technique, PCA, Gradient Pyramid, discrete wavelet transform, contourlet transform. Obviously, DWT based image fusion technique using Mallat wavelet is more efficient than the pixel-based image fusion methods in a certain degree. The comparison of statistical parameters of the fused images for various fusion algorithms are represented in the Table 1. The computation results of image fusion using various methods, shown in Table 1 emphasizes the on the increase in entropy thereby indicating the enhancement of information content in the fused image. Fusion results computed through discrete wavelet transform provides better feature extraction at corners or edges of the source images when compared with the fused image using weighted averaging method and computation is less complex when compared with discrete wavelet transform based image fusion.
5.
NON-SUBSAMPLED
CONTOURLET
TRANSFORM BASED IMAGE FUSION
The proposed medical image fusion framework for multimodal medical images relies on Non Subsampled Contourlet Transform. In this proposed method two fusion rules are used that combines both low and high frequency coefficients obtained from the source images. For fusion of low frequency coefficients phase congruency method is used. Phase congruency integrates both the contrast and brightness invariant representation present in the low frequency image coefficients. Non Subsampled Contourlet Transformation proposed is used to combine high-frequency coefficients of the source images. The proposed image fusion framework relies on directive contrast and phase congruency, in this method a pair of source image are used to produce the composite image. The corresponding pixels of both the source images have to be aligned properly to carry out the fusion process. The difference in intensity values of a particular pixel from its neighboring pixels are often termed as variations in intensity levels or contrast feature measure of the pixels. Our visual system is prone to intensity contrast than the level of intensity occupied by various pixels. In few cases even similar intensity values seems to look different due to the intensity values of the neighboring pixels which leads to a local contrast denoted by the following expressions.
Mutual Information
Image Date set 4 (CT and MRI)
Standard deviation Entropy Correlation Coefficient Grey Average Mutual Information
45.55 3.91 0.9949 0.0079 2.55
42.33 2.32 0.91 0.008
3.12
45.36 3.88 0.84 0.0065
3.22
31.21 6.25 0.993 0.0164
2.2
Image Date set 5 (CT and MRI)
Standard deviation Entropy Correlation Coefficient Grey Average Mutual Information
48.64 4.90 0.9949 0.0079 2.19
41.92 3.44 0.91 0.008
3.43
45.36 3.74 0.84 0.0065
3.112
30.44 6.72 0.993 0.0164
2.65
Image Date set 6 (CT and MRI)
Standard deviation Entropy Correlation Coefficient Grey Average Mutual Information
45.55 3.7 0.9949 0.0079 2.19
42.33 2.58 0.91 0.008
3.43
45.36 3.61 0.84 0.0065
3.112
31.21 6.5 0.993 0.0164
2.65
Image Date set 7(CT and MRI)
Standard deviation Entropy Correlation Coefficient Grey Average Mutual Information
47.58 4.90 0.9949 0.0079 2.19
40.11 3.37 0.91 0.008
3.43
46.11 3.74 0.84 0.0065
3.112
32.22 6.44 0.993 0.0164
C = L - LB LB (1)
Where, L represents the local luminance and LB represents the local background luminance. Consider two perfectly registered MRI and SPECT image, the proposed image fusion approach consists of the following steps: Perform - level Non-subsampled contourlet transform on the MRI image and SPECT image. Further, one low frequency component and a number of high-frequency images are obtained at each level and direction represented by θ,
A= Cℓ A, Cl,θ A
B= {Cℓ B, Cl,θ B} (2)
Where, Cℓ * represents the low frequency components of the source images and Cl,θ* represents the high frequency components decomposed at various levels between the interval l € [1, ℓ] oriented with the direction component θ. Low frequency coefficients of the decomposed source sub-images represents the approximated frequency components of the MRI and SPECT images. The easiest
method used is the conventional averaging methods that results in fused images. But the traditional averaging methods used will not produce better contrast in the fusion results obtained as the source images used are of high quality. Hence averaging methods on high quality medical images produce reduce contrast. To enhance image contrast, the concept of phase congruency is utilized in extracting features from the decomposed low frequency sub-images. In phase congruency low frequency components are extracted followed by performing fusion of the extracted low frequency components. MRI and SPECT images usually contain high frequency components. High frequency sub-image components always contain noise sources that leads to reduction in sharpness of the fused image thereby decreasing the fusion performance. High frequency sub image components are extracted using directive contrast method. The proposed method is more suitable for multispectral images as well as panchromatic images. If panchromatic images are used the fused image is further converted to RGB model colour image. The fusion block diagram is represented in figure 6.
Imaging Modalities Statistical Parameters
Weighted
Average Method PCA Gradient Pyramid
Discrete Wavelet Transform
Image Data set 1 (CT and MRI)
Standard deviation Entropy Correlation Coefficient Grey Average Mutual Information
48.64 4.90 0.9949 0.0079 2.19
41.92 3.37 0.91 0.008 3.43
45.36 3.74 0.84 0.0065
3.112
30.44 6.44 0.993 0.0164
2.65
Image Date set 2 (CT and MRI)
Standard deviation Entropy Correlation Coefficient Grey Average Mutual Information
45.55 3.91 0.9949 0.0079 1.99
42.33 2.32 0.91 0.008 3.43
45.36 3.88 0.84 0.0065
3.112
31.21 6.25 0.993 0.0164
2.65
Image Date set 3 (CT and MRI)
Standard deviation Entropy Correlation Coefficient Grey Average Mutual Information
48.64 4.90 0.9949 0.0079 1.23
41.92 3.37 0.91 0.008 3.03
45.36 2.74 0.84 0.0065
3.23
30.44 6.54 0.993 0.025 2.8
Image Date set 4 (CT and MRI)
Standard deviation Entropy Correlation Coefficient Grey Average Mutual Information
45.55 3.91 0.9949 0.0079 2.55
42.33 2.32 0.91 0.008 3.12
45.36 3.88 0.84 0.0065
3.22
31.21 6.25 0.993 0.0164
250 Figure 6: Block diagram of NSCT based Image Fusion
The loss of prominent features from the fused images that resulted in weighted averaging method is overcome by using pyramidal methods in discrete wavelet transform. But the results obtained using discrete wavelet transforms have reduced contrast which greatly becomes a hindrance since medical image fusion is used in diagnosis which is the reason for moving ahead with multi resolution based algorithms to enhance contrast. Among the multi-resolution algorithms available, non-subsampled contourlet transform produces better fusion results because NSCT focuses on geometrical angle of the input images thereby improving localization, variance and direction. The proposed non-subsampled contourlet transform based image fusion uses shift-invariant decomposition which improves the image quality around the edges of the fused images than the traditional NSCT fusion that uses pseudo-Gibbs method for performing image fusion. The performance of the proposed method is also compared with the traditional NSCT based image fusion techniques previously available.
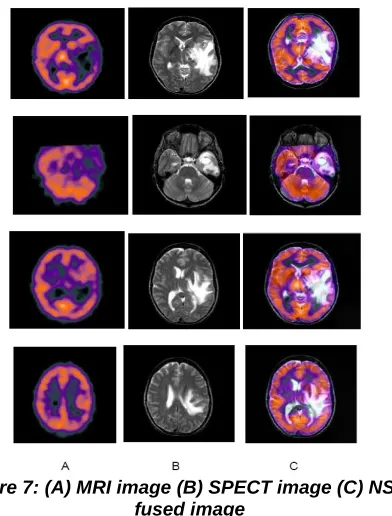
Figure 7: (A) MRI image (B) SPECT image (C) NSCT fused image
Fusion results produced through non-subsampled contourlet transform as shown in fig 6.9(C) do not exhibit artifacts since it is shift invariant in contrast with the results produced through discrete wavelet transform which uses decimation. The non-subsampled contourlet transform can effectively capture the image edges along one dimensional contour with few coefficients. The proposed non-subsampled contourlet transform based image fusion uses shift-invariant decomposition which improves the image quality around the edges of the fused images than the traditional NSCT fusion that uses pseudo-Gibbs method for performing image fusion. The performance of the proposed method is also compared with the traditional NSCT based image fusion techniques previously available.
6. CONCLUSION
This chapter summarizes on the primitive pixel-level image fusion algorithms and proposed feature-level image fusion algorithms presented in this research work. In the proposed image fusion algorithms, discrete wavelet transforms and Non-Subsampled Contourlet Transform are used for fusing medical images of different modalities. Image fusion is significantly being used in diagnosis of diseases. Recently, many algorithms have been developed in this field for enhanced image fusion. Current trend involves the use of multi-resolution transformation with existing fusion rules. With reference to the literature reviews, it is clear that a combination of a multi-resolution image fusion algorithm with intelligent decision making techniques improve performance. Multi-modal medical image fusion focuses on integrating complementary information contained in various source images by generating a composite image for visualization, which can help physicians make better decisions for various purposes.
REFERENCES
[1]. Bhuvaneswari Balachander and D. Dhanasekaran, ―Comparative Study Of Image Fusion Techniques In Spatial And Transform Domain, ARPN Journal of Engineering and Applied Sciences, VOL. 11, NO. 9, pp 5779 – 5783, May 2016.
[2]. H.B.Mitchell,‖ Image Fusion Theories Techniques and Applications,‖Springer, Feburary 2010. [3]. Shilpa, Nishant Jakhar, Prabhneet Kaur, ―A Fuzzy
Effective Approach to Perform Image Fusion on Medical Images,‖ International Journal of Computer Science and Information Technologies, Vol. 6 (3), pp 2168-2171, 2015.
[4]. Yoonsuk Choi*, ErshadSharifahmadian, Shahram ―Quality Assessment of image fusion methods in Transform Domain,‖ International Journal on Information Theory (IJIT), Vol.3, No.1, pp 7-18, January 2014
[5]. Ujwala Patil, Uma Mudengudi, ―Image fusion using hierarchical PCA,‖ International Conference on Image Information Processing, ICIIP 2011. [6]. A. P. James, B. V. Dasarathy, ―Medical Image
Fusion: A survey of the state of the art, ―Information Fusion, 2014.
Analysis, ―Defence Science Journal, Vol. 58, No. 3, pp 338-352 May 2008.
[8]. Zhi-hai Xu, Ling-xiang Liu, Lei Tong, Lin-hong Zhou, Chao-min Chen, ―Wavelet medical image fusion algorithm based on local area Feature,‖ Biological and Biomedical Reports, 2(1), pp 25-31, 2012.
[9]. Ivan W. Selesnick, Richard G. Baraniuk, and Nick G. Kingsbury, ―The Dual-tree complex wavelet transform,‖ IEEE Signal Processing Magazine, pp 123- 151, November 2005.
[10]. Kiran Parmar and Rahul Kher, ―A Comparative Analysis of Multimodality Medical Image Fusion Methods, ―2012 Sixth Asia Modelling Symposium, pp 93- 97, 2012.
[11]. Manu V T and Philomina Simon, ―A Novel Statistical Fusion Rule For Image Fusion And Its Comparison In Non Subsampled Contourlet Transform Domain And Wavelet DomainThe International Journal of Multimedia & Its Applications (IJMA) Vol.4, No.2, pp 69-87,April 2012.
[12]. Zhihui Wang, Yang Tie, Yueping Liu, ―Design and Implementation of Image Fusion System, ―2010 International Conference on Computer Application and System Modeling (ICCASM 2010),pp 140-143, 2010.
[13]. P.Saichand, A.Swetha, ―Microblaze Architecture Development for Medical Image Fusion Using Wavelet Transform,‖ Int. Journal of Engineering Research and Applications, Vol. 3, Issue 5, pp 1182-1184, Sep-Oct 2013.
[14]. Jagalingam P, Arkal Vittal Hegde,―A Review of Quality Metrics for Fused Image,‖ Aqatic Procedia(4),pp 133-142, 2015.
[15]. M. Fallah Yakhdani , A. Azizi,‖quality assessment of image fusion techniques for multisensory High resolution satellite images (case study: irs-p5 and irs-p6 Satellite images),‖ ISPRS TC VII Symposium – 100 Years ISPRS, Vienna, Austria, IAPRS, Vol. XXXVIII, Part 7B, pp 204-209, July 5– 7, 2010
[16]. CHEN Rong,‖ The analysis of image fusion based on improved Brovery transform,‖ International Industrial Informatics and Computer Engineering Conference, pp 1132-1134, 2015.