Pharmacophore 2016, Vol. 7 (5), 276-287 USA CODEN: PHARM7 ISSN 2229-5402
Pharmacophore
(An International Research Journal)
Available online at http://www.pharmacophorejournal.com/
Original Research Paper
FORMULATION OF OLMESARTAN BY SURFACE MODIFICATION
TECHNOLOGY FOR ENHANCING THE SOLUBILITY AND DISSOLUTION
PROPERTIES
Pankaj Vishwakarma
* and Nalini S. Kurup
Department of Pharmaceutics, Prin. K. M. Kundnani College of Pharmacy, Cuffe Parade,
Colaba, Mumbai-400005, India
ABSTRACT
The aim of this study was to improve aqueous solubility of poorly water soluble drugs by a modified porous starch as solid dispersion carrier. The yield of the porous starch was found to be 80%. There was possible interaction between prepared porous starch and olmesartan in the solid state, as confirmed by FT-IR spectra and. DSC thermograms. Drug content of all the formulations were found to be in the range between 97-100%. The dissolution profile showed that in solid dispersions prepared by physical mixing process and solvent evaporation method, the dissolution of pure olmesartan is high in comparison with the solid dispersion samples. Whereas in solid dispersions prepared by solvent evaporation method, dissolution of pure Olmesartan is very low in comparison with the solid dispersion samples of drug with porous starch due to co-habitation of carriers with olmesartan that improved the dissolution rate of the drug. The predicted drug release mechanism for solvent evaporation method was by peppas model where the drug release could be by diffusion process. Thus this study confirmed that a porous starch can be developed and utilized as a carrier to improve the aqueous solubility of poorly water soluble BCS class II drugs thereby improving its dissolution rate and bioavailability.
Keywords:
Poor solubility, Olmesartan, Porous starch, Solid dispersion, Solubility enhancement.INTRODUCTION
More than 40% of active substances during formulation development by the pharmaceutical industry are poorly water soluble (Martinez et al., 2002). Poor water solubility is associated with poor dissolution characteristics. Dissolution rate in the gastrointestinal tract is the rate limiting factor for the absorption of these drugs, and so they suffer from poor oral bioavailability (Amidon et al., 1995). For BCS class II-drugs, the dissolution rate is the limiting factor for the drug absorption rate (Lobenberg et al., 2000). An enhancement in the dissolution rate of these drugs can increase the blood-levels to a clinically suitable level. The increasing frequency of poorly soluble new chemical entities exhibiting therapeutic activity is a major concern to the
Pankaj Vishwakarma et al. / Pharmacophore 2016, Vol. 7 (5), 412-423 and helical amylose and the branched
amylopectin. Depending on the plant, starch generally contains 20 to 25% amylose and 75 to 80% amylopectin. Porous starch is a biodegradable starch that has great potential as a solid dispersion carrier for oral poorly water soluble drugs.
MATERIALS AND METHODS
Olmesartan was obtained as a gift from Cipla Pvt. Ltd, Mumbai. Starch was purchased from Swastik pharmaceuticals, Mumbai. Ethanol and acetone were purchased from S.D. Fine chemicals, Mumbai. All other reagents used were of AR grade.
Phase-Solubility Analysis
An excess amount of Olmesartan (15 mg) was added to 10 mL of deionized water containing increasing amounts of PVP K30 ranging from 0.01-0.5%. The resulting mixture was equilibrated by placing the flasks on the rotary shaker at room temperature for 48 hrs at 150 rpm. To minimize photochemical degradation flasks were covered with aluminum foil. Then, suspensions were filtered through Whatman filter paper (grade 1, 110 mm diameter) to remove undissolved solids. An aliquot from each vial was adequately diluted and spectrophotometrically analyzed for Olmesartan at 256 nm. Shaking was continued until three consecutive experiments yielded similar results.
Preparation of Porous Starch
Porous starch was prepared by the method reported earlier with some modifications. A 10%w/w of starch was prepared in hot water, heated to 100ºC for 30 minutes under constant stirring in a reaction vessel. The temperature was then lowered to 85ºC and then poured into a petridish. The resulting slurry was kept in a refrigerator overnight to facilitate gelation. The gelled product was scrapped and transferred to 50 ml of 90% ethanol and kept for 24 hours in order to maintain the porous structure of gel, whereby ethanol displaced the water in aqua gel. It is then dried in direct sunlight for 2 hours and then kept in vacuum drier, which is maintained at 60ºC for
passed through sieve no.60 and stored in a dessicator till further use.
Characterization of Prepared Porous Starch Solubility
Solubility of porous starch was tested in water, aqueous buffers of pH 1.2, 4.5, and 7.4 and organic solvents such as alcohol, dichloromethane, chloroform, acetone and petroleum ether.
pH
The pH of 1% w/v slurry was measured using a digital pH meter.
Melting Point
Melting point was determined by using melting point apparatus.
Viscosity
Viscosity of 1% dispersion in water was measured using Brookfield viscometer (Model DV-II) spindle no.2 at varying rpm.
Test For Gelling Property
The gelling property was evaluated by heating 1% w/v dispersion in water at 100°C for 30 min.
Particle Size
The particle size was determined using optical microscope (Olympus LITE image). Sample powder was taken on a slide and spread into a thin film. A total of 100 particles are counted and their size is determined. The average particle size in micrometers was determined.
Surface Morphology
The surface morphology of the prepared starch was determined using SEM (scanning electron microscope).
Preparation of Solid Dispersions
Solid dispersions of Olmesartan with the prepared porous starch were prepared by following methods.
Solid Dispersions Prepared By The Solvent Evaporation Method
Pankaj Vishwakarma et al. / Pharmacophore 2016, Vol. 7 (5), 412-423 under reduced pressure at 60°C in a dessicator.
Subsequently, a uniform mixture was obtained that was sieved and stored in glass vials at room temperature until use.
Solid Dispersions Prepared By Physical Mixing Method
Solid dispersion of Olmesartan was prepared in the ratio of 1:1 and 1:2 by physically mixing both carrier and drug using a glass mortar and pestle thoroughly until a uniform mixture is obtained. The mixture obtained was passed through sieve no.100 and stored in a glass vial until use.
Solid Dispersions Prepared By Kneading Method Solid dispersions of Olmesartan were prepared in the ratio of 1:1 and 1:2. Required quantity of starch was taken in a mortar. To this 5ml of 50 % alcohol was added and triturated to form a paste. Then, drug is added slowly into the paste and triturated continuously for 1 hour. The paste was air dried at 25º C for 12 hours. The mixture was then size reduced by passing through sieve no.100 and stored in a glass vial until use.
Evaluation of Solid Dispersions
Fourier Transform Infrared Spectroscopy (FTIR) FTIR Spectroscopy was performed on each of the samples to determine the structure of the organic compounds and to identify the presence of specific functional groups within a sample. FT-IR spectra were recorded using an FT-IR spectrophotometer (Shimadzu) and examined in the transmission mode. The samples (Olmesartan) were ground to a fine powder using agate mortar & pestle and transparent discs formed using a pellet press and mixed thoroughly with potassium bromide, an infrared transparent matrix, at 1:10 (Sample: KBr) ratio, respectively. The discs were placed in FTIR spectrophotometer apparatus and spectra were recorded. Forty scans were obtained at a resolution of 4 cm-1, from 4000 to 400 cm-1.
Differential Scanning Calorimetric Analysis
The pure drug, porous starch and physical mixtures of drug and porous starch were subjected for DSC studies using differential scanning calorimeter (Mettler-7, Germany). 5mg of samples were weighed into aluminium pans and sealed and the samples were run at a heating
rate of 10°/min over a temperature range of 25- 300° in atmosphere of nitrogen.
Drug Content Estimation
The percent drug content of microcrystals was estimated by dissolving 150 mg quantities of microcrystals in methanol, mixing thoroughly by shaking, and the making up volume to the mark with the solvent (0.1 N HCl). The solution was filtered and the filtrate was diluted suitably with 0.1 N HCl pH 1.2 and analyzed at 244 nm using UV-Vis spectrophotometer (Aruna et al., 2011).
In-Vitro Dissolution Studies
Dissolution studies were carried out using the rotataing basket method (USP apparatus II). Solid dispersions equivalent to 100 mg of pure drug were filled into the capsules (size no:1) and placed in the baskets that is immersed in 900 ml of pH 7.4 phosphate buffer as dissolution medium, maintained at 37±0.5ºC and rotated at 100rpm. At designated time intervals, 5 ml samples were withdrawn, and replaced with 5 ml of fresh dissolution medium. The samples were filtered, diluted suitably and analyzed spectrophotometrically at 320 nm using pH 7.4 phosphate buffer as blank. The dissolution experiments were performed for pure drug also in triplicate for each sample. The same dissolution study was carried out for a marketed product as well to compare the drug release profile of the prepared formulations.
Kinetic Modeling Of Drug Release Mechanism The dissolution data of all formulations were fitted to zero-order, first-order, Hixson-Crowell, Higuchi and Korsemeyer and Peppas models to predict the drug release mechanism.
RESULTS AND DISCUSSION
Solvent exchange method was used to prepare this modified porous starch, where alcohol used as exchange solvent to avoid contraction and collapse of aqua gel due to direct air drying. The yield of the porous starch was found to be 80%.
Phase Solubility Study
Pankaj Vishwakarma et al. / Pharmacophore 2016, Vol. 7 (5), 412-423 Connors. The phase solubility diagram showed a
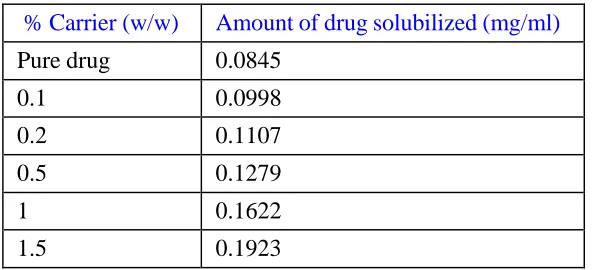
linear increase in drug solubility with an increase in the concentration of the carrier. Hydrophilic carriers mainly interact with drug molecules by electrostatic bonds, even though other forces like such as Vander Waals forces and hydrogen bonds may also play a role in the drug-carrier interaction. Drug solubility increased linearly with increasing concentration of carrier, indicating an AL-type phase solubility diagram.
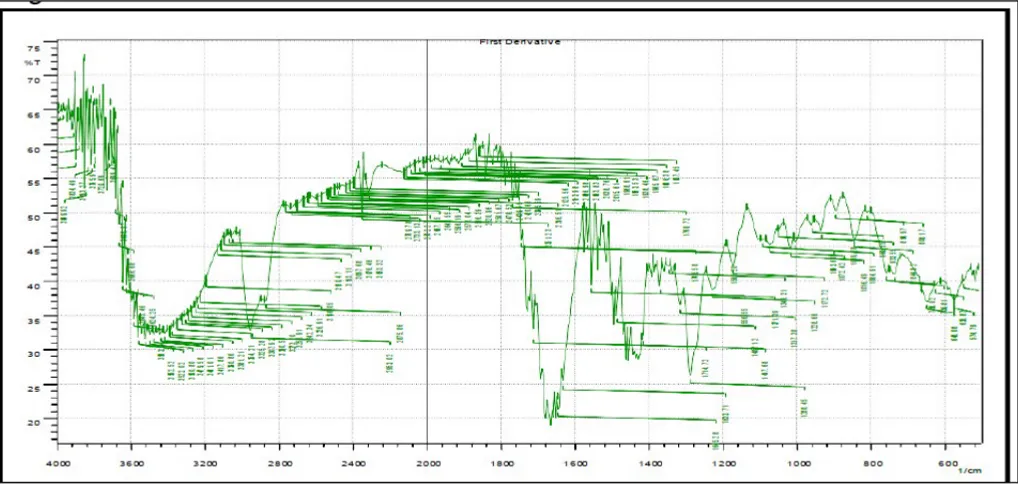
Fourier Transform Infrared Spectroscopy (FTIR)
All the characteristic peaks representing respective functional groups for Olmesartan are present in the spectra of the formulation. No additional peak was found in the above spectrum which indicates that there is absence of any incompatibility between Olmesartan and porous starch (Fig.2 and Fig.3)
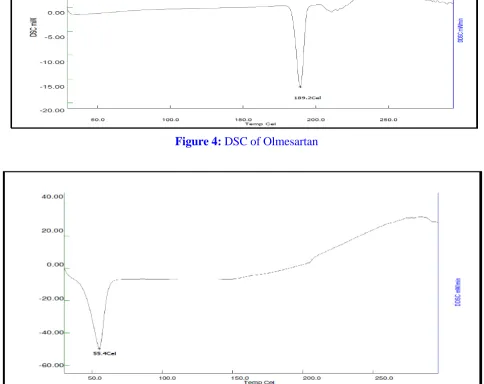
Differential Scanning Calorimetry (DSC)
DSC is a highly useful means of detecting drug- excipient interactions. Thermal behavior of Olmesartan and the physical mixture of OLM and Porous starch were studied using DSC. DSC thermogram of Olmesartan showed an endotherm at 186.70°C (Fig.4). Broad peak was observed for Carrier at 55.4 °C (Fig.5) respectively. The thermogram of the physical mixture of carrier and Olmesartan (Fig.16) almost the overlapped each individual component, except for some slight differences, and showed the peak of carrier at 95.81°C, and integrated peak of Olmesartan at 184.75°C. The area under the curve for the
Phase Solubility Analysis
Olmesartan thermogram in physical mixtures (Fig.6) was less compared to that of Olmesartan alone. This may be due to the melting of the carrier and its interaction with Olmesartan.
In Vitro Dissolution Study
The in vitro dissolution data showed that 66-89% of the drug was dissolved in 90 minutes, and there was increase in the dissolution of drug in formulations compared to the pure form. The batch 1:2 accounted for maximum yield and in turn resulted as the batch that gave a % cumulative release (% CR) of 89.08% as compared to the pure drug which gave 40.436% release (Fig.7). Formation of partially amorphous olmesartan during crystallization as seen from could also be a minor factor involved in dissolution enhancement. The successfully formulated solid dispersion led to a better solubility profile of the drug in its amorphous form when compared to its pure form. The saturation solubility of Olmesartan and porous starch showed an 84-fold enhancement over pure drug. The DSC pattern of the drug and formulation confirmed that the crystalline nature of the drug remained changed into amorphous form. The enhanced dissolution profile of drug attributed to the increased wettability of the drug in the formulation and formation of a hydrophilic surface. In conclusion, it can be stated that solid dispersion technology is a promising strategy to increase the solubility and dissolution rate of poorly soluble drugs.
Table 1: Phase solubility analysis using modified porous starch as a carrier
% Carrier (w/w) Amount of drug solubilized (mg/ml)
Pure drug 0.0845
0.1 0.0998
0.2 0.1107
0.5 0.1279
1 0.1622
Pankaj Vishwakarma et al. / Pharmacophore 2016, Vol. 7 (5), 412-423
Figure 1: Phase solubility analysis using modified porous starch as a carrier
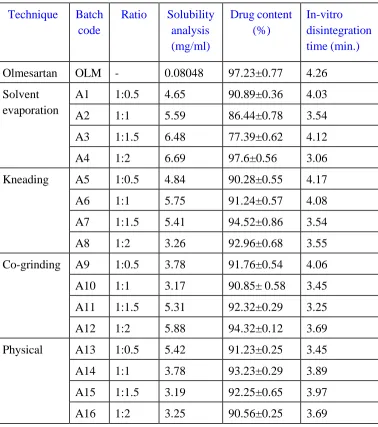
Table 2: Amount of ingredient used for formulation of Solid dispersion
Technique Batch code
Ratio Solubility analysis (mg/ml)
Drug content (%)
In-vitro disintegration time (min.)
Olmesartan OLM - 0.08048 97.23±0.77 4.26
Solvent evaporation
A1 1:0.5 4.65 90.89±0.36 4.03
A2 1:1 5.59 86.44±0.78 3.54
A3 1:1.5 6.48 77.39±0.62 4.12
A4 1:2 6.69 97.6±0.56 3.06
Kneading A5 1:0.5 4.84 90.28±0.55 4.17
A6 1:1 5.75 91.24±0.57 4.08
A7 1:1.5 5.41 94.52±0.86 3.54
A8 1:2 3.26 92.96±0.68 3.55
Co-grinding A9 1:0.5 3.78 91.76±0.54 4.06
A10 1:1 3.17 90.85± 0.58 3.45
A11 1:1.5 5.31 92.32±0.29 3.25
A12 1:2 5.88 94.32±0.12 3.69
Physical A13 1:0.5 5.42 91.23±0.25 3.45
A14 1:1 3.78 93.23±0.29 3.89
A15 1:1.5 3.19 92.25±0.65 3.97
Pankaj Vishwakarma et al. / Pharmacophore 2016, Vol. 7 (5), 412-423
As seen from the above tabular data, solubility of Olmesartan corresponds to 0.08048 mg/ml. Solubility analysis of all the solid dispersion batches prepared showed an increase in solubility of the drug Olmesartan present in the formulations when compared to its pure form. The batch A4 showed a 74-78 folds enhancement in solubility analysis. All the batches prepared above were evaluated for % drug content which was observed to be in the range from 77-99 % .As seen from above tabular data, we concluded that the batch with code no A4 were selected as optimized batch and it was further carried out for the other evaluation parameter. The in vitro disintegration time for all the batches was between ~3-4.17 minute.
Figure 2: FTIR of pure drug
Pankaj Vishwakarma et al. / Pharmacophore 2016, Vol. 7 (5), 412-423 Table 3: Comparison of IR spectra of pure drug and formulation
All the characteristic peaks representing respective functional groups for Olmesartan are present with slight shifts in the spectra of the formulation. No additional peak was found in the above spectrum which indicates that there is absence of any incompatibility between Olmesartan and Carrier.
Figure 4: DSC of Olmesartan
Pankaj Vishwakarma et al. / Pharmacophore 2016, Vol. 7 (5), 412-423
Figure 6: DSC thermogram of A4 batch Drug :Carrier (1:1)
DSC thermogram of the porous starch solid dispersion (fig.6) reveals the characteristic absence of the melting peak of Olmesartan at 189.2°C. Changes in the melting characteristics of Olmesartan in the formulation were found. This phenomenon can be assumed as a proof suggesting that Olmesartan got completely solubilized with the porous starch and hydrotropes indicating the formation of an amorphous entity.
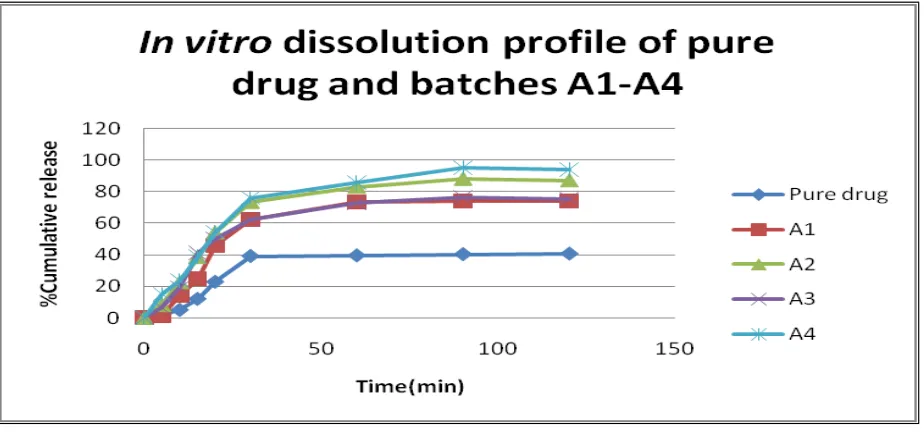
Dissolution Study for Solid Dispersion
Table 4: Dissolution profile of batches A1-A4 and OLM
Time (min) Pure drug A1 A2 A3 A4
0 0 0 0 0 0
5 1.145±0.18 1.2685±0.63 8.1942±0.73 6246±0.65 14.965±0.82
10 5.069±0.39 14.19±0.57 22.662±0.29 19.088±0.37 23.554±0.43
15 12.069±0.54 24.634±0.25 38.674±0.74 41.25±0.52 38.725±0.74
20 22.923±0.8 45.977±0.33 54.46±0.34 50.07±0.64 54.36±0.55
30 39.274±0.62 62.45±0.38 73.69±0.58 61.24±0.49 76.017±0.36
60 39.645±0.43 73.268±0.83 83.368±0.64 72.891±0.28 85.788±0.35
90 40.436±0.31 74.02±0.45 88.478±0.46 76.35±0.33 95.298±0.78
120 40.773±0.54 74.077±0.26 87.56±0.54 75.262±0.31 94.08±0.75
Pankaj Vishwakarma et al. / Pharmacophore 2016, Vol. 7 (5), 412-423 Table 5: Dissolution profile of batches A5-A9
Time (mins) A5 A6 A7 A8 A9 A10
0 0 0 0 0 0 0
5 10.697±0.44 5.454±0.32 9.22±0.27 11.29±0.23 11.451±0.45 11.54±0.2
10 22.525±0.58 9.12±0.29 13.113±0.36 24.582±0.82 19.251±0.26 20.65±0.6
15 35.13±0.35 12.326±0.45 18.016±0.56 35.26±0.34 27.068±0.69 28.96±0.3
20 49.41±0.29 18.528±0.62 26.233±0.41 39.754±0.24 39.268±0.28 40.65±0.4
30 67.93±0.73 23.74±0.48 31.882±0.35 46.08±0.7 43.315±0.28 44.29±0.5
60 75.436±0.65 31.376±0.35 34.52±0.44 48.565±057 54.48±0.41 56.98±0.5
90 81.96±0.43 34.76±0.37 42.731±0.32 51.102±042 57.768±0.58 57.36±0.6
120 81.66±0.76 31.666±0.55 40.948±0.63 51.84±0.34 55.451±0.22 57.69±0.8
*Values expressed as Mean±S.D.
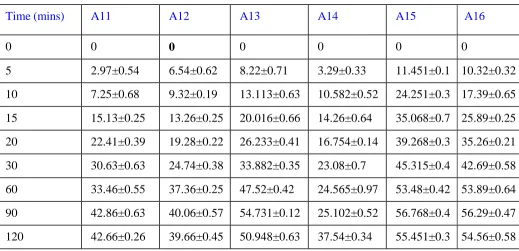
Table 6: Dissolution profile of batches A11-A16
Time (mins) A11 A12 A13 A14 A15 A16
0 0 0 0 0 0 0
5 2.97±0.54 6.54±0.62 8.22±0.71 3.29±0.33 11.451±0.1 10.32±0.32
10 7.25±0.68 9.32±0.19 13.113±0.63 10.582±0.52 24.251±0.3 17.39±0.65
15 15.13±0.25 13.26±0.25 20.016±0.66 14.26±0.64 35.068±0.7 25.89±0.25
20 22.41±0.39 19.28±0.22 26.233±0.41 16.754±0.14 39.268±0.3 35.26±0.21
30 30.63±0.63 24.74±0.38 33.882±0.35 23.08±0.7 45.315±0.4 42.69±0.58
60 33.46±0.55 37.36±0.25 47.52±0.42 24.565±0.97 53.48±0.42 53.89±0.64
90 42.86±0.63 40.06±0.57 54.731±0.12 25.102±0.52 56.768±0.4 56.29±0.47
120 42.66±0.26 39.66±0.45 50.948±0.63 37.54±0.34 55.451±0.3 54.56±0.58
Pankaj Vishwakarma et al. / Pharmacophore 2016, Vol. 7 (5), 412-423
Figure 7: Release profile of batches A1-A4 and OLM
Pankaj Vishwakarma et al. / Pharmacophore 2016, Vol. 7 (5), 412-423
The data represented above showed that above 50% of the drug was dissolved in 20 mins and there was increase in the dissolution of drug in formulations compared to the pure form. The batch A 4 accounted for maximum yield of the drug solid dispersion and in turn resulted as the batch that gave % cumulative release (%CR) of 95.298% as compared to pure drug that gave 40.776% release. The drug solid dispersion prepared with porous starch exhibited better dissolution rate when compared with plain drug, which indicates the deposition of polymer on the drug surface. This results in increase in surface free energy leads to fast release.
DISCUSSION
The successfully formulated solid dispersion led to a better solubility profile of the drug in its amorphous form when compared to its pure form. The saturation solubility of Olmesartan and porous starch showed an 84-fold enhancement over pure drug. The DSC pattern of the drug and formulation confirmed that the crystalline nature of the drug remained changed into amorphous form. The enhanced dissolution profile of drug attributed to the increased wettability of the drug in the formulation and formation of a hydrophilic surface. In conclusion, it can be stated that solid dispersion technology is a promising strategy to increase the solubility and dissolution rate of poorly soluble drugs.
REFERENCES
1. Bindu, MB; Kusum, B and Banji, D (2010), “Novel strategies for poorly water soluble drugs”, Int J Pharm Sci Rev Res, 4, 76-84.
2. Chawla, G and Bansal, AK (2007), “A comparative assessment of solubility advantage from glassy and crystalline forms of a water-insoluble drug”, Eur J Pharm Sci, 32, 45–57.
3. Keraliya, RA; Tejal, G; Soni, B; Vaishali, T; Thakkar, B; Tejal, R; Gandhi, B; Rajanikant, C and Patel, A (2010), “Formulation and Physical characterization of microcrystals for dissolution rate enhancement of Tolbutamide”, Int J Res Pharm Sci, 1, 69-77.
4. Amidon, GL; Lunnernas, H; Shah, VP and Crison, JR (1995), “A theoretical basis for a biopharmaceutical drug classification: the correlation of in vitro drug product dissolution and in vivo bioavailability”, Pharm Res,12, 413–420.
5. Higuchi, T and Connors, K (1965), “Phase solubility techniques”, Adv Anal Chem Instrum, 4, 117- 123.
6. Aruna, MS; Babu, AK; Thadanki, M and Gupta, ME (2011), “Solid dispersion- An approach to enhance the dissolution rate of Olmesartan”, Int J Res Pharm Chem, 1,780-788.
7. Cirri, M; Mura, P; Rabasco, AM; Gines, JM; Moyano, JR and Gonzalez- Rodriguez, ML (2004), “Characterization of Ibuproxam Binary and Tertnary Dispersions with Hydrophilic carriers”,
Drug Dev Ind Pharm, 30, 65-74.
8. Lobenberg, R and Amidon, GL (2000), “Modern bioavailability, bioequivalence and biopharmaceutics classification system. New scientific approaches to international regulatory standards”, Eur J Pharm Biopharm, 50, 3–12.
9. Patel, J; Patel, A; Raval, M and Sheth, N (2011), “Formulation and development of a selfnano emulsifying drug delivery system of olmesartan”, J Adv Pharm Tech Res, 2, 9-16.
10.Martinez, M; Augsburger, L; Johnston, T and Jone,s WW (2002), “Applying the biopharmaceutics classification system to veterinary pharmaceutical products. Part I. Bio-pharmaceutics and formulation considerations”, Adv Drug Delivery Rev, 54, 805–824.
11.Marcilio, SS; Cunha-Filho, Pacheco RM and Landin, M (2008), “Dissolution rate enhancement of the novel antitumoral β- lapachone by solvent change precipitation of microparticles”, Eur J Pharm Biopharm, 69, 871–877.
Pankaj Vishwakarma et al. / Pharmacophore 2016, Vol. 7 (5), 412-423
13.Mahapatra, A (2011), “Dissolution enhancement and physicochemical characterization of Valsartan in solid dispersions with β-CD, HP β-CD, and PVP K-30”, Disso Tech, 6, 39-45.
Correspondence Author:
Pankaj Vishwakarma
*
Department of Pharmaceutics, Prin. K. M. Kundnani College of Pharmacy, Cuffe Parade, Colaba, Mumbai-400005, India