Devanshi et al. World Journal of Engineering Research and Technology
A REVIEW ON TEXT DATA MINING OF CARE LIFE LOG USING
KEY GRAPH
*1Devanshi Nayak and 2Dr. Avinash Sharma
1
M. Tech. Scholar, CSE, MITS Bhopal.
2
A.P. & HOD, CSE, MITS Bhopal.
Article Received on 22/11/2019 Article Revised on 12/12/2019 Article Accepted on 02/01/2020
ABSTRACT
Data Mining is a method that requires analyzing and exploring large
blocks of data to glean meaningful trends and patterns. In today’s
period, every person on earth relies on allopathic treatments and
medicines. Data mining techniques can be applied to medical databases
that have a vast scope of opportunity for textual as well as visual data. Care Life Log is used
to integrate and analyze the level of care required. There are five levels of care, with Level 1
vocabulary including recreation, toilet, morning, afternoon, etc. The level of care gradually
increases from Level 1 to Level 5, which has vocabulary that includes tube, danger,
treatment, removal, and discovery. The higher the level, the worse the health condition and
therefore the greater care required. These levels allow for a clear analysis of a patient’s
condition. This analysis has led to an improvement in Quality of Life as well as a decrease in
mismatches between the level of care required for patients and the level of care given by care
takers. The qualitative analysis result of in-patient nursing records used a text data mining
technique to achieve the initial goal: a visual record of such information. The analysis
discovered vocabularies relating to proper treatment methods and concisely summarized their
extracts from in-patient nursing records. Important vocabularies that characterize each
nursing record were also revealed. The results of this research will contribute to nursing work
evaluation and education. This research used a text data mining technique to extract useful
information from nursing records within Electronic Medical Records.
World Journal of Engineering Research and Technology
WJERT
www.wjert.org SJIF Impact Factor: 5.924
*Corresponding Author
Devanshi Nayak
M. Tech. Scholar, CSE,
KEYWORDS: Text Data Mining, Care Life Log, Nursing Records, Qualitative Analysis, Electronic Medical Records, Visualization.
1. INTRODUCTION
Text data mining resembles data mining because it extracts useful knowledge and
information by analyzing the diversified viewpoints of written data.[1] Recently, interest has risen in text data mining because it uncovers useful knowledge buried in a large amount of
accumulated documents.[2] Research has started to apply text data mining to medicine and healing.[3] In addition, the speed of electronic medical treatment data is accelerating because of the rapid informationization of medical systems, including EMRs. Recently, research on
data mining in medical treatment that aims for knowledge and pattern extraction from a huge
accumulated database is increasing. However, many medical documents, including EMRs
that describe the treatment information of patients, are text information. Moreover, mining
such information is complicated. The data arrangement and retrieval of such text parts
become difficult because they are often described in a free format; the words, phrases, and
expressions are too subjective and reflect each writer.[4] Perhaps in the future, the text data mining of documents will be used for lateral retrieval, even in the medical treatment world,
not only by the numerical values of the inspection data but also by computerizing
documents.[5] In this present study, to classify the vast amount of Care Life Log data that occurs in nursing in one Miyazaki Hospital Long-term Health Care Facility by level of care
required, text data mining was carried out using Key Graph.
Then this information was visualized.
2. Care Life Log and the Level of Care Required
Care Life log records a period of 24 hours of the caregiver’s activity. It is also utilized as a
long-term service content record. The recording itself is not the main purpose, but it transmits
information to others, accumulates and analyzes data, and aims to connect the service to
better care. The level of care required is categorized as Standard Support 1 and 2, and
Essential Support 1, 2, 3, 4 and 5. Essential Support 1 indicates that a person can eat and use
the restroom by themselves. Essential Support 5 indicates a person is mostly unable to do
these things by themselves. Essential Support Levels are outlined below:
(1) Level 1: He or she needs care by others when performing complex actions or moving.
(2) Level 2: The same conditions as Level 1 with the addition of needing some assistance
when eating or using the restroom.
(3) Level 3: The patient cannot use the restroom by themselves and needs assistance
performing any action indicated by Level 2.
(4) Level 4: The patient can hardly use the restroom or perform any action indicated in Level
3.
(5) Level 5: The patient can hardly eat or use the restroom and needs assistance with almost
all actions.
3. EMR
The text data in EMR consist of paper notations about inspection reports, in-patient care
plans, nutrition management plans, bedsore-prevention plans, fall checks, operation notes,
and summaries. The doctor fills in the passage record and the nurses fill in the nursing
records, which include the life and inspection history of a patient. The care life log also has
small notes about reservations etc. Since no guidelines exist about recording text, ambiguous
feelings or impressions are sometimes included. Care workers remember or take notes about
what their patients say while working and later input them into the EMR.
There are four recording categories:
(1) Subjective data (S): Information directly gleaned from patients.
(2) Objective data (O): Objective facts and observations about the patient’s appearance or
state by co-medicals.
(3) Assessment (A): Evaluations and judgments derived from this information and
(4) Plans (P): Future plans and care actually taken.
The care life log, which records the care activities practiced by nurses, contains many notes
about nursing processes. It helps ensure high quality nursing and evaluates nursing practices.
4. Text Data Mining Applications to Medicine
Text data mining is roughly equivalent to text analytics that refers to the process of deriving
high-quality information from texts. It usually structures the input text (often by parsing,
adding derived linguistic features, removing others and insertion into a database), deriving
patterns within the structured data and finally evaluating and interpreting the output. Fig. 1
regarding courses of treatment. One difficulty with applying text data mining to medicine is
the entire process of identifying symptoms for understanding the associated risks while taking
appropriate action.
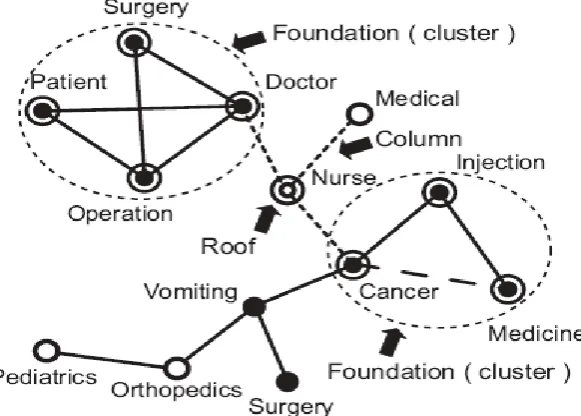
Fig. 1: process of text data mining.
5. Key Graph
Key Graph is applied to the text data mining technique.[6,7] It is also applied for extracting key words.
Example of Key Graph Performance
Figure 2 shows an example when it is applied to text data.
(1) Black nodes indicate items that frequently occur in a data set.
(2) White nodes indicate the items that occur less frequently overall but frequently occur with
●: High frequency terms
○: Connect high frequency “foundations” ◙: Keywords of ●
©: Keywords of ○ “Foundation (Cluster)”
: Mass of black nodes and links
“Roof”: Connect with the “foundation” “Column”: ---
: Significant “roofs” between “foundations”
Solid lines (-): Strongly correlated terms of “foundations”
---: Strongly correlated terms
Fig. 2: Key Graph example when applied to text data.
(3)Double-circled nodes indicate items whose co-occurrence frequency with black nodes is
especially high. Double-circled nodes are considered keywords.
(4)Links indicate that the connected item pair frequently co-occurs in a data set.
(5)Solid lines form a foundation, which dotted lines connect. Foundations, which are circles
of dotted lines, are obtained from the text data.
Key Graph consists of three major components derived from construction metaphors. Each
component is described as follows:
1) Foundations: sub-graphs of highly associated and frequent terms that represent basic
concepts in the data. A foundation is defined as a cluster that consists of black nodes linked
by solid lines. The foundations are underlying common contexts because they are formed by
a set of items that frequently co-occur in the data set.
2) Roofs: terms that is highly associated with foundations.
3) Columns: associations between foundations and roofs that are used for extracting
keywords, i.e., the main concepts in the data. A column is a dotted line that connects
foundations.
Concept of Key Graph Algorithm
Key Graph was originally an algorithm for extracting assertions based on the co-occurrence
graph of terms from text data.
1) Document preparation: Before processing document D, stop words [29] with little meaning
are discarded from, the words in D are stemmed [30], and the phrases in D are specified [31].
Hereafter, a term means a word or a phrase n processed D.
2) Extracting foundations: Graph G for document D is made of nodes representing terms and
links representing the co-occurrence (term-pairs that frequently occur in the same sentences
throughout D). Nodes and links in G are defined as follows:
Nodes: Nodes in G represent high-frequency terms in D because they might appear frequently for expressing typical, basic concepts in the domain. High-frequency terms are a
set of terms above the 30th highest frequency. This set is denoted by HF.
Links: nodes in HF are linked if the association between the corresponding terms is strong.
The association of terms between wi and wj in D is defined as assoc (wi, wj) =
(1)
Where |x|s denotes the count of x in sentence s. Pairs of high-frequency terms in HF are
sorted by assoc and the pairs above the (number of nodes in G) -1th tightest association are
represented in G by links between nodes.
Extracting columns: The probability that term w appears is defined as key (w), and key (w) is defined by
Key (w) = 1 −Πg⊂G [1 – based (w, g) / neighbors (g)], (2)
Based (w, g) = Σs∈D |w|s |g − w|s, (3)
Neighbors (g) =Σs∈D Σ w∈s |w|s |g − w|s. (4)
|g − w|s = {|g|s − |w|s, w ∈ g, (5)
{|g|s, w!∈g
Extracting roofs: The strength of a column between high key term wi and high-frequency term wj ⊂ HF is expressed as
Column (wi, wj) = Σs∈D min (|wi|s, |wj |s). (6)
Columns touching wi are sorted by column (wi, wj) for each high key term wi. Columns with
the highest column values connecting term wi to two or more clusters are selected to create
columns. Terms represented by the nodes of higher values than a certain threshold are
extracted as the keywords for document D.
6. CONCLUSION
In this study, to categorize the huge amount of Care Life Log data that occurs in nursing in
Long-term Health Care Facility by level of care required, text data mining was carried out
using Key Graph. Sentences were analyzed into morphemes, and the relations between
feature vocabularies were analyzed by a text data mining technique to visualize this
information. In addition, this identified vocabularies relating to the proper methods of
treatment, resulting in a concise summary of the vocabularies extracted from the care life log.
Text data mining is expected to become a valuable technique in the analysis of care
documents in the future.
REFERENCES
1. Abe, Y. Ohsawa, H. Kosaku, K. Aira, N. Kuwahara and K. Kogure, “Discovery of
Hidden Factors for Incident by Kamishibai KeyGraph,” The 22nd Annual Conference of
the Japanese Society for Artificial Intelligence, 2008; 2B2-3: 1-4.
2. D.A. Ludwick and J. Doucette, “Adopting electronic medical records in primary care:
Lessons learned from health information systems implementation experience in seven
countries,” International Journal of Medical Information, 2009; 78: 22-31.
3. G. Salton and M. J. McGill, “Introduction to Modern Information Retrieval,”
McGraw-Hill, 1983.
4. H. Abe, S. Hirano and S. Tsumoto, “Evaluation Temporal Models Based on Association
Mining From Medical Documents,” Japan Association for Medical Informatics, 2007;
27(1): 33-38.
5. H. Abe, S. Hirano and S. Tsumoto, “Evaluation Temporal Models Based on Association
Mining From Medical Documents,” Japan Association for Medical Informatics, 2007;
27(1): 33-38.
6. H. Abe, S. Hirano and S. Tsumoto, “Mining a Clinical Course Knowledge from Summary
Text,” The 19th Annual Conference of the Japanese Society for Artificial Intelligence,
2005; 1F4-04: 1-2.
7. H. Ono, K. Takabayashi, T. Suzuki, H. Yokoi, A. Imiya and Y. Satomura, “Classification
of Discharge Summaries by Text Mining,” Japan Association for medical Informatics,
8. J. Cohen, “Language and Document, Automatic Indexing Terms for Abstracting,” Journal
of American Society for Information Science, 1995; 46: 162-174.
9. K. Horie, Y. Ohsawa and N. Okazaki, “Products Designed on Scenario Maps using
Pictorial KeyGraph,” Proceedings of the 5th WSEAS International Confernce on Applied
Computer Science, pp. 801-808, Hangzhou, China, April, 2006.
10.K. Izumi, K. Goto and M. Matsui, “Analysis of Financial Markets' Fluctuation by Textual
Information,” The 23rd Annual Conference of the Japanese Society for Artificial
Intelligence, 2009.
11.K. Izumi, K. Goto and M. Matsui, “Analysis of Financial Markets’ Fluctuation by Textual
Information,” The 23rd Annual Conference of the Japanese Society for Artificial
Intelligence, 2009.
12.K. Tsuda and R. Thawonmas, “KeyGraph for Visualization of Discussions in Comments
of a Blog Entry with Comment Scores,” World Scientific and Engineering Academy and
Society (WSEAS) Trans, Computers, 2005; 12(4): 1794-1801.
13.K. Tsuda and R. Thawonmas, “Visualization of Discussions in Comments of a Blog Entry
Using KeyGraph and Comment Scores,” Proc. Of 4th WSEAS International Conference
on E-ACTIVITIES, Florida, USA, 2005; 5: 21-26.
14.K. Yamamoto, S. Matsumoto, H. Matsuda, H. Tada, A. Matsuyama, K. Yanagihara, S.
Teramukai and M. Fukushima, “Development and Prospects of Data Capture System for Clinical Study by the Secondary Use of Electronic Medical Records,” Japan Association
for medical Informatics, 2007; 27(2): 211-218.
15.Kyung-Joong. Kim, Myung-Chul. Jung and Sung-Bae. Cho, “KeyGraph-based chance
discovery for mobil contents management system,'' International Journal of Knowledge
and Intelligent Engineering System, 2007; 11: 313-320.
16.Kyung-Joong. Kim, Myung-Chul. Jung and Sung-Bae. Cho, “KeyGraph-based chance
discovery for mobil contents management system,” International Journal of Knowledge
and Intelligent Engineering System, 2007; 11: 313-320.
17.M. F. Porter, “An Algorithm for Suffix Stripping,” Automated Library and Informations
Systems, 1980; 14(3): 130-137.
18.M. Kushima, K. Araki, M. Suzuki, S. Araki and T. Nikama, “Analysis and Visualization
of In-patients’ Nursing Record Using Text Mining Technique,” International
MultiConference of Engineers and Computer Scientists (IMECS2011), 2011; 2188:
19.M. Kushima, K. Araki, M. Suzuki, S. Araki and T. Nikama, “Graphic Visualization of the
Co-occurrence Analysis Network of Lung Cancer in-patient nursing record,” The
International Conference on Information Science and Applications (ICISA 2010), pp.
686-693, Seoul, Korea, April, 2010.
20.M. Kushima, K. Araki, M. Suzuki, S. Araki, H. Tamura, K. Tanno, T. Toyama, O.
Ishizuka and M. Ikeda, “Network Visualization of Electronic Medical Record (IZANAMI) by Using Mining Technology,” Technical report of IEICE, vol. 108, no. 388,
CAS2008-97, 2009; 187-192.
21.M. Kushima, K. Araki, M. Suzuki, S. Araki, H. Tamura, K. Tanno, T. Toyama, O.
Ishizuka and M. Ikeda, “Analysis of Nurse’s Medical Record in the IZANAMI Using Text Mining Method,” 18th International Workshop on Post-Binary ULSI Systems,
Okinawa, Japan, 2009.
22.M. Kushima, K. Araki, S. Suzuki and S. Araki, “Challenge to Qualitative Analysis for
Electronic Medical Record (IZANAMI) Using KeyGraph,” Asia Pacific Association for
Medical Informatics (APAMI), Hiroshima, Japan, 2009.
23.M. Suzuki, K. Araki and H. Yoshihara, “Audit Report of the Medical Information
System,” Japan Association for medical Informatics, 2002; 22(4): 347-353.
24.M. Usui and Y. Ohsawa, “Chance Discovery for Decision Consensus in Company -
Touchable, Visible, and Sharable for a Textile Manufacture Company -,” Japan Society
for Fuzzy Theory and Intelligent Informatics, 2004; 15(3): 275-285.
25.M. Usui and Y. Ohsawa, “Chance Discovery for Decision Consensus in Company -
Touchable, Visible, and Sharable for a Textile Manufacture Company -,” Japan Society
for Fuzzy Theory and Intelligent Informatics, 2004; 15(3): 275-285.
26.R. Thawonmas and K. Hata, “Aggregation of Action Symbol Subsequences for Discovery
of Online-game Player Characteristics Using KeyGraph,” Proc. of IFIP 4th International
Conference on Entertainment Computing (ICEC 2005), Sanda, Japan, 2005; 3711:
126-135.
27.S. Murayama, K. Okuhara and H. Ishii, “Innovation in Manufacturing Premise by New
Finding Obtained from Accident Relapse Prevention Report,” Proceedings of The 13th
Asia Pacific Management Conference, Melbourne, Australia, 2007; 13: 1124-1129.
28.S. Murayama, K. Okuhara and H. Ishii, “Innovation in Manufacturing Premise by New
Finding Obtained from Accident Relapse Prevention Report,” Proceedings of The 13th
29.Y. Kinosada, “Bio Medical Informatics in the Era of Electronic Patient Record System,”
Japan Association for medical Informatics, 2003; 23(5): 397-405.
30.Y. Kinosada, T. Umemoto, A. Inokuchi, K. Takeda and N. Inaoka, “Challenge to
Quantitative Analysis for Clinical Processes by Using Mining Technology,” Data Science
Journal, 2006; 26(3): 191- 199.
31.Y. Matsumura, H. Nakano, H. Kusuoka, K. Park, M. Matsuoka, H. Oshima, M.
Hayakawa and H. Takeda, “Clinic Hospital Cooperation System Based on The Network
Type Electronic Patient Record,” Japan Association for medical Informatics, 2002; 22(1):
19-26.
32.Y. Matsumura, H. Nakano, H. Kusuoka, K. Park, M. Matsuoka, H. Oshima, M.
Hayakawa and H. Takeda, “Clinic Hospital Cooperation System Based on The Network
Type Electronic Patient Record,” Japan Association for medical Informatics, 2002; 22(1):
19-26.
33.Y. Ohsawa, Benson Nels E and M. Yachida, “KeyGraph: Automatic Indexing by
Co-occurrence Graph based on Building Construction Metaphor,” Fifth International Forum
on Research and Technology Advances in Digital Libraries (ADL'98), 1998. Proceedings
of the International MultiConference of Engineers and Computer Scientists 2017 Vol I,
IMECS, 2017; 15 – 17.
34.Y. Ohsawa, Benson, Nels E. and M. Yachida, “KeyGraph: Automatic Indexing by
Segmenting and Unifing Co-occurrence Graphs,” The Institute of Electronics,
Information and Communication Engineers, 1998; J82-D-I(2): 391-400.
35.Y. Ohsawa, Benson, Nels E. and M. Yachida, “KeyGraph: Automatic Indexing by
Co-occurrence Graph based on Building Construction Metaphor,” Fifth International Forum on Research and Technology Advances in Digital Libraries (ADL’98), 1998.
36.Y. Sato, H. Takeuchi K. Hoshi, N. Uramoto, T. Satoh, N. Inaoka, K. Takeda and N.
Yamaguchi, “The Effectiveness of the Text Mining and Similar Document Search System
for Evidence-Based Guideline Development,” Japan Association for medical Informatics,
2004; 24(2): 315-322.
37.Y. Seo, Y. Iwase and Y. Takama, “KeyGraph-based BBS for Supporting Online Chance
Discovery Process,” SCIS ISIS2006, vol. FR-I3-2, 2006; 1210-1214.
38.Y. Takahashi, K. Miyaki, T. Shimbo and T. Nakayama, “Text-mining with Network
Analysis of News About Asbestos Panic,” Japan Association for medical Informatics,