Volume 21 Number 6 pp. 495–501 C The Author(s) 2018 doi:10.1017/thg.2018.63
Evidence for the Scarr–Rowe Effect on Genetic
Expressivity in a Large U.S. Sample
Michael A. Woodley of Menie,1,2Jonatan Pallesen,3and Matthew A. Sarraf4
1Center Leo Apostel for Interdisciplinary Studies, Vrije Universiteit Brussel, Brussels, Belgium 2Unz Foundation Junior Fellow, Palo Alto, CA, USA
3Independent Researcher, Aarhus, Denmark 4University of Rochester, Rochester, NY, USA
Using the continuous parameter estimation model (CPEM), a large genotyped adult sample of the popu-lation of Wisconsin, USA (the Wisconsin Longitudinal Study) is examined for evidence of the Scarr–Rowe effect, a gene×environment (G×E) interaction that reduces the heritability of IQ among those with low so-cioeconomic status (SES). This method allows the differential expressivity of polygenic scores predictive of both educational attainment and IQ (EA3) on the phenotype of IQ to be directly operationalized through-out the full range of these variables. Utilizing a parental SES factor-weighted composite as a measure of childhood SES, evidence for the Scarr–Rowe effect was found, that is, the genetic expressivity of EA3 on IQ increased with increasing parental SES (β=0.08,p=4.71×10⁻¹⁰,df=6,255). The effect was found for both the male and female samples separately,β(males)=0.08,p=5.27×10⁻⁵,df=3,018;β(females) =0.08,p=1.93×10⁻⁶,df=3,236. The effects were furthermore robust to removing outlying values of parental SES and to log-transforming the SES variable. The results are similar to those produced using a more conventional two-way interaction model, with IQ predicting the EA3×log of parental SES interaction after the main effects; however, CPEM allows for greater model degrees of freedom, thus is better powered to detect the effect when it is small in magnitude (CPEMβ=0.05,p=6.69×10⁻⁵vs. two-way interaction β=0.02,pone-tailed=.045, in both models log parental SES is used).
Keywords:CPEM, G×E interaction, polygenic score, Scarr–Rowe effect
The Scarr–Rowe effect is the apparent tendency of the her-itability of IQ to be lower among those raised in fam-ilies with lower socioeconomic status (SES). This effect might result from adverse bioecological conditions restrict-ing the variance in opportunities among those with low SES, which in turn supresses the expression of IQ-related genetic variants during development via a gene × environment (G×E) interaction (Bronfenbrenner & Ceci,1994). The ef-fect was first described by Scarr-Salapatek (1971) in a study of Philadelphia school children and was subsequently repli-cated in the U.S. population by Rowe and colleagues (1999). Turkheimer et al. (2003) reported one of the largest Scarr– Rowe effects, finding that among those with the lowest SES, the heritability of IQ was close to zero.
A meta-analysis of 43 effect sizes sourced from 14 Scarr–Rowe effect studies found clear indications of geographic clustering (Tucker-Drob & Bates,2015). A sig-nificant Scarr–Rowe effect (operationalized as a genetic ad-ditivity×SES interaction) was present among the U.S. pop-ulation (ρ =0.07,SE=0.03,p=.003); but among pop-ulations sampled from Western Europe and Australia, the
effect was absent (ρ= −0.03,SE=0.02,p=.223). Even re-moving the U.S. effect sizes reported by Turkheimer’s group (which were among the largest observed) yielded a signifi-cant Scarr–Rowe effect for this country (ρ=0.06,SE=0.02,
p=.003), and also significant differences between the U.S. and non-U.S. samples (ρ=0.09,SE= 0.03,p=.005). This meta-analysis also yielded indications of rising heri-tability with age (the Wilson effect), but no evidence that the Scarr–Rowe effects were smaller among samples in which IQ had been measured at a later age. A recently published largeN(1,636,968) genetically informed study of the popu-lation of Florida, containing 24,640 twins and 274,786 sib-lings, found no evidence for the Scarr–Rowe effect, even
received 29 September 2018; accepted 2 October 2018
though the sample used was highly socioeconomically het-erogeneous (Figlio et al.,2017). It should be noted, how-ever, that this study was conducted without knowledge of zygosity, which potentially offsets some of the increment in statistical power.
The recent availability of high-quality polygenic scores (PGS; normally distributed genetic indices constructed by summing alleles from a genome wide association study, or GWAS, on a trait of interest and multiplying them by their model β values) for educational attainment and also IQ enables a new method for estimating G×E interaction ef-fects, as their expressivity with respect to these phenotypes (i.e., the degree to which the genotype directly influences the phenotype) can be estimated, yielding more direct in-dications of such interactions that overcome certain lim-itations inherent in the twin design (such as ambiguities regarding the causation of phenotypic convergence and di-vergence; see, e.g., Segal,2013). So far, one study has already employed genomic data in investigating the Scarr–Rowe effect on IQ (Tahmasbi et al.,2017). In this study, genome-based restricted maximum likelihood estimates of heritabil-ity (GCTA-GREML) were employed to examine the pres-ence of Scarr–Rowe effects in a sample of 40,172 individuals —sourced from the UK BioBank database. It was found that genetic variance in IQ increased as SES decreased, yield-ing an anti-Scarr–Rowe effect, which, as the authors note, is consistent with the null and negative effects typically re-ported outside of the United States (Tucker-Drob & Bates,
2015).
In the present study, a large and socioeconomically rep-resentative genotyped sample of the state of Wisconsin (the Wisconsin Longitudinal Study; WLS) will be used to inves-tigate the presence of Scarr–Rowe effects via the application of a novel (and very straightforward) method that permits the direct operationalization of the expressivity of PGS on IQ, which will be used to determine the presence of G×E interactions as a function of parental SES.
Methods
Sample and Measures
All data were collected from the WLS, a longitudinal study of a randomly selected sample of Wisconsin High School students, and their siblings, born between 1937 and 1940, which began data collection in 1957 (when the participants were in their late teens and early 20s); the most recently collected data wave is from 2011. The sample is nearly ex-clusively of European descent, consistent with its high rep-resentativeness of mid-century Wisconsin demographics (Herd et al.,2014).
Polygenic Score for General Intelligence
In the period 2007–2008 and again in 2010, a large genetic data collection exercise was undertaken in which saliva samples were obtained from a total of 9,012 individuals,
who were subsequently genotyped using the Illumina Hu-manOmniExpress array as part of a very large GWAS, ex-amining variants predictive of individual differences in ed-ucational attainment and related cognitive phenotypes (Lee et al.,2018). For full information on genotyping procedures, see https://www.ssc.wisc.edu/wlsresearch/documentation/ GWAS/Herd_QC_report.pdf. Several alternative PGS were released, each representing different collections of pheno-types against which variants had been regressed, and also different methods (e.g., GWAS vs. MTAG—a multivari-ate regression-based estimation method). One PGS was se-lected for the present analysis, PGS_EA3_MTAG (hence-forth EA3), which was trained via multivariate analysis with respect to several convergent cognitive phenotypes, includ-ing an IQ test from UK BioBank, various neuropsychologi-cal functioning tests and IQ subsneuropsychologi-cales from COGENT, self-reported mathematical ability, and highest mathematics class successfully completed. Finally, also included among the training phenotypes was educational attainment, de-fined based on the 1997 ISCED UNEASCO classification, which ranks individuals based on seven internationally comparable categories of educational attainment, rescaled in terms of U.S. equivalent years of schooling. EA3 comes closest to capturing variance with respect to an overarching general intelligence factor. It should finally be noted that the sample from which Lee et al. (2018) derived EA3 was ex-tremely large (N>1 million; WLS was but a small part of the overall sample) and was ethnically heterogeneous, thus EA3 is corrected for population stratification. This, coupled with the extremely high ethnic homogeneity of the WLS sample (Herd et al.,2014), eliminates the need to include additional controls for population stratification in analyses utilizing these scores.
An additional step was taken to reduce model autocorre-lation by only selecting one sibling from each family. Based on WLS recommendations, we employed the following se-lection protocol. When there is at least one graduate with EA3, we select the first graduate listed. In the event that there are no graduates with EA3, but there is at least one sibling with EA3, we selected the first listed sibling.
Henmon–Nelson Test of Mental Ability
The same test was administered to the participant’s siblings (N=852) in a subsequent survey wave (1977), when the participants were in their late 30s and early 40s. To compute a combined IQ measure for the entire cohort, we standard-ized each cohort’s IQ scores separately and then merged them together (thus controlling for any divergent factors that may have influenced the IQs of each group, such as age at test administration). The resultant merged score was then restandardized.
Parental SES
The WLS contains a factor-weighted composite measure of parental SES. This measure is comprised of father’s years of schooling, mother’s years of schooling, Duncan’s socioe-conomic index for father’s 1957 occupation, and average parental income, with estimates for missing data. All data were collected in the 1957 wave.
Sex
Data on the sex of WLS respondents were collected in order to test for sex differences in the magnitudes of any Scarr– Rowe effects that might be present. This variable was mea-sured in 1957, with 1=male and 2=female.
Analytical Strategy
For the present analysis, theContinuous parameter
estima-tion model(CPEM) will be used to test for Scarr–Rowe
ef-fects on genetic expressivity. CPEM was developed by Gor-such (2005) and is based on the mathematics of the son product moment correlation. The formula for the Pear-son correlation can be written asr =(zx∗zy)/N, where
zxandzyare the standardized scores for the independent and dependent variables, respectively, andzx∗zyis the dot product term for the two—the average of which across sub-jects yields the correlation coefficient r. Gorsuch (2005) proposed that the product term (zx∗zy) for each individ-ual is mathematically equivalent to a correlation for anNof 1. That a dot product for a single pair of observations from a single individual can function equivalently to a correla-tion is logically entailed by the fact that it encapsulates two properties, sign, and magnitude. When two equivalently signedz-score values are combined, the resultant product term will always be positive, indicating that thevector of deviation from the mean is conserved for both of the ob-servations. Thus, two negatively and two positively signed observations will always yield a positively signed product term—equivalent to two negatively or positively covarying parameters in conventional correlational analysis. Oppos-ingly, signed observations (i.e., where one is positively and the other negatively deviated with respect to the means) will always yield negative product terms—as with negatively covarying parameters in correlational analysis. The second property is magnitude, which relates to the dispersion, or absolute difference between the observations comprising the product terms. Thus, the dot product term functions as
a continuous parameter estimate (CPE) of the covariance between the independent and dependent variablesfor each
individual in the sampleand can be used in regression
mod-els along with other variables for moderation analysis. A very fruitful application of this technique has been for examining differentiation effects, such as the cognitive and strategic (behavioral) differentiation–integration effort ef-fects, where covariance among clusters of cognitive abilities or behavioral indicators is expected to vary as a function of participants’ life history speed (Figueredo et al., 2013; Woodley et al.,2013). CPEM has also been utilized in the es-timation of individual-level heritabilities derived using the correlational Falconer’s formula, for the purpose of exam-ining whether the heritability of the latent life historyK
factor decreases as level ofKincreases (Woodley of Menie et al.,2015). The technique has been used as an alternative to the method of correlated vectors in establishing latent variable moderation effects (Woodley of Menie et al.,2015), in quantifying the impact of age on assortative mating on emotional intelligence (´Smieja & Stolarski,2018), in exam-ining the role of SES as a moderator of the association be-tween stable life history strategy and sexual debut (Dunkel et al.,2015), and for examining the curvilinear associations between longitudinal trends among the WAIS scale-scores and participant age (Lee et al.,2008), among other things.
Here, it is proposed that CPEM can be used to compute the individual-level covariance among EA3 and IQ scores for each participant utilizing the dot product terms to cap-ture the strength of the association between subject geno-type and phenogeno-type, which is a direct measure of genetic expressivity. By regressing parental SES against the CPE, the presence of a Scarr–Rowe effect can be determined if the resultingβvalue is positive, as this would indicate that the genetic expressivity (i.e., the covariance) of EA3 to IQ in-creases as parental SES inin-creases. Given that large amounts of data are available in WLS for both sexes, comparison of the effect sizes can be used to determine the presence of a sex difference in the effect. All analyses were conducted inRand the code is publicly archived athttp://rpubs.com/ Jonatan/cpem
Results
Analysis 1: Combined Sample
Table 1presents the descriptive statistics and correlations for the variables utilized in the analysis of the combined sample.
More information on the descriptives is available at
TABLE 1
Descriptive Statistics and Correlations for the Combined Sex Sample
Descriptives PGS IQ Parental SES
N 6256 6256 6256
Min. −3.28 57.85 1
Max. 4.16 143.65 97
Mean 0 100 16.33
Std. dev. 1 15 11.06
Correlations
PGS 1
IQ 0.31 1
Parental SES 0.16 0.30 1
Note: All correlations are significant at<0.001.
TABLE 2
The Results of Regressing the CPE z(EA3)∗z(IQ), Which Captures Differences in Levels of Genetic Expressivity on Parental SES
z(EA3)∗z(IQ) β(SE) t p r(>|t|) df z(residual)
Parental SES 0.08 (0.01) 6.24 4.71×10⁻¹⁰ 6255 1.45
Note: The modeltstatistic, significance, degrees of freedom and the skew on the model residual are also presented. Adj.R2=0.006,F=38.92.
TABLE 3
Correlations Broken Out by Sex, with Males below the Diagonal and Females Above
PGS IQ Parental SES
PGS 1 0.32 0.17
IQ 0.30 1 0.30
Parental SES 0.14 0.31 1
Note: All correlations are significant atp<.001.
including the intercepts are available at the Rpubs archive). In addition to the CPEM regression parameter, the model residual skewness is also estimated in order to ensure that there are no normality violations.
The regression model yields indications of a small-magnitude (i.e., <0.29; Cohen, 1988) Scarr–Rowe effect when parental SES is used to predict variation in the genetic expressivity of the participants’ PGS on their IQ scores. The effect is highly statistically significant (which is unremark-able given the very high model degrees of freedom) and the skew on the model residual falls within the levels generally considered acceptable for parametric regression (i.e.,z be-tween+2 and -2; George & Mallery,2010). The results of this analysis are graphed inFigure 1.
Analysis 2: Broken Out by Sex
Table 3presents the correlations broken out by sex.
Table 4presents the results of CPEM analyses for males and females separately. In addition to the CPEM regression parameter, the model residual skewness is also estimated for both regressions in order to ensure that there are no nor-mality violations.
The effect is present in both males and females sepa-rately and to an equal extent, indicating no sex differences.
TABLE 4
The Results of Regressing the CPE z(EA3)∗z(IQ), Which Captures Differences in Levels of Genetic Expressivity Against Parental SES for Males (Top Row) and Females (Bottom Row) Separately
z(EA3)∗z(IQ) β(SE) t p r(>|t|) df z(residual)
Male Parental SES 0.08 (0.02) 4.05 5.27×10⁻⁵ 3018 1.48 Female Parental SES 0.08 (0.02) 4.77 1.93×10⁻⁶ 3236 1.42
Note: The modeltstatistics, significances, degrees of freedom, and the skew on the model residuals are also presented. Males adj.R2= 0.005,F=16.4. Females adj.R2=0.007,F=22.75.
TABLE 5
The Results of Regressing the CPE z(EA3)∗z(IQ), Which Captures Differences in Levels of Genetic Expressivity Against Parental SES for the Combined Sample (Top Row), Males (Middle Row) and Females (Bottom Row) Separately. Outlying values of parental SES≥+3 SD removed.
z(EA3)∗z(IQ) β(SE) t p r(>|t|) df z(residual)
Parental SES 0.06 (0.01) 5.00 5.91×10⁻⁷ 6062 0.70 Male Parental SES 0.05 (0.02) 2.69 .007 2926 0.72 Female Parental SES 0.07 (0.02) 4.37 1.29×10⁻⁵ 3136 0.68
Note: The modeltstatistics, significances, degrees of freedom, and the skew on the model residuals are also presented. Combined sample adj.R2=0.004,F=24.99, Males adj.R2=0.002,F=7.25. Females adj.R2=0.006,F=19.09.
As with the combined sample, the residual model skewness falls within the acceptable range of values (i.e.,zbetween +2 and -2).
Robustness Analysis 1: Outlier Removal
To test the robustness of the effects to potentially outlying values of parental SES, the analyses were rerun for the com-bined sample and male and female subsamples, excluding all values of parental SES that were>+3 standard devia-tions above the mean (the 3SDlabeling method; Seo,2002). The results of this analysis are presented inTable 5. The re-sults indicate that outlying values of parental SES are not driving these effects and that there is only a very small re-duction in the effect sizes for the combined sample and the male and female subsamples.
Robustness Analysis 2: Log-Transformation of Parental SES
Of all of the variables utilized, the most heavily skewed was parental SES (z=1.29). Although regression analysis does not require that the inputs be normally distributed, relatively pronounced deviation from normality can never-theless cause skew in the model residual, which may affect the stability of the result when this is pronounced.Table 6
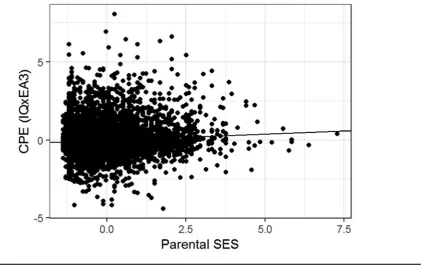
FIGURE 1
Scatter plot and regression line of the CPE z(EA3)∗z(IQ) capturing individual differences in genetic expressivity as a function of parental SES for the combined sample,N=6,256.
TABLE 6
The Results of Regressing the CPE z(EA3)∗z(IQ), Which Captures Differences in Levels of Genetic Expressivity Against
Log-Transformed Parental SES for Males (Top Row) and Females (Bottom Row) Separately
z (resi-z(EA3)∗z(IQ) β(SE) t p r(>|t|) df dual)
Parental SES 0.05 (0.01) 3.99 6.69×10⁻⁵ 6,255 1.46 Male Parental SES 0.05 (0.02) 2.80 .005 3,018 1.49 Female Parental SES 0.05 (0.02) 2.84 .005 3,236 1.43
Note: The modeltstatistics, significances, degrees of freedom, and the skew on the model residuals are also presented. Combined sample adj.R2=0.002,F=15.92, Males adj.R2=0.002,F=7.84. Females adj.R2=0.002,F=8.08.
Robustness Analysis 3: Comparison with a Conven-tional Two-Way Interaction Model
The conventional method for estimating Scarr–Rowe ef-fects is via a two-way interaction term between the genetic parameter and SES, estimated net of the main effects of the two (or in the case of behavior genetic studies, four) con-stituent variables (i.e., A, C, E, and SES), with IQ as the de-pendent variable (Tucker-Drobb & Bates,2015). Based on a simulation (which can be viewed athttp://jsmp.dk/files/ cpem_sim.html), we expect the results of CPEM and a two-way interaction model to be similar, with the former enjoy-ing a slight advantage in terms of model degrees of freedom. Consistent with this, the interaction model (presented in
Table 7; note that as all terms were standardized prior to en-try into the regression no intercept was estimated) yields a
TABLE 7
The Results of a Regression Model Using IQ to Predict EA3, Log Parental SES and the Two-Way Interaction Between EA3 and Log Parental SES
IQ β(SE) t p r(>|t|)
EA3 0.28 (0.01) 24.00 2.00×10⁻¹⁶ Log parental SES 0.24 (0.01) 20.81 2.00×10⁻¹⁶
EA3×Log 0.02 (0.01) 1.70 .089 (one-tailedp=.045) parental SES
Note: The modeltstatistics and significances are also presented. adj.R2=
0.16,F=390 on 3 anddf=6253,p<2.2×10⁻¹⁶.
similarβvalue to the CPEM analysis when log-transformed SES is used in both cases. The reduced model degrees of freedom in the interaction model (6,253 vs. 6,255), coupled with the slightly lower magnitude effect size (β=0.02 vs. 0.05), led to a non-significant value for the EA3×parental SES interaction term. Despite this, given that the results of the CPEM analysis and the prior meta-analysis of U.S. stud-ies based on the use of twins and siblings permit a
direc-tionalprediction of the interaction effect to be made, the
use of one-tailed significance is justified in this instance (Kimmel,1957), which yields a significant result (p=.045).
Discussion
measure of intelligence in a large study. Genetic expres-sivity increases as SES increases, consistent with the find-ings of gene× SES interaction effects from U.S. cohorts (Tucker-Drob & Bates,2015), which means that the present method of estimating the effect using the differential ex-pressivity of EA3 on IQ as a function of SES yields equiva-lent results to studies estimating gene×SES interaction ef-fects derived using more conventional behavior genetic ap-proaches (i.e., biometric structural equation modeling in-volving twins and siblings). This is illustrated via both sim-ulation and comparison of CPEM results to a regression analysis involving a two-way interaction between EA3 and log-transformed parental SES, which yielded a (one-tailed significant) interaction effect. Furthermore, to the best of our knowledge, this is the first time that the possibility of sex differences in the Scarr–Rowe effect has been investi-gated, with no apparent difference in the magnitudes being present.
While these findings are supportive of the existence of the Scarr–Rowe effect and are broadly congruent with rel-evant studies from the United States, there is evidence that not all parts of the United States are equally conducive to the effect, possibly due to high SES variation both within and among U.S. States. The Florida cohort study of Figlio et al. (2017) is illustrative on this score, as it was extremely highly powered to detect the effect yet found no indications of an SES×IQ heritability interaction using both twins and siblings (although the lack of data on zygosity noted in the introduction should be kept in mind). The most conserva-tive interpretation of our results, therefore, is that the bioe-cological factors that suppress the expressivity of cognitive genetic variants among those with low levels of childhood SES were present specifically among those born in the state of Wisconsin in the late 1930s and early 1940s. From this arises the question of whether there might be a secular trend in the strength of the Scarr–Rowe effect. Perhaps one rea-son that Figlio et al. (2017) were unable to detect the effect in their young sample is that environmental quality in the United States among those with low SES has improved in the decades since the WLS cohort was born (the Figlio et al.,
2017cohorts were born between 1994 and 2002, approxi-mately six decades later), thus erasing the effect. A cross-temporal, meta-analysis of the U.S. data in Tucker-Drob and Bates (2015) along with the results of newer studies such as Figlio et al. (2017) might help to determine whether such a trend exists, net of factors such as participant age at cogni-tive evaluation and location within the United States.
Finally, given thatghas a potentially very flat norm of reaction (meaning that the trait seems to be well canal-ized against environmental influences experienced during childhood; Protzko,2015; Sesardic,2005), it is predicted that the biggest and, critically, most persistent impact of bioecological elicitors of the Scarr–Rowe effect will be on measures of IQ exhibiting lowgsaturation, and thus low heritability (see, e.g., Voronin et al.,2016,Table 3, p. 835),
which potentially leaves greater ‘room’ for G×E interac-tions in the determination of trait variance. If it is found that
gloading negatively moderates ability measures’ sensitivity to the Scarr–Rowe effect, then thegloading of tests might be an important factor to control for in future meta-analyses. Moreover, it suggests that the Scarr–Rowe effect may help increase our understanding of the Flynn effect (which also occurs to the greatest extent on the leastg-loaded abilities; te Nijenhuis & van der Flier, 2013), as reductions in the strength of the former effect may be a driver of the latter effect. This is because reduced variance in the provision-ing of environmental factors such as educational attainment and other inducements toward cognitive specialization may be boosting opportunities for those with low SES to reach their genetic potential in terms of their capacity to culti-vate specialized abilities, leading to potentially large gains in IQ, especially in instances where the transition from a poor- to a high-quality environment is very rapid. This may explain why in a substantial subset of studies, the Flynn ef-fect appears to be larger among those with lower levels of IQ (which tracks lower SES; e.g., Flynn,2012).
References
Bronfenbrenner, U., & Ceci, S. J. (1994). Nature-nurture reconceptualized in developmental perspective: A bioeco-logical model.Psychological Review, 101, 568–586. Cohen, J. (1988).Statistical power analysis for the behavioral
sciences(2nd ed.). Hillsdale, NJ: Lawrence Erlbaum. Dunkel, C. S., Summerville, L. A., Mathes, E. W., & Kesserling,
S. N. (2015). Using the California Q-sort measure of life history strategy to predict sexual behavioural outcomes.
Archives of Sexual Behavior, 44, 1707–1711.
Figlio, D. N., Freese, J., Karbownik, K., & Roth, J. (2017). So-cioeconomic status and genetic influences on cognitive de-velopment.Proceedings of the National Academy of Sciences, USA,114, 13441–13446.
Figueredo, A. J., Woodley, M. A., Brown, S. D., & Ross, K. C. (2013). Multiple successful tests of the strategic differentiation-integration effort (SD-IE) hypothesis. Jour-nal of Social, Evolutionary & Cultural Psychology,7, 361– 383.
Flynn, J. R. (2012). Are we getting smarter? Rising IQ in the twenty-first century. Cambridge, UK: Cambridge University Press.
George, D., & Mallery, M. (2010).SPSS for Windows step by step: A simple guide and teference, 17.0 update(10th ed.). Boston, MA: Pearson.
Gorsuch, R. L. (2005). Continuous parameter estimation model: Expanding the standard statistical paradigm. Jour-nal of the Science Faculty of Chiang Mai University, 32, 11– 21.
Harley, D. D. (1977).The Henmon-Nelson: Computerized. Un-published master’s thesis, Canada: University of British Columbia.
Herd, P., Carr, D., & Roan, C. (2014). Cohort profile: Wiscon-sin longitudinal study (WLS).International Journal of Epi-demiology, 43, 34–41.
Kimmel, H. D. (1957). Three criteria for the use of one-tailed tests.Psychological Bulletin, 54, 351–353.
Klett, W. G., Watson, C. G., & Hoffman, P. T. (1986). The Henmon-Nelson and Slosson tests as predictors of the WAIS-R IQ.Journal of Clinical Psychology, 42, 343–347. Kling, J. O., Davis, W. E., & Knost, E. K. (1978).
Henmon-Nelson IQ scores as predictors of WAIS full scale IQ in al-coholics.Journal of Clinical Psychology, 34, 1001–1002. Lee, H. F., Gorsuch, R. L., Saklofske, D. H., & Patterson, C. A.
(2008). Cognitive differences for ages 16 to 89 years (Cana-dian WAIS-III): Curvilinear with Flynn and processing speed corrections.Journal of Psychoeducational Assessment, 26, 382–394.
Lee, J. J., Wedow, R., Okbay, A., Kong, O., Maghzian, M., Zacher, M., … Cesarini, D. (2018). Gene discovery and polygenic prediction from a 1.1-million-person GWAS of educational attainment.Nature Genetics,50, 1112–1121. Protzko, J. (2015). The environment in raising early
intelli-gence: A metaanalysis of the fadeout effect.Intelligence, 53, 202–210.
Rowe, D. C., Jacobson, K. C., & van den Oord, E. J. C. G. (1999). Genetic and environmental influences on vocabu-lary IQ: Parental education level as a moderator.Child De-velopment, 70, 1151–1162.
Scarr-Salapatek, S. (1971). Race, social class, and IQ.Science, 174, 1285–1295.
Segal, N. L. (2013). Personality similarity in unrelated look-alike pairs: Addressing a twin study challenge.Personality & Individual Differences, 54, 23–28.
Seo, S. (2002). A review and comparison of methods for
detecting outliers in univariate data sets. Unpublished
masters dissertation, Seoul, South Korea: Kyung Hee University.
Sesardic, N. (2005).Making sense of heritability. Cambridge, UK: Cambridge University Press.
´Smeieja, M., & Stolarski, M. (2018). Assortative mating for emotional intelligence.Current Psychology, 37, 180–187. Tahmasbi, R., Evans, L. M., Turkheimer, E., & Keller, M. C.
(2017). Testing the moderation of quantitative gene by en-vironment interactions in unrelated individuals.bioarXiv, doi:10.1101/191080.
te Nijenhuis, J., & van der Flier, H. (2013). Is the Flynn effect on g?: A metaanalysis.Intelligence, 41, 802–807.
Tucker-Drob, E. M., & Bates, T. C. (2015). Large cross-national differences in gene×socioeconomic status interaction on intelligence.Psychological Science, 27, 138–149.
Turkheimer, E., Haley, A., Waldron, M., D’Onofrio, B., & Gottesman, I. I. (2003). Socioeconomic status modifies her-itability of IQ in young children.Psychological Science, 14, 623–628.
Voronin, I., te Nijenhuis, J., & Malykh, S. B. (2016). The corre-lation betweengloadings and heritability in Russia.Journal of Biosocial Science, 48, 833–843.
Woodley of Menie, M. A., Figueredo, A. J., Cabeza de Baca, T., Fernandes, H. B. F., Madison, G., Wolf, P., & Black, C. (2015). Strategic differentiation and integration of genomic-level heritabilities facilitate individual differences in preparedness and plasticity of human life history. Fron-tiers in Psychology, 6, 422.
Woodley of Menie, M. A., Figueredo, A. J., Madison, G., & Dunkel, C. S. (2015). Estimating the strength of genetic se-lection againstgin a sample of 3520 Americans, sourced from MIDUS II.Personality & Individual Differences,86, 266–270.