July-August 2019 699
Research
Paper
In general, temperature and relative humidity are the two main factors affecting stability testing and storage conditions of pharmaceuticals, foods and cosmetics. Although relative humidity should be discussed with temperature due to the close relationship between those and their great impact on each other but the dilemma is that the theory on which the research is based is not applicable for the humidity. To illustrate how important the storage temperature of pharmaceuticals is, Schumacher (1972) and Grimm (1986, 1998)[1-3] and two large organizations such as the International Conference on Harmonisation (ICH) and World Health Organization (WHO) have studied not only
how the storage temperature affected the stability of pharmaceuticals but also divided the world into four different climatic zones and the fourth one was further divided into two separate zones. Egypt belongs to the climatic ICH/WHO zone IVA region, which is hot and humid with long term storage condition equal to 30°/65 % RH[4-6]. Storage conditions and evaluation
Adjusting and Resetting of the Pre-determined Storage
Temperature for O/W Emulsions
A. K. HASSAN*
United Pharmaceutical Industries, Cosmetics and Chemicals Co., Cairo, Egypt
Hassan et al.: Resetting of Pre-determined Storage Temperature
Adjusting and resetting the predetermined storage temperature of O/W miconazole cream from 20-24° to be 30° to coincide with the storage temperature of the Egyptian climatic ICH/WHO zone IVA was the objective of this work. Eight sets of miconazole cream were prepared by using different proportions of the oil phase ingredients while their ratios were fixed at 30 %. The calculated HLB values of the oil phases were 9.067, 9.134, 9.2, 9.267, 9.36, 9.46, 9.566 and 9.6. These eight sets have same optimum surfactants blend proportions equal to 0.5:0.5 and same effective surfactant blend concentration equal to 7 %. Sets which have storage temperature equal to 30±2° were assessed according to the acceptance criteria of the accelerating stability testing protocol for O/W emulsions stabilized by non-ionic surfactants (aqueous surfactant two-phase systems) as previously reported. Only two sets, numbered 2 and 4 with storage temperature of 30.5 and 32°, respectively met the acceptance criteria of aqueous surfactant two-phase system. The applicability and validity of the method was confirmed by measuring zeta potential and particle size distribution of original miconazole cream set, set numbers 2 and 4. Zeta potential and particle size distribution of the three sets were measured on a Zetasizer with zeta potential results equal to -20, -30.7, -41.7 mV and particle size distribution results equal to 560.8, 387.6, 386.5 nm, respectively. Particle size distribution was also measured using a transmission electron microscope with results equal to 84.875, 49.168 and 46.05 nm, respectively. These results indicated that zeta potential defined the emulsion stability accurately and precisely whereas particle size distribution measurement gave unreliable and indefinite results. Zeta potential results revealed that the increase in the storage temperature of emulsion to 30° is accompanied by an increase in its stability. Increasing temperature beyond 30 is possible and would result in subsequent increase in stability due to the presence of liquid crystalline phase below 35°, which contributes significantly to emulsion stability while the destructive effect of the temperature starts at 35°. Unreliable and indefinite results of particle size measurement proved that the droplet diameter and droplet size measurement reported in many reports is more convenient. This work described a theory to determine the storage temperature of materials, pharmaceuticals, foods and cosmetics obeying non-Newtonian plastic flow.
Key words: Kadry’ theory, ICH/WHO climatic zones, zeta potential and particle size distribution measurements, storage temperature, non-Newtonian plastic flow, relative humidity
*Address for correspondence
E-mail: [email protected]
Accepted 15 June 2019 Revised 19 March 2019 Received 25 December 2018 Indian J Pharm Sci 2019;81(4):699-708
700
of finished pharmaceutical products reported in WHO concluded that the stability data must demonstrate stability of the medicinal product throughout its intended shelf life under the climatic conditions prevalent in the target countries. Merely applying the same requirements appropriate to other markets could potentially lead to substandard products if stability studies are conducted at the storage conditions for countries in climatic zone I/II for products intended to be supplied to countries in climatic zones III and IV[7]. Stability testing requirements of pharmaceutical products were studied by Bajaj et al.[8], Singh and Bakshi[9], WHO[10-21], ICH[22-31] as well as many other official, international and national guidelines including FDA[32], in addition to many other researchers[33-38]. In conclusion the storage condition and shelf life storage stability testing conditions should be established with due regard to the climatic zone(s) in which the product is to be marketed and distributed in. Although resetting of the pre-determined storage temperature required for O/W emulsions to coincide with the climatic zone of distribution in the climatic ICH/WHO zone IVA of Egypt (30º) was the objective of this research but it could be followed and applied for the other climatic ICH/WHO zones as well. Another objective of this work was a call for clear, specific orders and instructions from the responsible authorities and international organization specialized in medicines, foods and cosmetics for the manufacturers to formulate their products to coincide with the required storage temperature of the climactic zone to which their products have been distributed right from the start. The importance and strength of this work lies in its applicability to determine the storage temperature of materials, pharmaceuticals, foods and cosmetics obeying non-Newtonian plastic flow (Kadry’ theory). Pharmaceuticals such as suspensions, creams, colloid systems, foam and three-dimensional network microstructure of creams suggested by Adeyeye et al.[39], plastic gels, flocculated suspensions of aluminum hydroxide, foods (e.g. tomato paste), cosmetics (e.g. toothpaste), plasticine or soap are examples of these products[40-42].
MATERIALS AND METHODS
Zeta potential and particle size distribution was determined by Zetasizer Nano-ZS, Malvern Instruments (UK); transmission electron microscope (TEM) Jeol 1200-EX II TEM (Jeol Ltd, Tokyo, Japan); RZR1 stirring paddle (Heidolph Instruments Gmbh & Co. KG, Germany); Jenway model 4510 conductivity/
TDS meter (UK); A Jenway model 3510 pH meter (UK); Thermometer 150 (76 mm 1 mm, N2 filled GH, Zeal, Ltd, England); 100 ml and 600 ml glass-ware beakers grade A (Ilmabor TGI, Germany); Burette (0.1/DIN/AS 50 ml, Germany); MS-H-Pro Digital hotplate magnetic stirrer (USA); PGW453e, 750.0 g, d=0.001 g Adam balance (UK).All equipment’s were calibrated, approved and ready for use.
Emulsion compositions:
Formulations are composed of 2 % miconazole nitrate (Jiangsu Nhwa Pharmaceutical Co. Ltd. China), which was used as the active ingredient, 8-15 % paraffin oil (Apar industries Co. Ltd. India), 9-13 % soft paraffin (Jell Pharmaceuticals Pvt Co. Ltd. India) and 4.412-10 % beeswax (Cisme Co. Italy) were used as oil phase, 3.5 % Tween 80 and 3.5 % Span 80 (Kolb Co. Switzerland) were used as emulsifiers, 0.02 % propyl paraben base (Salicylates and Chemicals Co. Ltd. India) and 0.15 % methyl paraben base (Wuhu Huahai Biology Engineering Co. Ltd. China) were used as preservatives, 5 % sorbitol (Roquette Lestrem Co. France) and 50.83 % water for injection (Eipico Pharmaceutical Company, Egypt) were used as water phase. All materials were of pharmaceutical grade. Preparation of emulsions:
The emulsions were prepared using the sudden phase inversion method. The water phase was heated to 80±2° and added portion wise to the oily phase containing both emulsifiers at 80±2° within 30 s, while stirring with RZR1 stirring paddle at speed of 664 rpm. The emulsion was mixed for 20 min as a fixed time. Different emulsions were made in triplicate. All parameters were measured after 24 h[43-45].
Conductivity and phase inversion temperature (PIT) range determination:
701
July-August 2019
values). The results quoted are the means of three determinations[43].
Determination of yield value represented as temperature (YVT) - storage temperature:
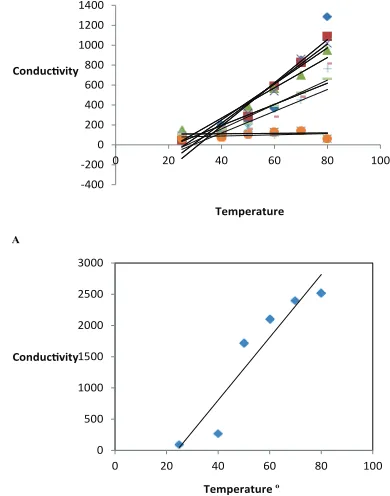
The specific conductivity of each tested cream was measured without any dilutions, at room temperature (25±2), 40, 50, 60, 70 and 80°. In this way, a rheogram can be constructed by plotting temperature versus conductivity by increasing temperature up to 80°. YVT for all the samples can hence be obtained from the least squares fitted lines by extrapolating the linear lines to the zero temperature X-axis. The storage temperature of the sample is the YVT of its temperature-conductivity relationship[43-45]. All parameters were measured after 24 h.
Preparation of Srilane cream:
Samples of Srilane cream were purchased from the Egyptian market and prepared as follows: 150 g of each purchased O/W cream were weighed and stirred with RZR1 stirring paddle (Heidolph Instruments Gmbh and Co. KG, Germany) at a speed of 664 rpm for 5 min as a fixed time to assure a complete mixing.
Measurement of zeta potential, particle size by intensity and by number:
This procedure is suitable for most samples of conductivity less than 5 mS, dispersant was water, dispersant RI was 1.330, viscosity (cP) was 0.8872, dispersant dielectric constant was 78.5, material RI was 1.59, material absorption was 0.010. System details for zeta potential: temperature: 25°, zeta runs equal to 12, count rate (kcps) were 79.5, 99.9, 69.2 for original formula, formula number 2 and 4, respectively, measurement position (mm) was 2.00, cell description (clear disposable zeta cell), attenuator were 5, 6, 6 for original formula, formula number 2 and formula 4, respectively. System details for particle size were,temperature was 24.9°, duration rate(s) were 60, 70, 70 for original formula, formula number 2 and 4, respectively, count rate (kcps) were 334.5, 119.5, 233.8 for original formula, formula number 2 and 4, respectively, measurement position (mm) was 5.5, cell description (clear disposable zeta cell) and attenuator was 7. The instrument is located in the Egyptian Petroleum Research Institute (Egypt).
Measurement of particle size by transmission electron microscope (TEM):
Just before the measurement, the sample was dispersed
in 10 ml distilled water and placed in MCS Sonicator (China) for 20 min at 40°. The suspension was deposited on 200 mesh copper grid covered with carbon film (CF200-CU). The sample was dried on filter paper and observed using a TEM at an accelerating voltage of 100 kV. The used TEM is located in the faculty of science Ain Shams University, Cairo, Egypt.
RESULTS AND DISCUSSION
In previously reported work, the storage temperature of miconazole nitrate cream equal to 20-24º was determined through the determination of YVT of its temperature-conductivity relationship[44]. Adjusting and resetting of this temperature to 30º will increase the cream stability. This assumption is based on the fact that; concerning the non-Newtonian plastic flow, the material does not begin to flow until a shearing stress, corresponding to the yield value is exceeded i.e. the material of cream does not begin to flow until a force of shearing stress corresponding to the yield value represented in this work as temperature is exceeded[46]. Since the flow of the cream would affect its stability, so increase in the YVT would increase the stability of the material as it will require a higher force of shearing stress to flow.
702
recorded in Table 1. Emulsion compositions were recorded in Table 2. The conductivities of the 8 sets and the original miconazole formulawere measured directly as they are at temperature equal to 25°±2, 40, 50, 60, 70 and 80°. Averages of responses of conductivities in μS/cm were recorded in Table 3. The temperature-conductivity relations representing these formulae were revealed in fig. 1. HLB values of oil phases of the prepared emulsions, HLB values of the surfactants blend, R2 values, slope values, PIT values and YVTs were recorded in Table 4. Sets which have storage temperature equal to 30±2° (2° was added due to the experimental errors) were assessed according to the acceptance criteria of the accelerating stability testing protocol (ASTP) forO/W emulsions stabilized
by nonionic surfactants, as previously reported. Acceptance criteria of ASTP include; the stable cream should have strong temperature-conductivity relationship with R2≥0.909, YVT≥21° and PIT more than 80°[44]. Set numbers 3, 5, 6 and 8 were neglected as they have storage temperature equal to 12°, 20°, unidentified and 27°, respectively which were lower than the recommended storage temperature equal to 30°±2. Set numbers 1, 2, 4 and 7 were assessed according to the acceptance criteria of ASTP as they have a storage temperature equal to 32, 30.5°, 32° and 29°, respectively. Set numbers 1 and 7 have PITs more than 80° and 80° but they were neglected as they have R2 values equal to 0.842 and 0.626, respectively. Only set numbers 2 and 4 with storage temperature Product name Batch number Prod. Date Exp. Date Nonionic surfactant/s Mother company Manufactured by (YVTs)
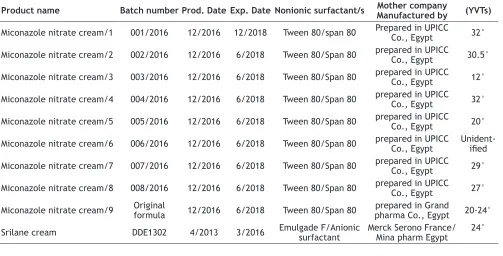
Miconazole nitrate cream/1 001/2016 12/2016 12/2018 Tween 80/span 80 Prepared in UPICC Co., Egypt 32°
Miconazole nitrate cream/2 002/2016 12/2016 6/2018 Tween 80/Span 80 prepared in UPICC Co., Egypt 30.5°
Miconazole nitrate cream/3 003/2016 12/2016 6/2018 Tween 80/Span 80 prepared in UPICC Co., Egypt 12°
Miconazole nitrate cream/4 004/2016 12/2016 6/2018 Tween 80/Span 80 prepared in UPICC Co., Egypt 32°
Miconazole nitrate cream/5 005/2016 12/2016 6/2018 Tween 80/Span 80 prepared in UPICC Co., Egypt 20°
Miconazole nitrate cream/6 006/2016 12/2016 6/2018 Tween 80/Span 80 prepared in UPICC Co., Egypt Unident-ified
Miconazole nitrate cream/7 007/2016 12/2016 6/2018 Tween 80/Span 80 prepared in UPICC Co., Egypt 29°
Miconazole nitrate cream/8 008/2016 12/2016 6/2018 Tween 80/Span 80 prepared in UPICC Co., Egypt 27°
Miconazole nitrate cream/9 Original formula 12/2016 6/2018 Tween 80/Span 80 pharma Co., Egyptprepared in Grand 20-24°
Srilane cream DDE1302 4/2013 3/2016 Emulgade F/Anionic surfactant Merck Serono France/Mina pharm Egypt 24°
TABLE 1: PURCHASED AND PREPARED O/W CREAMS
Exp. numbers Mico.
Exp.1 Exp.2Mico. Exp.3Mico. Exp.4Mico. Exp.5Mico. Exp.6Mico. Exp.7Mico. Exp.8Mico. Formula 9Original
HLB
values/composition HLB of oil =9.067 HLB of oil =9.134 HLB of oil=9.2 HLB of oil =9.267 HLB of oil =9.36 HLB of oil =9.46 HLB of oil =9.566 HLB of oil=9.6 HLB of oil=9.32 Miconazole nitrate 2.0 2.0 2.0 2.0 2.0 2.0 2.0 2.0 2.0 Liquid paraffin 11.0 10.0 9.0 8.0 12.0 8.0 14.0 10.0 15.0 Soft paraffin 13.0 13.0 13.0 13.0 11.0 12.0 9.0 10.0 10.588 Bees wax 6.0 7.0 8.0 9.0 7.0 10.0 7.0 10.0 4.412
Tween80 3.5 3.5 3.5 3.5 3.5 3.5 3.5 3.5 3.5
Span 80 3.5 3.5 3.5 3.5 3.5 3.5 3.5 3.5 3.5
Propyl paraben 0.02 0.02 0.02 0.02 0.02 0.02 0.02 0.02 0.02
Sorbitol 5.0 5.0 5.0 5.0 5.0 5.0 5.0 5.0 5.0
Methyl paraben 0.15 0.15 0.15 0.15 0.15 0.15 0.15 0.15 0.15 Water 55.83 55.83 55.83 55.83 55.83 55.83 55.83 55.83 55.83
TABLE 2: COMPOSITION OF MICONAZOLE NITRATE CREAMS
703
July-August 2019
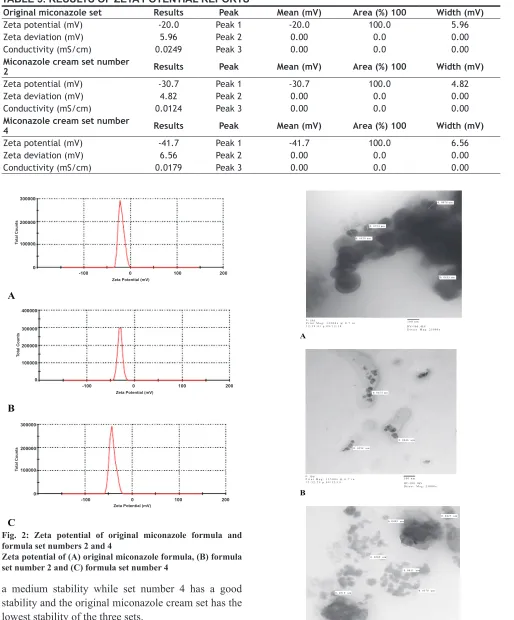
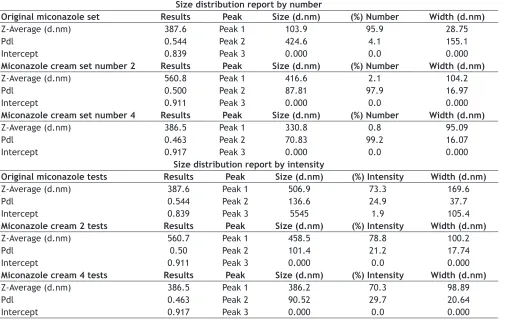
equal to 30.5° and 32°, respectively met the acceptance criteria of ASTP because they have strong temperature-conductivity relation with R2 equal to 0.945, 0.939, PIT more than 80° and YVTs equal to 30.5°, 32°[44]. These 2 temperatures coincided with the temperature of climatic ICH/WHO zone IVA of equal to 30°. The applicability and validity of the method was confirmed by measuring zeta potential and particle size distribution of original miconazole cream set, set numbers 2 and 4. Zeta potential and particle size distribution of the three sets were measured by Zetasizer with zeta potential results equal to –20, –30.7, –41.7 mV and particle size distribution results equal to 560.8, 387.6, 386.5 nm, respectively. Particle size distribution was also measured using TEM with results equal to 84.875, 49.168 and 46.05 nm, respectively. The results of zeta potential were recorded in Table 5 and revealed in fig. 2. Particle size distribution measurement by Zetasizer and TEM were recorded in Tables 6 and 7, respectively. TEM images were revealed in fig. 3. According to Riddick’ scale[47] for the stability of solution with relation to zeta potential, the above mentioned results indicated that set number 2 has Experiment
numbers/ temp. (°)
Mico. Exp.1 μS/cm
Mico. Exp.2 μS/cm
Mico. Exp.3 μS/cm
Mico. Exp.4 μS/cm
Mico. Exp.5 μS/cm
Mico. Exp.6 μS/cm
Mico. Exp.7 μS/cm
Mico. Exp.8 μS/cm
Original formula9
μS/cm
Srilane cream μS/cm
25±2 39.3 50 153.1 90.3 70.2 62.9 117.8 101.5 108.3 95.1 40 202 140 149.9 199.3 107.0 80.3 109.3 150.9 160 266 50 232 290 388.2 310.4 170.5 107.5 104.1 161.4 218 1717 60 370 593 563 540 300.9 130.7 96.8 285 394 2100 70 849 830 699.7 866 435 143 451.6 484.8 525 2400
80 1286 1090 950 1023 405 63 766 819 763 2520
TABLE 3: AVERAGE RESPONSES OF CONDUCTIVITIES OF ALL TESTED CREAMS
Mico is miconazole cream. Temp is temperature. All miconazole creams contain 7 % SBC with fixed proportion equal to 0.5:0.5
Exp. number HLB values of the oil phases of O/W emulsions
HLB values of
the OSB R² values
Slope values
Storage temperature/ yield values represented as temperatures (YVTs, º)
PIT range
(º)
pH 5-7
Mico.1 9.067 9.65 0.842 51.77 32 80 Excluded
Mico.2 9.134 9.65 0.945 19.84 30.5 80 6.0
Mico.3 9.2 9.65 0.830 10.58 12 80 Excluded
Mico.4 9.267 9.65 0.939 18.08 32 80 6.1
Mico.5 9.36 9.65 0.907 7.339 20 70-80 Excluded
Mico.6 9.46 9.65 0.130 0.623 Unidentified 60-70 Excluded
Mico.7 9.566 9.65 0.626 10.92 29 80 Excluded
Mico.8 9.6 9.65 0.800 12.23 27 80 Excluded
Original formula 9 9.32 9.65 0.935 21.69 20-24 80 5.7 Srilane cream 0.888 50.30 24 inversionNo and distributedAlready stable
TABLE 4: RESULTS OF ALL TESTED CREAMS
Mico is miconazole cream. Exp are experiments. Accelerating stability testing protocol criteria is applicable only for O/W emulsions stabilized by nonionic surfactants i.e. it is not applicable for Srilane O/W cream, which stabilized by anionic surfactant (Emulgade F)
A
B
-400 -200 0 200 400 600 800 1000 1200 1400
0 20 40 60 80 100
Conductivity
Temperature
0 500 1000 1500 2000 2500 3000
0 20 40 60 80 100
Conductivity
Temperature º
Fig. 1: Relation between temperatures vs. conductivities up to 80°
704
Original miconazole set Results Peak Mean (mV) Area (%) 100 Width (mV)
Zeta potential (mV) -20.0 Peak 1 -20.0 100.0 5.96 Zeta deviation (mV) 5.96 Peak 2 0.00 0.0 0.00 Conductivity (mS/cm) 0.0249 Peak 3 0.00 0.0 0.00
Miconazole cream set number
2 Results Peak Mean (mV) Area (%) 100 Width (mV)
Zeta potential (mV) -30.7 Peak 1 -30.7 100.0 4.82 Zeta deviation (mV) 4.82 Peak 2 0.00 0.0 0.00 Conductivity (mS/cm) 0.0124 Peak 3 0.00 0.0 0.00
Miconazole cream set number
4 Results Peak Mean (mV) Area (%) 100 Width (mV)
Zeta potential (mV) -41.7 Peak 1 -41.7 100.0 6.56 Zeta deviation (mV) 6.56 Peak 2 0.00 0.0 0.00 Conductivity (mS/cm) 0.0179 Peak 3 0.00 0.0 0.00
TABLE 5: RESULTS OF ZETA POTENTIAL REPORTS
a medium stability while set number 4 has a good stability and the original miconazole cream set has the lowest stability of the three sets.
Measurements of particle size distribution by Zetasiezer and TEM gave unreliable and indefinite results. This indicated that measuring particle size is not adequate to judge stability whereas the droplet size measurement
A
B
C 300000
200000
100000
0
-100 0 100 200
-100 0 100 200 Zeta Potential (mV)
Total Counts
400000
300000
200000
100000
0
Zeta Potential (mV)
Total Counts
-100 0 100 200 300000
200000
100000
0
Zeta Potential (mV)
Total Counts
Fig. 2: Zeta potential of original miconazole formula and formula set numbers 2 and 4
Zeta potential of (A) original miconazole formula, (B) formula set number 2 and (C) formula set number 4
A
B
C
0. 0978 um
0. 0724 um
0. 0838 um
0. 0855 um
0. 0475 um
0. 0646 um 0. 0354 um
0. 0499 um
0. 0289 um
0. 0451 um
0. 0578 um 0. 0519 um
0. 0427 um 6 . j p g
P r i n t M a g : 1 3 5 0 0 x @ 0 . 7 i n 1 2 : 5 9 : 4 1 p 0 9 / 1 2 / 1 8
1 0 0 n m HV=10 0 . 0kV D i r e c t M a g : 2 5 0 0 0 x
6 . j p g
P r i n t M a g : 1 3 5 0 0 x @ 0 . 7 i n
1 2 : 3 2 : 2 9 p 0 9 / 1 2 / 1 8 1 0 0 n mHV=10 0 . 0kV D i r e c t M a g : 2 5 0 0 0 x
6 . j p g
P r i n t M a g : 1 3 5 0 0 x @ 0 . 7 i n 9 : 2 4 : 1 0 p 0 9 / 1 3 / 1 8
1 0 0 n m HV=10 0 . 0kV D i r e c t M a g : 2 5 0 0 0 x
Fig. 3: Particle size measurement by TEM
705
July-August 2019
suggested by Prinderre et al.[48], Bagwe et al.[49] and De Morais et al.[50] was more accurate and convenient. Prinderre et al. concluded that the minimum droplet diameter corresponded to the most stable emulsion and the average diameter of droplets reached a minimum value for required HLB value of the formulated O/W emulsions[48]. Bagwe et al. and De Morais et al. reported that emulsions were metastable (low stability) colloids with droplet sizes generally larger than 1 μm (from 0.5-5 μ). Under certain conditions, the oil droplets in an emulsion can be made small enough not to reflect light, hence forming a transparent dispersion known as microemulsion, which are transparent because of small droplet size generally <100 nm[49], nano emulsions consisted of very fine emulsions with droplet sizes between those of conventional emulsions and microemulsions i.e. with a typical size range of 20 up to 500 nm[50].
It should be noted that the recorded results of particle size measured by TEM were smaller than that measured by zetasizer. The samples measured by TEM were dispersed in 10 ml distilled water and placed in MCS Sonicator for 20 min at 40° i.e. the smaller results are due to sonication process. These results were accepted for comparison between the three sets as all samples were measured under the same condition. In previously reported papers Hassan[43] and Lin et al.[51] proved that the required HLB value of the OSB was more than the HLB value of the oil phase by values equal to 0.15 and 0.5, respectively whereas in this work the HLB value of the OSB was more than the HLB values of the oil phase of the original reported formula and the two formulae of sets number 2 and 4 by values equal to 0.33, 0.416 and 0.383, respectively.
As a rule the creams prepared using anionic, amphoteric and cationic surfactants are not inverted by increasing Size distribution report by number
Original miconazole set Results Peak Size (d.nm) (%) Number Width (d.nm)
Z-Average (d.nm) 387.6 Peak 1 103.9 95.9 28.75
Pdl 0.544 Peak 2 424.6 4.1 155.1
Intercept 0.839 Peak 3 0.000 0.0 0.000
Miconazole cream set number 2 Results Peak Size (d.nm) (%) Number Width (d.nm)
Z-Average (d.nm) 560.8 Peak 1 416.6 2.1 104.2
Pdl 0.500 Peak 2 87.81 97.9 16.97
Intercept 0.911 Peak 3 0.000 0.0 0.000
Miconazole cream set number 4 Results Peak Size (d.nm) (%) Number Width (d.nm)
Z-Average (d.nm) 386.5 Peak 1 330.8 0.8 95.09
Pdl 0.463 Peak 2 70.83 99.2 16.07
Intercept 0.917 Peak 3 0.000 0.0 0.000
Size distribution report by intensity
Original miconazole tests Results Peak Size (d.nm) (%) Intensity Width (d.nm)
Z-Average (d.nm) 387.6 Peak 1 506.9 73.3 169.6
Pdl 0.544 Peak 2 136.6 24.9 37.7
Intercept 0.839 Peak 3 5545 1.9 105.4
Miconazole cream 2 tests Results Peak Size (d.nm) (%) Intensity Width (d.nm)
Z-Average (d.nm) 560.7 Peak 1 458.5 78.8 100.2
Pdl 0.50 Peak 2 101.4 21.2 17.74
Intercept 0.911 Peak 3 0.000 0.0 0.000
Miconazole cream 4 tests Results Peak Size (d.nm) (%) Intensity Width (d.nm)
Z-Average (d.nm) 386.5 Peak 1 386.2 70.3 98.89
Pdl 0.463 Peak 2 90.52 29.7 20.64
Intercept 0.917 Peak 3 0.000 0.0 0.000
TABLE 6: SIZE DISTRIBUTION REPORTS BY INTENSITY, NUMBER AND STATISTICS
Items Mean in μm Mean in nm SD
O.F. 25000x 0.0978 0.0724 0.0838 0.0855 0.084875 84.875 0.010396 Mico 2. 25000x 0.0475 0.0646 0.0354 0.049167 49.168 0.014671 Mico 4. 25000x 0.0427 0.0499 0.0289 0.0451 0.0578 0.0519 0.04605 46.05 0.009933
TABLE 7: MEASURMENTS OF PARTICLE SIZE BY TRANSMITION ELECTRON MICROSCOPE
706
addition of surfactants blend to the different phases, the time required for mixing, the speed of mixing process, the type and properties of mixing machine in use, the addition and/or the removal of a material, the usage of an alternative method of emulsion preparation, agitation process, changing of the water phase compositions and their concentration in the emulsion under investigation. Lin[52] concluded that in many systems tested, while the addition of a surfactant to an already emulsified system could enhance its stability, the addition of the same amount of the same surfactant prior to emulsification can hinder the emulsification process and could cause the formation of unstable emulsions and also that, the presence of certain hydrophilic or lipophilic surfactants, at amount in excess of the quantities needed/required for optimum emulsification can sometimes result in a degradation of o/w emulsion. So the trials of increasing the storage temperature and hence increasing the stability may include the addition of amount in excess of the OSB to an already emulsified system as the increase of the stability will indirectly increase the YVT. This amount in excess of the surfactant blend and the other mentioned factors should be discussed and studied. However, it should be noted that there has been considerable interest in the development and utilization of particle-based emulsifiers recently, which are capable of stabilizing emulsions through a Pickering stabilization mechanism. These particles may also be used in mixtures with molecular emulsifiers or with other particle-based emulsifiers to improve emulsion stability or create improved functional attributes[53]. The work of Enver[54] indicated that the programmed viscometric technique of determining inversion revealed the presence of a liquid crystalline phase below 35°, which contributes significantly to emulsion stability. Hence these results indicated that the increase in the storage temperature of emulsion to 30° is accompanied by an increase in its stability. Increasing temperature beyond 30° is possible and would result in subsequent increase in stability due to the presence of the liquid crystalline phase, which contributes significantly to emulsion stability while the destructive effect of the temperature starts at 35°. Theoretically and logically this suggestion is right according to this work and Enver’ work but actually it needs practical confirmation and should be studied. The importance and strength of this work lies in its applicability to determine the storage temperature of materials, pharmaceuticals, foods and cosmetics obeying non-Newtonian plastic flow (Kadry’ theory). the temperature i.e. they are not characterized by their
PITs like nonionic surfactants cream, so they are not assessed according the ASTP previously reported for O/W emulsions stabilized by nonionic surfactants. The storage temperatures of creams prepared by anionic, amphoteric, cationic and nonionic surfactants were determined by the determination of the YVT of its temperature-conductivity relationship i.e. the storage temperature was determined whatever the surfactants type used. Srilane cream is an example of an O/W cream formulated by anionic surfactants (Emulgade F) and has storage temperature equal to 24°. This temperature is revealed in fig. 1. Adjusting and resetting of the pre-determined storage temperature of O/W emulsions prepared by anionic, cationic and amphoteric surfactants should be studied.
707
July-August 2019
Acknowledgments:
The author would like to thank United Pharmaceutical Industries, Cosmetics and Chemicals SAE Co. (UPICC Co.), Cairo, Egypt and Alaa Ahmed Kadry for her assistance.
Conflict of interest:
The authors declare no conflict of interest.
REFERENCES
1. Schumacher P. The impact of climate classification on the stability of medicines. Die Pharm Ind 1972;34:481-83. 2. Grimm W. Storage conditions for stability testing (Part 2).
Drugs Made Germany 1986;29:39-47.
3. Grimm W. Extension of the International Conference on Harmonization Tripartite Guideline for stability testing of new drug substances and products to countries of Climatic Zones III and IV. Drug Dev Ind Pharm 1998;24:313-25.
4. Specifications for Pharmaceutical Preparations. Fortieth Report. Geneva, World Health Organization 2006 (WHO Technical Report Series, No. 937). [cited 2018 Jul 27]. Available from: http://whqlibdoc.who.int/trs/WHO_ TRS_937_eng.pdf.
5. Guidelines for stability studies in global environment. Geneva, WHO 2004, (working document QAS/05.146 with comments). Available from: https://www.who. int/medicines/services/expertcommittees/pharmprep/ QAS05_146Stabilitywithcomments.pdf.
6. Stability testing of new drug substances and products. ICH Guidelines 2003; ICH Q1A (R2): Current Step 4. [cited 2018 Jul 27]. Available from: https://www.ema.europa.eu/en/ documents/scientific-guideline/ich-q-1-r2-stability-testing-new-drug-substances-products-step-5_en.pdf.
7. Stability testing of active pharmaceutical ingredients and finished pharmaceutical products. Geneva, World Health Organization 2018; Annex 10. [cited 2018 Jul 27]. Available from: https://www.ich.org/fileadmin/Public_Web_Site/ ICH_Products/Guidelines/Quality/Q1F/Stability_Guideline_ WHO_2018.pdf.
8. Bajaj S, Singla D, Sakhuja N. Stability Testing of Pharmaceutical Products. J Appl Pharm Sci 2012;2(3):129-38. 9. Singh S, Bakshi M. Guidance on conduct of stress test
to determine inherent stability of drugs Pharm Technol 2000;S1:S24-36.
10. Specifications for Pharmaceutical Preparations. Geneva, WHO 1990 (WHO Technical Report Series, No. 790). [cited 2018 Aug 16]. Available from: https://apps.who.int/iris/bitstream/ handle/10665/37956/WHO_TRS_790.pdf?sequence=1. 11. Specifications for Pharmaceutical Preparations. Thirty-fourth
report, Geneva, WHO 1996; Annex 5 (WHO Technical Report Series, No. 863). [cited 2018 Aug 16]. Available from: https:// apps.who.int/iris/bitstream/handle/10665/41849/WHO_ TRS_863_(p1-p98).pdf?sequence=1.
12. Specifications for Pharmaceutical Preparations. Thirty-seventh report, Geneva, WHO 2003; (WHO Technical Report Series, No. 908). [cited 2018 Aug 16]. Available from: https://apps. who.int/iris/bitstream/handle/10665/42613/WHO_TRS_908. pdf?sequence=1.
13. Specifications for Pharmaceutical Preparations. Fortieth
report, Geneva, WHO 2006; (WHO Technical Report Series, No. 937). [cited 2018 Aug 16]. Available from: https://apps. who.int/iris/bitstream/handle/10665/43443/WHO_TRS_937_ eng.pdf;jsessionid=B0F8AA0165C2722F84C7D2C28FE0F8 8B?sequence=1.
14. Stability testing of active pharmaceutical ingredients and finished pharmaceutical products. Geneva, WHO 2009; Annex 2 (WHO Technical Report Series, No. 953). Available from: https://apps.who.int/iris/bitstream/handle/10665/44553/ WHO_TRS_953_eng.pdf?sequence=1.
15. Specifications for Pharmaceutical Preparations. Forty-second report, Geneva, WHO 2008; Annex 4 (WHO Technical Report Series, No. 948). [cited 2018 Aug 16]. Available from: https:// apps.who.int/iris/bitstream/handle/10665/43852/WHO_ TRS_948_eng.pdf?sequence=1.
16. Specifications for Pharmaceutical Preparations. Thirty-ninth report. Geneva, WHO 2005; Annex 5 (WHO Technical Report Series, No. 929). [cited 2018 Aug 21]. Available from: https:// apps.who.int/iris/bitstream/handle/10665/43157/WHO_ TRS_929_eng.pdf?sequence=1.
17. Quality assurance of pharmaceuticals. Good manufacturing practices and inspection. Geneva, WHO 2007. Available from: https://www.who.int/medicines/areas/quality_safety/quality_ assurance/QualityAssurancePharmVol2.pdf.
18. Specifications for Pharmaceutical Preparations. Forty-first report. Geneva, WHO 2007; Annex 6 (WHO Technical Report Series, No. 943). [cited 2018 Aug 21]. Available from: https:// apps.who.int/iris/bitstream/handle/10665/43632/WHO_ TRS_943_eng.pdf?sequence=1.
19. Accelerated stability studies of widely used pharmaceutical substances under simulated tropical conditions. Geneva, WHO1986; (WHO/PHARM/86.529). [cited 2018 Aug 21]. Available from: https://apps.who.int/iris/ bitstream/handle/10665/61480/WHO_PHARM_86.529. pdf?sequence=1&isAllowed=y.
20. Guidelines for stability testing of pharmaceutical products containing well established drug substances in conventional dosage forms. Geneva, WHO 1996; Annex 5 (Technical Report Series, No. 863). Available from: https://apps.who.int/ medicinedocs/pdf/s5516e/s5516e.pdf.
21. Specifications for Pharmaceutical Preparations. Geneva, WHO 2006; (WHO Technical Report Series, No. 937). Available from: https://apps.who.int/iris/bitstream/handle/10665/43443/ WHO_TRS_937_eng.pdf;jsessionid=B0F8AA0165C2722F8 4C7D2C28FE0F88B?sequence=1.
22. Stability testing: Photo stability testing of new drug substances and products. ICH Guidelines 1996; ICH (Q1B): Current Step 4. [cited 2018 Aug 21]. Available from: https://www.ich. org/fileadmin/Public_Web_Site/ICH_Products/Guidelines/ Quality/Q1B/Step4/Q1B_Guideline.pdf.
23. Stability testing of new dosage forms. ICH Guidelines 1996; ICH (Q1C): Current Step 4. Available from: https://www.ich. org/fileadmin/Public_Web_Site/ICH_Products/Guidelines/ Quality/Q1C/Step4/Q1C_Guideline.pdf.
24. Bracketing and matrixing designs for stability testing of new drug substances and products. ICH Guidelines 2002; ICH (Q1D): Current Step 4. [cited 2018 Aug 21]. Available from: http://www.ich.org/fileadmin/Public_Web_Site/ICH_ Products/Guidelines/Quality/Q1D/Step4/Q1D_Guideline.pdf. 25. Evaluation for stability data. ICH guidelines 2003;ICH (Q1E):
708
26. Validation of analytical procedures: text and methodology. ICH Guidelines 1994; ICH Q2(R1): Current Step 4 (Complementary Guideline on Methodology dated 6 November 1996 incorporated in November 2005) ICH (Q2R1). [cited 2018 Aug 21]. Available from: https://www.ich.org/fileadmin/ Public_Web_Site/ICH_Products/Guidelines/Quality/Q2_R1/ Step4/Q2_R1__Guideline.pdf.
27. Impurities in new drug substances. ICH guidelines 2006; ICH Q3A (R2): Current Step 4. Available from: https://www.ich. org/fileadmin/Public_Web_Site/ICH_Products/Guidelines/ Quality/Q3A_R2/Step4/Q3A_R2__Guideline.pdf.
28. Impurities in new drug products. ICH guidelines 2006; ICH Q3B(R2): Current step 4. Available from: https://www.ich. org/fileadmin/Public_Web_Site/ICH_Products/Guidelines/ Quality/Q3B_R2/Step4/Q3B_R2__Guideline.pdf.
29. Stability testing of biotechnological/biological products. ICH Guidelines 1995; ICH (Q5C): Current Step 4. [cited 2018 Aug 21]. Available from: https://www.ich.org/fileadmin/Public_ Web_Site/ICH_Products/Guidelines/Quality/Q5C/Step4/ Q5C_Guideline.pdf.
30. Specifications: Test procedures and acceptance criteria for new drug substances and new drug products: Chemical substances. ICH guidelines 1999; ICH (Q6A): Current Step 4. [cited 2018 Aug 21]. Available from: https://www.ich.org/fileadmin/ Public_Web_Site/ICH_Products/Guidelines/Quality/Q6A/ Step4/Q6Astep4.pdf.
31. Specifications: Test procedures and acceptance criteria for biotechnological/biological products. ICH guidelines 1999; ICH (Q6B): Current Step 4. [cited 2018 Aug 21]. Available from: https://www.ich.org/fileadmin/Public_Web_Site/ICH_ Products/Guidelines/Quality/Q6B/Step4/Q6B_Guideline.pdf. 32. Expiration dating and stability testing for human drug
products. Inspection technical guide. Rockville, MD, FDA. [cited 2018 Aug 21]. Available from: https://www.fda. gov/inspections-compliance-enforcement-and-criminal- investigations/inspection-technical-guides/expiration-dating-and-stability-testing-human-drug-products.
33. Haynes JD. Worldwide virtual temperatures for product stability testing. J Pharm Sci 197;60:927-29.
34. Schumacher P. Current questions on drug stability. Pharm Zeitung 1974;119:321-24.
35. Grimm W. Storage Conditions for Stability Testing in the EC, Japan and USA. The Most Important Market for Drug Products. Drug Dev Ind Pharm 1993;19:2795-830.
36. Bott RF, Oliveira WP. Storage conditions for stability testing of pharmaceuticals in hot and humid regions. Drug Dev Ind Pharm 2007;33:393-401.
37. Zahn M, Kållberg PW, Slappendel GM, Smeenge HM. A risk-based approach to establish stability testing conditions for tropical countries. J Pharm Sci 2006;95:946-65.
38. Guideline on stability study of drug product. ASEAN 9th ACCSQ-PPWG Meeting, Philippines 2005; version 22. Available from: https://ww2.fda.gov.ph/attachments/article/95567/1%20 ASEAN%20Guideline%20on%20Stability%20Study%20 of%20Drug%20Product%20(February%202005).pdf.
39. Adeyeye MC, Jain AC, Ghorab MK, Reilly WJ Jr. Viscoelastic Evaluation of Topical Creams Containing Microcrystalline Cellulose/Sodium Carboxy methyl Cellulose as Stabilizer. AAPS PharmSciTech 2002;3(2):E8.
40. Jaganath N. The Application of Rheological Techniques in the Characterization of Semisolids in the Pharmaceutical Industry [dissertation]. Port Elizabeth, South Africa; Nelson Mandela Metropolitan University; 2004. p. 11-12.
41. Kaur LP, Guleri TK. Topical Gel: A Recent Approach for Novel Drug delivery. Asian J Biomed Pharm Sci 2013;3(17):1-5. 42. Bhasha SA, Khalid AS, Duraive S, Bhowmik D, Kumar
SKP. Recent trends in usage of polymers in the formulation of dermatological gels. Indian J Res Pharm Biotechnol 2013;1(2):161-8.
43. Hassan AK. Effective surfactants blend concentration determination for O/W emulsion stabilization by two nonionic surfactants by simple linear regression. Indian J Pharm Sci 2015;77(4):461-9.
44. Hassan AK. New accelerating stability testing protocol for O/W emulsions stabilized by nonionic surfactants including storage temperature determination. Indian J Pharm Sci 2016;78(3):395-401.
45. Hassan AK. Assignment of Optimum Surfactants Blend and Right Oil Phase Concentration of Oil-in-water Emulsion. Indian J Pharm Sci 2018;80(2):334-41.
46. Sinko PJ, Singh Y. Martin’s Physical pharmacy and pharmaceutical sciences. Baltimore: Lippincott Williams and Wilkins; 2011.
47. Salopek B, Krasi D, Filipovi S. Measurement and application of zeta- potential. Rudarsko-Geolosko-Naftni Zbornik 1992;4:147-51.
48. Prinderre P, Piccerelle PH, Cauture E, Kalantzis G, Reynier JP. Formulation and evaluation of o/w emulsions using experimental design. Int J Pharm 1998;163:73-9.
49. Bagwe RP, Kanicky JR, Palla BJ, Patanjali PK, Shah DO. Improved drug delivery using microemulsions: Rationale, recent progress, and new horizons. Crit Rev Ther Drug Carrier Syst 2001;18:77-140.
50. De Morais JM, Santos ODH, Delicato T, Rocha-Filho PA. Characterization and evaluation of electrolyte influence on canola oil/water nano-emulsion. J Dis Sci Technol 2006;27:1009-14.
51. Lin TJ, Kurihara H, Ohta H. Effects of phase inversion and surfactantlocation on the formation of O/W emulsions. J Soc Cosmet Chem 1975;26:121-39.
52. Lin TJ. Adverse effects of excess surfactants upon emulsification. Cosmetics Toiletries 1991;106:71-81.
53. McClements DJ, Jafari SM. Improving emulsion formation, stability and performance using mixed emulsifiers: A review. Adv Colloid Interface Sci 2018; 251:55-79.