IJEDR1703154
International Journal of Engineering Development and Research (
www.ijedr.org
)
1095
Automatic control of On Load Tap Changing of
Transformers for Enhancement of Voltage Stability
1
Dr.V.S.Vakula,
2Mr.chetlapalli sai praveen,
3Mr.Niddan Rames
1Assistant professor, 2 PG Student, 3 PG Student 1 Department of Electrical and Electronics Engineering,
1Jawaharlal Nehru Technological University Kakinada- University College of Engineering, Vizianagaram, India. ________________________________________________________________________________________________________
Abstract— Present paper aims to propose an effective scheme for the control of on-load tap changing of transformers. In
this scheme based upon the voltages and currents before and after tap changing the stability index is find out and the required control action is done based upon the index value. In this the proposed method is applied for a standard 10- B BPA system and the results are plotted. Different cases are taken in to the consideration and the proposed system is validated for the voltage stability prediction.
Key Words— Bonneville Power Administration (BPA), On load tap changing (OLTC), Automatic tap changing controller
(ATCC), High Voltage (HV), Low Voltage (LV), Voltage(V), Current (I), Tap changing Stability index (TCSI), Over Excitation Limiter (OXL), Stability index (SI), Bus (B),Operational Planning (OP),Operational control(OC), Fast Decoupled Load Flow (FDLF), Reactive power(Q).
___________________________________________________________________________________________________
I.INTRODUCTION
In modern power transformers OLTC is equipped with the ATCC to maintain LV side voltage within a dead band set value. Thus ATCC of power transformer react to the changes in the low voltage side. It also react to the different levels on H.V side. Thus with the voltage decays the set point system try to restore the voltage by changing the tapping’s of power transformer. But due to ATCC operation there is a chance of control action in a reverse passion i.e., Before the extreme condition even though with the tap changing the LV side voltage will not improve but decays [1-5]. To overcome the problem several methods in the history has been present.
In one of the scheme no of High voltage side LV stages is used for the control action required [2]. But by this method there was no proper relation between levels of V and OLTC lack of stability condition. Due to this instead of mitigating the problem it will magnify the problem to a greater extent ex: capacitor bank switching. In [3] a method has been suggested that is based on the LV side changes of voltages.
Due to the disturbance there will be significant drop in the voltage which will in turn energizes the ATCC to restore the voltage level. Due to the tap changing of transformers resembles to the decay in the load voltage which is looked from the High voltage side and at one point it is equal to system impedance. Beyond this point with the change the tapping’s results to the reverse action of transformers [10].Thus at the critical point there will be maximum power. Beyond this results to the decay in the power. Therefore there must be a built in scheme to estimate the admittance of the system which offers an excellent phenomenon for the ATCC operation.
Several methods are introduced in the literature to estimate the parameters [11-17].But in these methods between two instants it is considered only the changes in the load side but not in the supply side of the system [18]. Thus for long time interval there will be consideration of supply system side also. But for shorter time there will be not much variation in the measurements results to the impossible to estimate the equivalent admittance. Even though different processing of data techniques are used to raise the precession of the equivalent value there is no decay in the problem [19]
Hence a scheme must be developed to monitor the voltage stability for the shorter duration of changes.
In this research work a new scheme is developed to measure ‘V’ and ‘I’ of power transformer with the presence of OLTC to estimate TCSI. The new modern system in the presence of ATCC have the ability to calculate the V, I on H.V and L.V sides of the power transformer [20].In this paper a method is introduced how the voltages and currents before and after tap-changing is used to estimate simple TCSI which is used to provide the stability of on load tap changing of transformers. Finally the method is put forward to the10-B BPA test system and the results are plotted for different cases such as one line outage, two line outage, with load shedding, with capacitor bank injection and with D-STATCOM at the B.
II.METHODOLOGY
IJEDR1703154
International Journal of Engineering Development and Research (
www.ijedr.org
)
1096
A. Fast Decoupled Load Flow.
Load-flow calculations are carried out in OP, OC and system planning. The ability to choose a correct method for practical application is occurring many times is difficult. It requires a careful analysis of the comparative merits and demerits of the many available methods such as storage, Convergence characteristics and speed. But researchers tried to build a system with all the merits mentioned and finally a best method described by them is FDLF method.
It is the modification of the Newton Ramphson method.
In general any transmission line there will be very high X/R ratio. So, changes in the real power is less sensitive to the changes in the phase voltage and less sensitive to the change in the phase angle.
In the same way Q is less sensitive to the change in the phase angles and mainly depends upon the |∆𝑉|.
Hence from the above two points there will be modification in the N-R method matrix format as follows with J2=0; J3=0;
(∆𝑃
∆𝑄) = [
𝐽1 0
0 𝐽4] (
∆𝛿
∆𝑉)
∆𝑃 = 𝐽1 ∆𝛿 = [𝜕𝑃𝜕𝛿] ∆𝛿
∆𝑄 = 𝐽4∆𝑉 = [𝜕𝑄𝜕𝑉] ∆𝑉
The main advantage of this load flow method is it will take less time per iteration and the memory consuming per iteration will be less.
B. Automatic Tap Changing Controller Of Transformers
To mitigate the voltage instability problem one of the best way is the tap changing of the transformers. In general this is done in two ways one is off-load tap changing and the other is on-load tap changing.
In the recent years OLTC is combined with ATCC to improve the stability criteria of the system.
Thus the main aim of the ATCC is to maintain the LV side ‘V’ of the transformer in the pre-set dead band.
C. TCSI
Consider a simple power system with a transformer and voltage source as shown in the figure-1.
H.V Side L.V Side
AC
E
Vp
Vs
Load end
N : 1
Figure-1: Equivalent Circuit of on Load Tap Changer with load.
For a time instant T, Due to the dynamic changes in the load side (or) at the supply side there is a change in the ‘V’ at the load end. OLTC make efforts to restore the voltage at the load end to a pre-defined dead band by changing the turn’s ratio.
The criterion for the voltage stability of the system is obtained by the TCSI
𝑇𝐶𝑆𝐼 =𝑐ℎ𝑎𝑛𝑔𝑒 𝑖𝑛 𝑐𝑢𝑟𝑟𝑒𝑛𝑡
𝑐ℎ𝑎𝑛𝑔𝑒 𝑖𝑛 𝑣𝑜𝑙𝑡𝑎𝑔𝑒> 1
TCSI is defined as the change in the OLTC current on primary side to the change in the primary side voltage with all the parameters considered in per unit.
D. Control Of On Load Tap Changers In Automatic Way:
The regular surveillance system for OLTC stability is included in the modern systems to develop OLTC automatic control Figure-2 shows the principal of the typical scheme.
When the calculated value of ATCC is greater than one then the system is said to be in stable region. The ATCC will ↑ (𝑜𝑟) ↓
the tap on the HV side to maintain the LV side voltage within the dead-band.
IJEDR1703154
International Journal of Engineering Development and Research (
www.ijedr.org
)
1097
Calculate TCSI
<1
=1
>1
Normal
Reduce set point
Block ATCC operation
Decision
P.T1 P.T2
C.T1 C.T2
Raise
Lower
Figure-2: Principal of OLTC control scheme.
When the value of TCSI is less than one then ATCC set point is reduced which resembles the reverse control action of the transformer. Hence to overcome this condition either of the controlling scheme is performed i.e., load shedding, Introducing of capacitor bank, Introducing of the D-STATCOM is made to avoid the voltage instability condition.
Run Fast decoupled Load Flow Program
Initiate OXL after 2 seconds of fault creation till 100 seconds
Calculate the No of Line Outages
Switching of Capacitor Bank (or) D-STATCOM (or) Load Shedding
OLTC is in Stable Region
STOP START
Read Load Flow Data
NO (TCSI=1)
Block ATCC Operation Form Y-bus
Check for fault presence
If V, I are within limits
No-Action is Required
Initiate Tap changing of transformer after 100 seconds
Calculate TCSI
Check V-I limits
If V, I are within limits
No-Action is Required
If TCSI<1
If TCSI>1 ATCC Set Point
Reduction
NO YES
YES
YES
NO
YES NO
YES NO
IJEDR1703154
International Journal of Engineering Development and Research (
www.ijedr.org
)
1098
III.SIMULATION RESULTSThe method is put forward to the 10-B BPA test system to validate and investigate the proposed system.
A. System Description
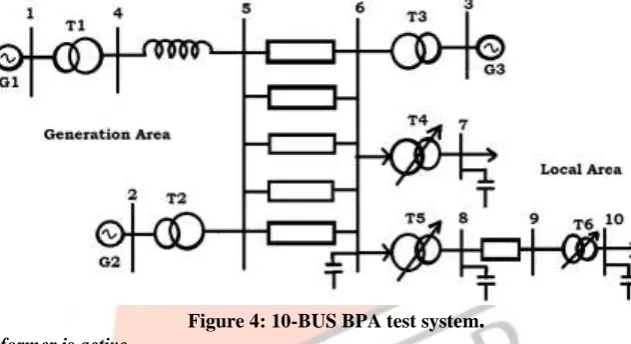
To illustrate the mechanism of voltage instability analysis in time domain passion for 10-B BPA test system which was developed by the CIGRE task force on 28-02-08 was considered [24-28]
10-B BPA system line diagram is present below in figure-4.All the system data was considered from [29]. The local area is fed by three generators by five transmission lines. B connected to G1 is modeled as infinite B and the G2, G3 are modeled as third order model system in this paper. Excitation system and over excitation limiter is considered for the generators system. All the parameters of generators are present in [24]. Characteristics of excitation limiter are present in [30].
Transformers T4, T5, T6 are modeled with OLTC’s. There will be 10 seconds time delay for every tap movement. Load at B-10 is modeled as composite load, power loads of constant magnitude. Load at B -7 is modeled as load of constant impedance. For every case the fault is initiated at T=50 sec and cleared by one line outage (or) Two line outage in the transmission corridor. Due to which the load shared on the other transmission lines is comparatively increased. This event causes sudden changes in the system different B voltages.
For every case the OLTC equipped with the ATCC which is in the active state will react if the LV side voltage is out of dead band. Over excitation limiter is in ‘on’ in between T= 50 to 100 seconds. First operation of OLTC starts at T=100 seconds and subsequent operations after 10 seconds time delay. The tap limits are 1± 0.15 with 1.5% steps and dead band of each tap is ±1%. Different cases were considered for the validation of the proposed system. In every case the scenario of fault creation starts at 50 seconds and the OXL is ‘on’ for the first 50 seconds after the fault creation and then tap changing is done with 1±0.5 dead band of tap ratio for each tapping and is done for every 10 seconds time difference.
Figure 4: 10-BUS BPA test system.
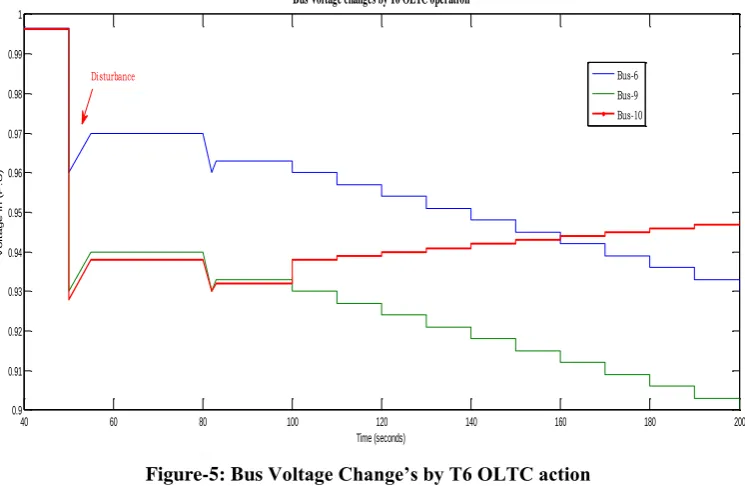
Case-1: OLTC of T6 transformer is active
The OLTC’s of T4, T5 are inactive and T6 is active in this case. With the change in tapping’s of T6 results to the variation in B-voltages of B-6 and B-9 following by a one line outage in the transmission corridor i.e.,between B5 and B6. OEL of G3 is activated in between 50 sec to 100 sec.
From the simulation results it is clear that with the changing of tapping of T6 the voltage at B-10 is increasing and the voltages at B-6, B-9 are decreasing and the currents are vice versa.
The results are shown in the below Figure.
Fault is initiated at T=50 seconds at B-5 due to this the voltages at B-10 decays from 1 P.U to 0.93 P.U which is out of dead band.
To improve the voltage OEL of G3 is “ON” in between t=50 to 100 seconds. Due to this the voltage at B-10 increases from 0.93 to 0.94 P.U. But this voltage is also out of dead band. To overcome this tap changing of T6 transformer is initiated at T=100 seconds.
IJEDR1703154
International Journal of Engineering Development and Research (
www.ijedr.org
)
1099
Figure-5: Bus Voltage Change’s by T6 OLTC actionFigure 6: HV side current changes of T4-T6 by T6 OLTC operation.
By load flow studies V and I is calculated and tap changing of transformer T6 starts at T=100 sec. The change is made at rate of 1±0.5% per tap.
The voltages and currents before and after the tap changing is used to find the TCSI. By the results it is confirmed that after the 9th tapping the index value is in stable region.
In the same way for two line outages in the transmission corridor again load flow studies is made to find the TCSI.
For the two line outage the voltage drops from 1 P.U to 0.86 P.U with the initiation of the fault at T=50 seconds which is out of the dead band. Hence between T=50 seconds to 100 seconds over excitation limiter is in ‘ON’ condition. After 100 seconds Tap changing is initiated.
For every 10 seconds time duration one step of tap changing varies. With the change of tapping there is the change in voltage and current. Based upon the values of V, I before and after tap changing tap changing stability index is calculated. If the value of index drops below the stability limit line and that point is called the ATCC set point reduction point.
After 9th tapping it is confirmed that the index value decays below the stability line which represents the system enters in to the un stable region and hence the required control action to be taken either bychanging the tapping in the reverse order than the previous one. The simulation results are as follows
40 60 80 100 120 140 160 180 200
0.9 0.91 0.92 0.93 0.94 0.95 0.96 0.97 0.98 0.99 1
Time (seconds)
V
o
lt
a
g
e
in
(
P
.
U
)
Bus Voltage changes by T6 OLTC operation
Bus-6 Bus-9 Bus-10
Disturbance
40 60 80 100 120 140 160 180 200
2 2.5 3 3.5 4 4.5 5 5.5
Time (seconds)
I
(
P
.
U
)
HV side surrent changes of T4-T6 by T6 OLTC operation
IJEDR1703154
International Journal of Engineering Development and Research (
www.ijedr.org
)
1100
Figure-7: Tap ratio, Index and B-10 ‘Voltages’ for one line outage.Figure-8: Tap ratio, TCSI and B-10 voltage for 2- line outage.
Figure-9: Tap ratio, TCSI, Primary voltage and secondary voltage with ATCC pre-set point reduction after ninth tapping.
Case-2: OLTC of T5 transformer is active
In this case OLTC of T5 is active and the transformers T4 and T6 are in-active. Due to a large disturbance in the transmission corridor loading on the other parallel lines will be increased. Due to the fault initiation at T=50 seconds the voltage at B-8 drops from 1 P.U to 0.73 P.U.
The simulation results confirms that after 9th tapping the voltage on the secondary side is unstable and the TCSI value falls less than zero. To neutralize the ATCC instability 10% load in B shed for 2sec after the ninth operation of tap. The simulation results confirms that with the load shedding the index value increases above one which resembles the system enters in to the stable region with the load shedding. Due to load shedding the voltage at B-8 is improved to 0.79 P.U.
40 60 80 100 120 140 160 180 200 220
0.8 0.9 1 1.1 1.2 1.3 1.4 1.5
Time (Seconds)
(P
.U
)
Simulation of tap ratio, TCSI and secondary side voltage in case-1
Tap Ratio Secondary Voltage TCSI Stability Line
40 60 80 100 120 140 160 180 200
0.7 0.8 0.9 1 1.1 1.2 1.3 1.4 1.5 1.6
Time (seconds)
(
P
.U
)
Simulation of TCSI, Tap Ratio, Primary and Secondary Voltages of Bus-10
Stability Line Tap Ratio Secondary Voltage Primary Voltage TCSI
40 60 80 100 120 140 160 180 200 220 240
0.7 0.8 0.9 1 1.1 1.2 1.3 1.4 1.5 1.6
Time (seconds)
(
P
.
U
)
Simulation of T6 Tap ratio, TCSI, Primary and secondary voltages for two line outages
Stability Line Tap Ratio Secondary Voltage Primary Voltage TCSI
IJEDR1703154
International Journal of Engineering Development and Research (
www.ijedr.org
)
1101
Figure-10: Tap ratio, TCSI, B-8 voltage following large disturbance in the supply system resultsFigure-11: Tap ratio, TCSI, B-8 voltage with 10% load shedding after 9th tap operation results.
Case-3: OLTC of T4 transformer active
In this OLTC of T4 is in activated state and the transformers T5 and T6 are in-active. A large disturbance between B 5 and 6 is applied to the system at the time instant T=50 seconds. Due to this the voltage at B-7 drops from 1 P.U to 0.8 P.U. With the initiation of the OEL the voltage is improved to very small value. Hence tap changing of the transformer is initiated for the active ATCC transformer. The simulation results confirms that after the 9th tapping the system enters in to the unstable region. A capacitor bank is inserted in to the system after 2 sec the 9th tap operation. Due to this the voltage at B-7 is improved to 0.96 P.U.
Figure-12: Tap ratio, T4 tap changer stability index and B-6, B-7 voltages following a large disturbance in the transmission corridor results.
40 60 80 100 120 140 160 180 200 220
0.6 0.7 0.8 0.9 1 1.1 1.2 1.3 1.4
Time (sec)
(
P
.
U
)
Simulation of Tap Ratio, TCSI and T5 secondary side voltage in case 2(a)
Tap Ratio Stability line Secondary Voltage TCSI
40 60 80 100 120 140 160 180 200 220
0.5 0.6 0.7 0.8 0.9 1 1.1 1.2 1.3
Time (Seconds)
(
P
.U
)
Simulation of TCSI, Bus Voltages at T5 Transformer,Tap Ratio with 10% Load Shedding after 9th tapping.
Tap Ratio Stability Line Secondary Voltage TCSI Primary Voltage
40 60 80 100 120 140 160 180 200
0.8 1 1.2 1.4 1.6 1.8 2
Time(seconds)
(
P
.U
)
Simulation of Tap Ratio, TCSI, Primary and Secondary Voltages at Bus-6 and Bus-7
IJEDR1703154
International Journal of Engineering Development and Research (
www.ijedr.org
)
1102
Figure-13: Tap ratio, T4 tap changer stability index and B-6, B-7 voltages following a large disturbance in the transmission corridor. A capacitor bank is added to B7 after 9th tapping results.Case-4: OLTC of transformer T4 active with D-STATCOM injection after 9th tapping
In this case OLTC of T4 active and the remaining are in-active. A large disturbance in the transmission corridor is initiated at T=50 seconds. Due to this the voltage drops from 1 P.U to 0.8 P.U. To improve the voltage OEL is ‘On’ in between T=50 to 100 seconds. From T=100 seconds the transformer with the active OLTC will start change the tapping for every 10 seconds. After 9th tapping the system enters in to the unstable region. To avoid the instability we introduce D-STATCOM in the load end after 2 sec to improve the system in to stability condition.
With the injection of the D-STATCOM at the load end the voltage at B-7 improves to 1 P.U.
Figure-14: Simulation of tap ratio, T4 tap changer stability index and B-7 voltages with a disturbance in the transmission corridor. A D-STATCOM is connected to B7 after ninth tapping.
IV.CONCLUSION
An OLTC automatic control scheme is introduced for power transformer. The advantages of the proposed system is that it uses the voltage and current on both sides of the power transformer, due to the changes in the OLTC operation, for the regular surveillance of OLTC stability by calculating a simple index. The simulation results confirms that D-STATCOM will improve the voltage profile than the capacitor bank and OLTC operation by ATCC become very useful to mitigate the voltage instability condition.
REFERENCES
[1] Power System Voltage Stability, C.W Taylor, Tata Mc Graw hill Publications- 1994.
[2] Zoran. Gajic and Samir. Aganvoic, (2009), Advanced tap changer control to counteract power system voltage instability. ABB AB, Substation Automation products, SE-721 Vasteras, Sweden.
40 60 80 100 120 140 160 180 200
0.8 1 1.2 1.4 1.6 1.8 2
Time (seconds)
(
P
.
U
)
Simulation of Tap Ratio, TCSI, Primary and Secondary Voltages
Stability Line Tap Ratio Secondary Voltage Primary Voltage TCSI
40 60 80 100 120 140 160 180 200
0.8 1 1.2 1.4 1.6 1.8 2
Time (Seconds)
(P
.U
)
D-STATCOM injection after 9th tapping of Transformer-T4
IJEDR1703154
International Journal of Engineering Development and Research (
www.ijedr.org
)
1103
[3] Costas D Vournas and Thirrey.Van Custem “LOCAL IDENTIFICATION OF VOLTAGE EMERGENCY SITUATION”,IEEE trans.power syst.,vol 25,no3.pp 1239-1248,Aug,2008.
[4] C.vournas , C.Lambrou, M,galvic and T.Van custem ”An Integrated Autonomous Protection System Against Voltage Instability Based On Load Tap Changers,” in proc. Bulk power system .Dynamic .Control VIII. Buzios brazil, Aug 2010.pp-1-14.s
[5] Y-Y hong and H-Y.wang.,”Investigation of the voltage stability region involving on load tap changers” Electrical power syst.Res.vol.32.no.1.pp.45-54,1995
[6] C.-C. Liu and K.T.Vu,” Analysis of tap changer dynamics and construction of voltage stability regions,” IEEE Trans circuits syst., Vol.19.no.8,pp.541-584,1997.
[7] N.Yorino, A.Funahashi and H.Sasaki, “On reverse control action of on load tap changers”, Electrical power energ syst.,Vol.19,no8,pp.541-548,1997.
[8] K.T.Vu and C.C.Liu, “Shrinking Stability REGIONs and voltage collapse in power systems,” IEEE Trans. Circuits syst I, Fundam Theory Appl., Vol 39,No.4,PP.271-289, Apr.1992.
[9] L.Box, X.Duan and Y.He,”Dyanamical analysis of voltage stability for a simple power system,” Electric Power Energy Syst., vol.23,no-7 ,pp.557-564,2001.
[10]] C.D.Vournas,” On the role of LTC’s in emergency and preventive voltage stability control,” presented at the IEEE/PES power systems stability controls subcommittee meeting , New York, NY, USA,2002.
[11]K.Vu,M.M.Berguvic and D.Novosel and M.Mohan Saha,” Grids get smart protection and control,” IEEE Comput, Appl.Power, Vol-10,no.4, pp.40-44, Oct.1997.
[12]K.Vu,M.M.Beguvic and D.Novosel,” Use of local measurements to estimate voltage stability margin” IEEE Trans.Power syst., vol.14,no.3,pp.1029-1035,Aug.1997.
[13]M.H.Haque,” On-Line monitoring of maximum permissible loading of a Power system within voltage stability limits,” IEEE Proc. Generaton, Transmission and Distribution..
[14]D.E . Jualin et al,”Quantifying proximity to voltage collapse using the voltage instability predictor (VIP),” in Proc.IEEE-PES Summer Meet., Vol.2. Seattle, WA, USA,2000,PP.931-936.
[15]S.A.Arefifar and W.Xu,”Online tracking of power system impedance parameters and field experiences,” IEEE Trans.Power Del., Vol.24,no.4,PP.1781-1788, Oct-2009.
[16]I.Smon , G.Verbic and F.Gubina, “local Voltage Stability index using Tellegen’s Therom,’ IEEE Trans. Power Syst., Vol.21,no.3,PP.1267-1275, Aug.2006
[17]S.A.Soliman,H.K.Temraz and S.M.Ei-Khodrav,” Power System Voltage Stability margin identification using local measurements,” in Proc.Power Eng. Conf.,2003,pp.100-104.
[18]J.Zhao, Y. Yang, and Z.Gro,” A review on on-line voltage stability Monitoring indices and methods based on the local phasor measurements,” in proc.17th power Syst. Comput. Conf., Stockholm, Sweden, Aug.2011.PP.1-6.
[19]L. Li, J.Yu and Z. Liu ,” Research on parameters drift problems in tracking Thevenin equivalent,” Proc. CSEE, Vol.25,no.20.pp.1-5, 2005.
[20]ABB Document (2007). Technical reference manual, Transformer protection IEDRET670.Product version:1.1,ABB AB, SA Products, Vasteras, Sweden, ABB Document 1 MRK 504 086-UEn, Revision.
[21]J.J. Grainger and W.D. Stevenson, Power System Analysis New York, NY, USA: Mc. Graw-Hill, 1994.
[22]M. Bahodorneiad,” On-Line local Load measurements based voltage instability prediction,” Ph.D. dissertation, School Eng. Syst., Queensland Univ. Technol, Brisbane QLD, Australia, 2005.
[23]M.Bahadornejad and G. Ledwich, “ System Thevenin Impedance estimation using signal processing on load B data,” in Proc. IEEE Int Conf. Adv. Power Syst. Control oper. Mang. (APSCOM), Vol.1. Hong kong. Nov.2003,PP.274-279. [24]G.K. Morision, B. Gao and P.Kundur, “ Voltage Stability Analysis Using Static and Dynamic approaches,” IEEE Trans.
Power Syst., Vol 8, no.3,pp.1159-1171, Aug-1993.
[25]M.Larson, “ Coordinated Voltage Control in electrical Power Systems,” Ph.D. dissertation ,Dept. Indust Elect. Eng. Auto., Lund Univ., Lund, Sweden, 2000.
[26]E.G. Potamianakis and C.D. Vournas, " Short-term voltage instability : Effects on synchronous and induction machines,” IEEE Trans.Power Syst.,vol.21,no.2,pp. 791-798, May 2006.
[27]G.K. Morision , B.Gao and P.Kundur, “Voltage stability analysis using static and dynamic approaches,” IEEE Trans Power Syst., Vol. 8, no.3, pp. 1159-1171, May 1993.
[28]M. Larsson. (2002). The ABB power transmission test case.
[29]C.T. Force, ”Tools for simulating Long Term Dynamics,” CIGRE long term dynamics-Phase II, Tech. Rep. 102-GA/TF 38.02.08, ELECTRA no.163, Dec.1995,pp. 150-166.
[30]P. Kundur , Power System Stability and Control. New York, NY, USA: Mc Graw-Hill, 1994.
[31]T. Van Custem and C.D. Vournas, Voltage Stability of Electric power systems. Boston, MA,USA: Kluwer, 1998.