TEACHING UNDERGRADUATES DATA MINING IN ENGINEERING
PROGRAMS
Debra L. Banks
1, Guozhu Dong
2, Huan Liu
3and Amit Mandvikar
4
1 Debra L. Banks, Director of Assessment and Evaluation, CRESMET, Arizona State University, Tempe, Arizona 85287. [email protected] 2 Guozhu Dong, Associate Professor, Dept. of Computer Science and Engineering, Wright State University, Dayton, Ohio 45435. [email protected] 3 Huan Liu, Associate Professor, Dept. of Computer Science and Engineering, Arizona State University, Tempe, Arizona 85287. [email protected] 4 Amit Mandvikar, Research Assistant, Dept. of Computer Science and Engineering, Arizona State University, Tempe, Arizona 85287. [email protected] Abstract - The Teaching Undergraduates Data Mining in
Engineering Programs project was supported by the National Science Foundation. The project was jointly executed between universities. The project objectives were to: (1) develop an undergraduate data mining course that could be taught in semester or quarter systems and within institutions of varying demographics, (2) establish vehicles and approaches to increase student retention in such a course, and (3) identify data mining skills essential to problem solving. This paper reports on the results of our research effort regarding teaching engineering undergraduates data mining techniques in two different university environments in 2003.
Terms: Undergraduate Curriculum, Innovative Curriculum
B
ACKGROUNDThe Teaching Undergraduates Data Mining in Engineering Programs Project, supported by the National Science Foundation’s CCLI Proof-of-Concept grant, was jointly executed between Arizona State University (ASU) and Wright State University (WSU) in Fall 2003. The project’s objectives were to: (1) develop an undergraduate data mining course that could be taught in semester or quarter systems and within institutions of varying demographics, (2) establish vehicles and approaches to increase student retention in such a course, and (3) identify data mining skills essential to problem solving.
This paper reports on the preparation and results of our research efforts in 2003 regarding teaching engineering undergraduates data mining techniques in two different university environments (ASU and WSU). It should be noted that, an undergraduate course in data mining serves different purposes from a graduate course in that it is to train future IT professionals about the fundamentals and state-of-the-art techniques to solve challenging data problems and to nurture tomorrow’s researchers in pursuing advanced fields of data mining.
P
REPARATION FOR THEC
OURSEExplained in this section are the tools developed to evaluate the effectiveness of the course. The tools were on-line tutorials, a rubric to standardize the grading of course projects, and a pre-assessment instrument.
The on-line tutorials were developed to support and facilitate the undergraduate student’s knowledge of conditional probability and independence statistical properties.
The rubric focused on different aspects of a data mining project such as initial preparation of data, mining data, and report writing. The initial preparation of data evaluated the students understanding of data pre-processing that included their conceptual understanding and mathematical/statistical knowledge. To establish inter-rater reliability on rubric use, a training session was provided for the instructors and course assistants. The training involved using five [student] project papers on various data mining topics and evaluated by the ASU and WSU teams. A two-hour teleconference provided a forum to discuss how the “scorers” interpreted the attributes of the rubric and the level to which they were addressed in the papers. Also discussed were grammar and spelling. It was decided that as long as a paper made technical sense it would not be down graded for grammar and spelling errors. The training resulted in slight modifications to two of the eight attributes in the rubric and an agreement among team members as to how to apply and rate attributes when grading project papers.i
The pre-assessment instrument developed by the ASU instructor and research assistant covered basic statistical knowledge in the areas of: estimation, probability, tree searching, and artificial intelligence. The instrument had 13 items that were multiple choice or open-ended. All items were scored correct or incorrect. A reliability test using the Kuder-Richardson 20 coefficient was conducted to measure the instrument’s consistency. Table I provides the statistics from the analysis.
TABLE I.
RELIABILITY ANALYSIS STATISTICS. (N=46)
Variables Mean Variance Deviation Standard Coefficient Reliability
13 5.17 3.702 1.924 0.281
In addition to reliability testing, a classical analysis (distribution of responses) of each item was conducted. Results suggested that the overall pre-assessment instrument would be a very weak indicator of course performance while sub-scales or categories could be a support in further analyses [1, 2]. The evaluator understood the implications
and decided to include the students’ total scores from this instrument for further analysis.
E
VALUATIONM
ETHODOLOGY ANDF
INDINGSThe undergraduate data mining courses at ASU and WSU were evaluated by differences in: (1) courses demographics, (2) breath and depth of the curriculum being offered in semester vs. quarter systems, (3) measures of impact of the curriculum on student retention and performance, (4) levels of student knowledge that the curriculum impacted, and (5) what students and instructors expressed about the course.
The following subsections provide evidence gathered by multiple forms of information: (1) enrollments patterns and course syllabi, (2) student performance on pre-instrument and versus project and overall course performance, (3) projects graded by the aforementioned standardized rubric highlighting attributes of student reasoning, and (4) interviews with the course instructors and student course evaluations.
Institutional and Course Demographics
Tables II and III compare the distributions of undergraduate enrollments by gender and ethnicity in computer science courses and with the data mining courses at ASU and WSU. Note that the data mining courses reflected an expected pattern for ASU but exhibited an abnormal pattern for WSU.ii
TABLE II.
FALL 2003 UNDERGRADUATE ENROLLMENTS IN COMPUTER SCIENCE ENGINEERING COURSES AT BOTH UNIVERSITIES.
ASU WSU
Males: White and Asian 812 (73%) 394 (82%)
Males: Minorities 155 (14%) 32(7%)
Females: White and Asian 92 (8%) 40(8%)
Females: Minorities 56 (5%) 14(3%)
Total 1115 480
TABLE III.
FALL 2003 UNDERGRADUATE ENROLLMENTS IN DATA MINING COURSES AT BOTH UNIVERSITIES.
ASU WSU
Males: White and Asian 27 (75%) 10 (59%)
Males: Minorities 5 (14%) 1(6%)
Females: White and Asian 3 (8%) 6(35%)
Females: Minorities 1 (3%) 0
Total 36 17
Breath and Depth of the Curriculum Offered in Semester v. Quarter Systems
The instructional plan for the undergraduate course was developed to be applicable to semester and quarter systems. The plan consisted of eight modules covering: an overview of data mining, relating data mining to other courses, data
preparation, high-level statistical analysis, classification, clustering, association, and other topics such as visualization, bioinformatics, etc. Each module was divided into expected core and extended parts. The instructors for both calendar systems covered the core parts. The extended parts consisted of advanced techniques suited for more sophisticated students. The two required-course projects addressed (1) data preprocessing, (2) mining association rules and (3) effective communication.
Impact of Curricula on Performance and Student Retention
Comparing the distribution of grades by university, WSU had the higher portion of “A” and “B” level grades. Overall, women compared to men obtained higher grades in the data mining courses but by institutional analysis, the women at WSU performed better than their ASU counterparts (Table IV). By ethnicity/ race the low-enrollments of minority students could not provide a pattern to suggest student achievement (Table V). Student retention at both universities was extremely high: ASU 92% and WSU 96% (Table IV). The students that withdrew from the courses were males and WSU lost its only minority student (Tables V). A transcript analysis of the four students who withdrew from the courses revealed that they had taken and passed advanced mathematics and basic computer courses. Therefore, they should have been able to achieve at least a “C” in data mining.
TABLE IV.
TOTAL ENROLLMENTS IN UNDERGRADUATE DATA MINING COURSES BY UNIVERSITY, GRADE, AND GENDER.
University Female Male Total
ASU W 0 3 3 D or F 0 3 3 C 1 5 6 B 3 11 14 A 0 10 10 WSU W 0 1 1 C 0 1 1 B 1 2 3 A 5 6 11 TABLE V.
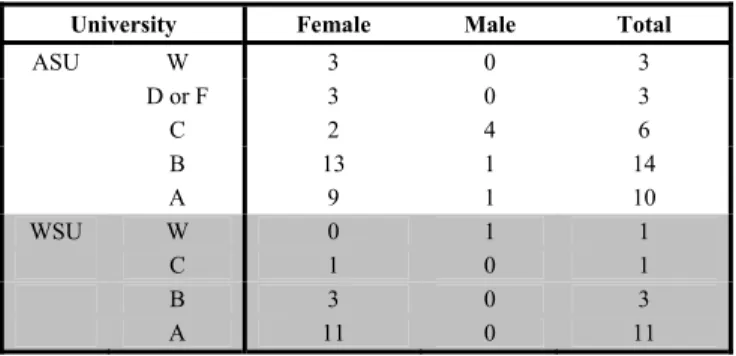
TOTAL ENROLLMENTS IN DATA MINING COURSES BY UNIVERSITY, BY GRADE, AND BY ETHNICITY.
University Female Male Total
ASU W 3 0 3 D or F 3 0 3 C 2 4 6 B 13 1 14 A 9 1 10 WSU W 0 1 1 C 1 0 1 B 3 0 3 A 11 0 11
M
EASURINGS
TUDENTK
NOWLEDGE THAT THEC
URRICULAI
MPACTEDPre-performance Assessment Instrument
Two issues are cited here. First, the WSU enrollments of graduate students could have affected the results of the pre-assessment test. Second, the KR 20 reliability coefficient of the test suggested that the instrument would be totally unreliable for long-term analysis. But, in order to gain an understanding about reliability issues respective to predictive gains, several analyses were explored and/or conducted. Table VI shows slight differences between ASU and WSU pre-assessment scores and mean grades. ii
However, Table VII suggests that the overall distribution of mean total pre-assessment scores by course grade begins to propose a pattern; whereby, those scoring above 4.5 can achieve a course grade of “C” or higher. A regression analysis using grade as the dependent variable demonstrated that the total pre-assessment test score could explain 14% of the variance in the final course grade (Table VIII). The un-standardized coefficient of the total pre-assessment test score of the regression model was significant at a .012 level, thus positioned within a 95% confidence level.
TABLE VI.
TOTALS PRE-ASSESSMENT CORES BY UNIVERSITY. University N Mean Std. Dev Min Max
ASU 29 4.55 1.824 1 8
WSU 17 6.24 1.640 4 10
Total 46 5.17 1.924 1 10
TABLE VII.
MEANS AND STANDARD DEVIATIONS BY GRADES AND TOTAL CORRECT ANSWERS IN THE PRE-ASSESSMENT INSTRUMENT.
Grade N Mean Std. Deviation
W 4 3.50 1.291 F 1 3.00 . D 1 4.00 . C 7 5.57 1.512 B 12 4.58 2.193 A 20 5.95 1.761 TABLE VIII.
LINEAR REGRESSION MODEL.
R R Square Adjusted R Square Std. Error of Estimate .373
(a) .136 .119 1.433
a Predictors: (Constant), Total number of correct answers b Dependent Variable: grade
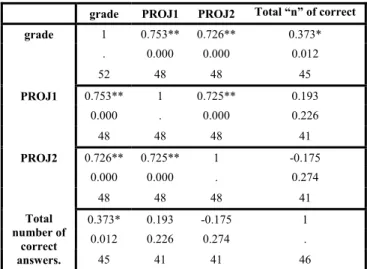
A Pearson’s r correlation was conducted (Table IX) to identify relationships between the pre-assessment scores and the class projects. As suggested by the regression model
(Table VIII), there is a significant but weak moderate relationship between pre-assessment scores and course grades. But there are no significant relationships between the pre-assessment scores and class projects.
TABLE IX.
CORRELATIONS AMONG COURSE GRADE, COURSE PROJECTS, AND PRE-ASSESSMENT TEST SCORE.
grade PROJ1 PROJ2 Total “n” of correct grade 1 0.753** 0.726** 0.373* . 0.000 0.000 0.012 52 48 48 45 PROJ1 0.753** 1 0.725** 0.193 0.000 . 0.000 0.226 48 48 48 41 PROJ2 0.726** 0.725** 1 -0.175 0.000 0.000 . 0.274 48 48 48 41 0.373* 0.193 -0.175 1 0.012 0.226 0.274 . Total number of correct answers. 45 41 41 46
** Correlation is significant at the 0.01 level (2-tailed). * Correlation is significant at the 0.05 level (2-tailed).
What Students Can Learn but Where They Needed Help This section addresses what was discovered about student learning from the class projects and tutoring sessions. As previously stated, the class projects were scored by a standardized rubric. Table X shows that WSU students had higher means and lower standard deviations than the ASU students. Again, it is proposed that this pattern is owing to WSU having predominately graduate students enrolled in its data mining course.
TABLE X. PROJECT SCORES. PROJECT 1 PROJECT 2 N 33 33 Mean % 65 75 ASU Std. Deviation 37 31 N 15 15 Mean % 87 82 WSU Std. Deviation 12 19
Using the attributes of the project rubrics, the course instructors were asked their opinions about what they found in student learning. Their comments are presented as follows.
1. Initial preparation: Understanding the objectives of the project
Several students had some misunderstanding of the project specification. But clarifications helped. [WSU]
Most students had problems with the main objective of data- preprocessing; repeated explanation by the instructor and TA was needed. However, by the second project few students had problem understanding the main objective for association rule mining. [ASU]
2.A. Pre-processing data: Understanding the related concepts and algorithms
Students did fine. [WSU]
Repeated sessions were needed to explain algorithm concepts for about 30% of the students. One session was enough for 20% of the students, while the rest did not seem to have problems. [ASU]
2.B. Pre-processing data: Mathematical & Statistical knowledge
Students had trouble understanding the formulae involved and some had mistakes in implementing those calculations. [ASU]
2.C. Pre-processing data: Confirming Validity
Students did fine. [ASU]
3.A. Mining the data: Understanding the related concepts and algorithms
Several students needed help in completing the details of one step of the algorithm. [WSU]
Repeated sessions were needed to explain algorithm concepts for more than 50% of the students at ASU. [ASU]
3.B. Mining the data: Logical Reasoning
Students did fine (with a few exceptions). [ASU] 3. C. Mining the data: Problem Solving
Students did fine. [ASU]
4. Report Writing: Effective communication
More than 50% of the students did not submit the required documents according to the necessary formats. But, by the second project most of the students followed the formatting instructions. [ASU]
Since the ASU data mining had the better representation of undergraduates, the teaching associate (TA) was asked to provide his perceptions of student discovery and processing of knowledge during his tutoring. The ASU’s TA’s frames his accountings in a dimensional format comparing course requirements against approaches in logic, mathematical reasoning, and conceptual understanding.
1. Introduction
Logical Understanding: No students had any need for tutoring.
Math Understanding: No students had any need for tutoring.
Conceptual Understanding: No students had any need for tutoring.
2. Data Pre-processing
Logical Understanding: A few students had some problems with programming logic, sorting, etc.
Math Understanding: Few students had problems with formulae and calculations involved in data normalization, binning, etc.
Conceptual Understanding: Many students had problems understanding algorithms like binning, normalization, and feature discretization.
3. Association rules
Logical Understanding: A few students had some problems with programming logic, sorting, etc.
Math Understanding: No students had any need for tutoring.
Conceptual Understanding: Many students had problems understanding and implementing the a priori algorithm and hashing techniques.
4. Classification
Logical Understanding: No students had any need for tutoring.
Math Understanding: Some students had problems with entropy calculations for DTs, and probability calculations for NBC.
Conceptual Understanding: Most students understood the algorithms well enough. A few exceptions had problems with NBC.
5. Clustering
Logical Understanding: No students had any need for tutoring.
Math Understanding: No students had any need for tutoring.
Conceptual Understanding: Some students had problems understanding the k-means and the k-medoids algorithms.
6. Evaluation
Logical Understanding: No students had any need for tutoring.
Math Understanding: No students had any need for tutoring.
Conceptual Understanding: No students had any need for tutoring.
His accountings suggest that the properties of algorithms requiring both inductive and deductive reasoning were a major problem for students to comprehend. What could also validate his observations is the section of the pre-assessment instrument that had five questions addressing tree searching (this evidence is available but not displayed here). A comparison of students’ scores by institution in tree searching showed WSU students had significantly higher scores than ASU students. The point being made here is that WSU students were possibly better prepared to understand the properties of algorithms.
W
HAT THES
TUDENTSE
XPRESSED ABOUT THEC
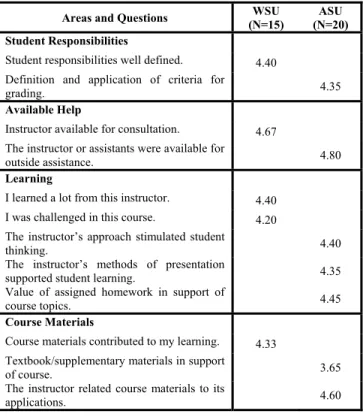
OURSEStudent course evaluations were used to capture their opinions about how the course impacted their learning. In the original evaluation design, an end-of-course survey would have been administered. However, it was felt that student course evaluations may be a more useful tool because students are familiar with and more trusting of
course evaluations required by the “institution” than an unknown source. It was also recognized that similar items between the two universities could not be compared in a normative manner owing to item wording and ranking differences. In other words, between universities items addressing the same construct would be worded differently and their ranking scales may be different. For example, the ASU five-point ranking scale is: 5=very good, 4=good, 3=fair, 2=poor, and 1=not applicable; whereas, the WSU five-point ranking scale is: 5=Strongly agree, 4=Somewhat agree; 3=Neutral; 2=Somewhat disagree; 1=Strongly disagree.
TABLE XI.
STUDENT MEAN RESPONSES TO COURSE EVALUATIONS BASED ON A FIVE-POINT SCALE.
Areas and Questions (N=15) WSU (N=20) ASU Student Responsibilities
Student responsibilities well defined. 4.40
Definition and application of criteria for
grading. 4.35
Available Help
Instructor available for consultation. 4.67
The instructor or assistants were available for
outside assistance. 4.80
Learning
I learned a lot from this instructor. 4.40
I was challenged in this course. 4.20
The instructor’s approach stimulated student
thinking. 4.40
The instructor’s methods of presentation
supported student learning. 4.35
Value of assigned homework in support of
course topics. 4.45
Course Materials
Course materials contributed to my learning. 4.33 Textbook/supplementary materials in support
of course. 3.65
The instructor related course materials to its
applications. 4.60
Selected ASU students’ comments: What did you like most about this course? (Comments about “What was least liked in the course” were omitted owing to an unrelated focus on learning and/or the curriculum.)
• Wonderful programming projects that directly relate to the material and concepts covered in class.
• The projects were good. I also enjoyed how the material was related to real life situations.
• Homework assignments were thought provoking and induced learning.
• The topic was new and covered an emerging and growing concept. It is lends to easy transfer of knowledge between school and work.
• I learned a lot in this course. I have already used some of the techniques in other classes and at work. I really enjoyed it!
• I liked the projects. They connected to the real life examples.
• It’s a very good course and should be offered every semester; the instructor did a good job in explaining the material and connecting to the real world application which is very essential.
W
HAT THEI
NSTRUCTORSE
XPRESSED ABOUTTHE
C
OURSEFrom ASU: Data mining is a very different course compared to other undergraduate engineering statistical courses. I noticed at the beginning of the course that students found it difficult in preparing and manipulating data for efficient processing. However, the course projects gave them an opportunity to discover and apply their programming skills to solve problems. In doing the course projects, students had their very first opportunity to deal with "real-world" data. They had problems to visualize the data, manipulate them for processing. We took a real-world data from a benchmark data website on bioinformatics for the two projects. To gradually introduce students to the real-world data, we reduced the data by decreasing the number of data attributes from 2000 to 100. In class discussions, we constantly reminded students that they needed to consider becoming intimate with their data. In addition, we devised challenges for students to maximize use their knowledge in handling large data sets. The students were provided with larger data sets with gradually increasing number of attributes. This enabled the more sophisticated students to advance their skills in using data that are more realistic.
From WSU: Students appreciate the skills they learned in the course. Several students expressed interest in working in the graduate studies with me after the course, and two students worked with me on data mining research problems without pay because they are interested in the area. I think the use of micro-array gene expression data for cancer in both projects was a good idea, in motivating students to appreciate the usefulness of data mining, in consolidating skills learned in class, and in developing further interest in students for future work in data mining.
C
ONCLUSIONS ANDR
ECOMMENDATIONSThe conclusions of this report cover the observed results of the project and then propose a revision of the project. The project was designed to adapt an undergraduate data mining course in semester and quarter systems using enhanced features to promote student success in the courses.
The results are skewed by enrollments within the two universities in that one institution had undergraduate enrollees; whereas, the other institution had primarily
graduate enrollees. Fortunately, ASU had the larger number of undergraduates (N=34) and therefore becomes our focus for concluding remarks. Reports from the ASU instructional team are consistent with the emerging literature emphasizing that conceptualizing data base architecture and applying algorithms can be a major learning problem for undergraduates. In addition, the ASU’s instructors’ comments suggest that more flexible media could be considered to facilitate the undergraduates’ knowledge discoveries.
The major challenge of data mining is employing knowledge discovery to process large quantities of data, identify the most significant and meaningful patterns, and present such patterns as appropriate to the user’s goals [3]. The cognitive learning theories relating to data base architectures with applied understandings are currently emerging [3, 4, 5, 6]. The underpinnings of data mining work reside with pattern recognition through inductive rather than deductive reasoning. That is, rather than confirming a hypothesis (the aim of deductive reasoning), inductive reasoning moves from specific observations recognizing patterns to a tentative hypothesis [7]. The basic framework exercising inductive reasoning is the compatibility of one’s learning patterns and their ability to employ select functions to appropriately extract and analyze data [6]. Herein lays the challenge of understanding how undergraduates process information so that they can be successfully taught how to negotiate data bases and use appropriate methodologies such as algorithms to extract and analyze data.
It is recommended that the ASU undergraduate data mining course consider the following revisions.
• That the pre-assessment instrument be revised to ascertain students’ abilities to recognize data patterns from an inductive perspective. Such instruments have been developed by Shield [8] for statistical literacy but need be to be shortened for a 30--minute testing period. Furthermore, that the instrument used in this study should retain its tree search and artificial intelligent questions but add data pattern questions. The resulting instrument would have 10 multiple-choice items assigned to pattern recognition and 10 multiple-choice items assigned to tree search and artificial intelligent. The new instruments should be field-tested in at least seven of the 15 institutions offering data mining courses for undergraduates. The responses to the instrument’s item would undergo reliability and predictive validity testing (using course enrollment status and course grade).
• That ASU and WSU instructors incorporate more visualization tools, such as Jeliot, to promote student understanding of data base architecture and applying algorithms [9].
• That the evaluations of undergraduates incorporate more observational studies of how student’s are being tutored and what teaching tools they are using to promote their knowledge of data mining.
E
NDN
OTESi Further testing of inter-rater reliability should have been conducted using
intra-class correlation coefficients. However, because of differences in sample sizes, time, distance between ASU and WSU, and academic freedom (instructor’s right to choose the project’s topic) this analysis could not be conducted.
ii It should be noted that WSU had a dominance of graduate students enrolled in their course. As results are explained in the subsequent sections, the dominance of graduate students may have biased measured student outcomes.
A
CKNOWLEDGEMENTSThis work is supported in part by NSF CCLI grants (DUE-0231448 and DUE-0231245). We greatly appreciate the students at ASU and WSU who participated in this project.
R
EFERENCES[1] Carmines, E.G and Zeller, R.A., “Reliability and Validity Assessment”, 1979, Sage Publications, Thousand Oaks, CA.
[2] Hedden, S., “Characteristics of a Good Evaluative Instrument”,
http://www.u.arizona.edu/~hedden/Reliability.html, 1995.
[3] Deogun, K. S., Raghavan, V. V., and Sever, H., “Introduction”, Journal of the American Society for Information Science, Vol. 49, No. 5, 1998, pp. 397-402.
[4] Ford, N., “The Growth of Understanding in Information Science: Towards a Developmental Model”, Journal of the American Society for Information Science, Vol. 50, No. 12, 1999, pp. 1141-1152.
[5] Rosenfeld, A. and Wechsler, H., “Pattern Recognition: Historical Perspective and Future Directions”, International Journal of Imaging Systems and Technology, Vol. 11, No. 2, 2000, pp. 101-116.
[6] Uesaka, Y., “On A Learning Theory in Which Pattern Structure Is Taken into Account”, Systems and Computers in Japan, Vol. 33, No. 13, 2002, pp. 1013-110.
[7] Trochim, W. M. K., “Deductive and Inductive Thinking”, Deduction & Induction, http://trochim.human.cornell.edu/kb/dedind.htm, 2002. [8] Shield, M., “Statistical Literacy and Mathematical Thinking”, 2000,
Presentation at the ICME-9, Tokyo.
[9] Lattu, M., Meisalo, V. and Tarhio, J., “A visualization tool as a demonstration aid”, Computers & Education, Vol. 41, September 2003, No. 2, pp. 133-148.