Bank Liability Structure
Suresh Sundaresan
⇤Zhenyu Wang
†March 2014
‡Abstract
We develop, and solve analytically, a dynamic model of optimal bank liability structure that incorporates bank run, regulatory closure, endogenous default, and endogenous deposit-insurance premium. Value-maximizing banks choose the ratio of deposits to subordinated debt so that endogenous default coincides with bank closure. Banks’ optimal response to regulatory changes often counteracts regula-tors’ objective in reducing bank failures. For example, the optimal response to the introduction of FDIC is to increase leverage by choosing a higher deposit ratio and a lower subordinated-debt ratio. We also find that banks’ optimal leverage can be substantial even in the absence of material tax benefits.
⇤Columbia University, Graduate School of Business, [email protected]
†Indiana University, Kelley School of Business, [email protected]
‡This version is updated on August 20, 2015 and has benefited from suggestions by Mark Flannery, Nengjiu Ju, Anat Admati, Anjan Thakor, Tobias Adrian, Harry DeAngelo, Rene Stulz, Charles Kahn, Gur Huberman, and Lorenzo Garlappi. We are grateful for comments by the participants in seminars at the Federal Reserve Bank of New York, University of North Carolina at Charlotte, Georgia State University, University of Washington at Seattle, the Reserve Bank of India, Indiana University at Bloomington, University of Illinois at Chicago, the Federal Deposit Insurance Corporation, the European Central Bank, Purdue University, and the OFR in the U.S. Department of Treasury. We also appreciate the feedback from participants in Moody’s Credit Risk Research Conference and Atlanta Conference on the Future of Large Financial Institutions.
Contents
1 Introduction 3
2 Bank Liability Structure 6
2.1 Assets and Liabilities . . . 7
2.2 Bank Run, FDIC, and Charter Authority . . . 10
3 Valuation and Optimization 13 3.1 Bank Valuation and Endogenous Insurance Premium . . . 13
3.2 Optimal Liability Structure . . . 16
4 A Quantitative Illustration 22 4.1 A Practical Range of Exogenous Parameters . . . 22
4.2 An Example of Endogenous Liability Structure . . . 25
5 Comparative Statics 28 5.1 Effects of Bank Business Characteristics . . . 29
5.2 Effects of Closure Rule and Insurance Subsidy . . . 34
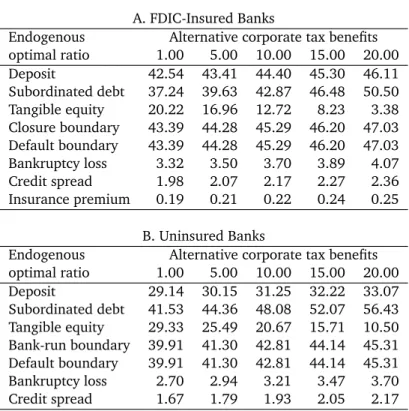
5.3 Effects of Corporate Tax Benefits . . . 37
6 Conclusion 39 A Appendix 42 A.1 Proof of Theorem 1 . . . 44
A.2 Proof of Theorem 2 . . . 45
A.3 Proof of Theorem 3 . . . 45
A.4 Proof of Theorem 4 . . . 46
1 Introduction
Bank leverage has drawn much attention from regulators and the public after the crises experienced by banking industry. Regulators around the world have gradually rolled out regulations on bank capital structure, and the shape of bank regulation is still
evolving.1 Banks have been readjusting their capital structure, and academics have
been grappling with the questions about the level and composition of capital that banks should hold.2 Proposals of further regulation are abundant in the literature. There have been arguments for restricting bank leverage to a level similar to non-financial firms.3 There are also antithetical views on whether banks should hold subordinated debt.4 Some have even proposed cutting the tax rate for banks because it reduces incentives for leverage.5
The debate on bank capital regulation calls for a better understanding of bank lever-age and the consequence of regulation. Each regulatory mandate typically attempts to fix a particular broken factor observed in bank liability structure.6 Arguments for a regulatory mandate on the broken factor often implicitly assume that other factors will remain unchanged, ignoring the overall response of banks that optimally adjust various parts of their liability structure. For instance, deposit insurance intends to address bank runs caused by the fear of losing depositsen masse. With deposit insurance, however, a bank may find that financing with more deposits increases its value despite being more exposed to the risk of failure. More broadly, it is unclear whether banks’ optimal re-sponse will undo or significantly diminish the intended effects of a regulatory mandate. It is even possible that a regulation may result in unintended consequences.
To work out banks’ optimal responses to regulation, one needs to understand how a bank chooses leverage and liability structure when it maximizes its value. Value maximization is a fiduciary responsibility of bank management: acting in the interest 1After the frequent bank runs during the Great Depression, the Banking Act of 1933 created the Federal Deposit Insurance Corporation (FDIC). After the financial crisis during the Great Recession, the Dodd-Frank Act of 2010 brought sweeping regulatory reforms ranging from FDIC deposit insurance to stress tests of banks’ capital adequacy. Worldwide regulators agreed on Basel III in 2011 to strengthen restrictions on bank leverage.
2See Thakor (2014) for a review of the debate on bank capital. 3See the book by Admati and Hellwig (2013).
4Bulow and Klemperer (2013) argue that banks should hold no subordinated debt, besides equity and securities convertible to equity. The Fed governor, Daniel Tarullo (2013), goes in the opposite direction by arguing for requirement of holding more subordinated debt, which he thinks will improve capital structure and resolution of banks.
5For example, Fleischer (2013) proposes cutting corporate tax rate for banks to make them safer. 6For this reason, Santos (2000) motivates regulation as a policy arising out of market failure.
of its claim-holders.7 Banks do not maximize social welfare, such as reducing systemic risk or increasing banking services. An analysis of social welfare implications of bank leverage is unquestionably important, but understanding the optimal choice of liability structure by value-maximizing banks is necessary for a proper social welfare analysis of bank regulation.
Banks distinguish themselves from other firms by taking deposits. Deposits are different from other forms of debt partly because banks earn income from the provision of account and liquidity services to depositors.8 Other important features of deposits are that depositors can run, deposits may be insured, and deposit-taking banks are subject to regulatory closure by charter authorities. Bank run by rational depositors and bank closure by rule-following regulators are reflected in equity holders’ endogenous choice of default on its debt obligations in order to maximize equity value. The risk exposure of deposits is also reflected in the insurance premium if the deposits are insured. We develop a dynamic structural model that incorporates these institutional features explicitly.
In our model, which extends the framework pioneered by Merton (1974, 1977) and Leland (1994), we analytically solve for the optimal liability structure for banks that is-sue both deposits and subordinated debt. The solution offers some new perspectives on bank liability structure. We find it optimal for a value-maximizing bank to choose de-posits and subordinated debt so that endogenous default coincides exactly either with regulatory bank closure if the bank is FDIC-insured or with bank run if it is uninsured and unregulated. With this optimal choice of liability structure, the distance to default is the same as the distance to regulatory closure or bank run. This optimal structure of liabilities precludes the subordinated debt from protecting deposits and results in a leverage higher than the optimal level for a firm not serving deposits.
The above property of optimal subordinated debt has an intuitive economic rea-son. Because of income from account and liquidity services, deposits are cheaper than subordinated debt as financing sources. A bank should generally prefer deposits to subordinated debt when balancing the benefits of debt against the potential loss to bankruptcy. Given deposits, however, subordinated debt does not affect bankruptcy 7The focus on bank value maximization sets aside the principal-agent problem such as management’s conflict of interests with other stake holders. This problem may play a role in bank choices of liabil-ity structure. For example, Admati, DeMarzo, Hellwig, and Pfleiderer (2013) discuss how conflict of interests leads bank management to use excessive leverage even if it destroys bank value.
8In the literature, account and liquidity services to depositors are also referred to as production of liquidity. The income from these services is sometimes referred to as the liquidity premium of deposits. We refer to it as account service income.
risk as long as regulatory closure or bank run happens before default. The bank should therefore take as much subordinated debt as possible for availing of the tax benefits but avoid making default happen before regulatory closure or bank run. As a result, the optimal subordinated debt sets endogenous default and regulatory closure concurrent in a FDIC-insured bank and makes endogenous default and bank run coincide in an uninsured, unregulated bank.
Another new perspective offered by our model is the optimal response of banks to FDIC insurance. With deposit insurance, a bank takes more deposits and issues less subordinated debt than what it would have done without deposit insurance. The optimal mix of deposits and subordinated debt ensures that the endogenous default remain coincident with the regulatory closure and avoid protecting the insurer from losses in its insurance obligation. Although the bank holds less subordinated debt, the increase in deposits leads to higher overall leverage than what would have been optimal for a comparable uninsured bank. This optimal response from banks prevents insurance program from reducing the expected loss due to bankruptcy. We find that the introduction of FDIC insurance raises optimal leverage even when banks are charged a fair insurance premium.
The endogenous link of FDIC’s insurance premium to leverage is also a new per-spective in our model. On one hand, insurance premium depends on the leverage and liability structure. On the other hand, a bank’s decision on leverage and liability struc-ture depends on the premium. We explicitly model this feedback channel, which is crucial in assessing regulatory policies pertaining to bank capital structure.
Our analysis raises an issue on the regulatory treatment of subordinated debt. Since subordinated debt is a claim ranked lower than deposits, it is naturally viewed as a source of capital that protects deposits. Reflecting this view, regulators treat subordi-nated debt as Tier 2 regulatory capital. However, if a bank adjusts its liability structure so that optimal default coincides with bank run or regulatory closure, it may remove the benefits of deposit protection. A large body of academic literature debates whether subordinated debt provides a market discipline on bankruptcy risk.9 The optimal choice of subordinated debt in bank liability structure is especially relevant to this debate and should not be ignored.
Since banks use much higher leverage than non-financial firms do, corporate tax benefits of debt is particularly important for bank liability structure. Apart from show-9Flannery and Serescu (1996) contend that subordinated debt pricing rationally reflects the risk in a bank. Gorton and Santomero (1990), however, opine the opposite.
ing that bank leverage is lower in an economy with lower corporate tax benefits, our model shows that it is optimal for banks to shrink more subordinated debt than deposits if the tax rate is lowered. More importantly, the model shows that banks should remain substantially leveraged even when corporate tax benefits approach zero. While a full general equilibrium analysis is needed for a thorough welfare analysis, the optimal re-sponse of bank liability structure developed here perhaps lays a stepping stone for the evaluation of the benefits and costs of tax policy reforms in the context of banking.
The road-map for the rest of the paper is as follows. Section 2 develops the model of bank liability structure in alternative regulatory environments. Section 3 charac-terizes the bank optimal liability structure in each regulatory environment, along with risk-based FDIC premium in the presence of endogenous choice of liability structure. Section 4 illustrates quantitatively the liability structures of banks and compare them with firms that do not serve deposits. Section 5 sheds light on the effects of factors, such as account service income, asset risk, bankruptcy cost, regulatory closure policy, FDIC insurance subsidy, and corporate tax benefits, on bank liability structure. Section 6 relates our work to the literature and discusses potential applications and extensions.
2 Bank Liability Structure
Banks share some common characteristics with non-financial firms: both have access to cash flows generated by their assets and both finance their assets by issuing debt and equity. Banks, however, differ from non-financial firms in that they take deposits and provide liquidity services to their depositors through check writing, ATMs, and other transaction services such as wire transfers, bill payments, etc. The banking business of taking deposits and serving accounts is heavily regulated in most countries. In the U.S., a large part of deposit accounts is insured by the FDIC, which charges insurance premium and imposes additional regulations on banks. The model of FDIC deposit in-surance has gained popularity outside the U.S., and an increasing number of countries have started to offer deposit insurance.10 Deposits and the associated services, deposit insurance, and regulations on opening and closure of banks distinguish banking busi-ness from other non-financial corporate busibusi-ness and set the capital decision of banks apart from that of other firms.
10The International Association of Deposit Insurers (IADI) was formed on May 6, 2002 to enhance the effectiveness of deposit insurance systems by promoting guidance and international cooperation. As of the end of 2014, IADI represents 79 deposit insurers from 76 countries and areas.
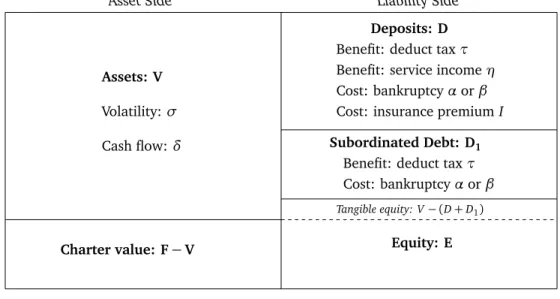
Firms operate in a market with two frictions: corporate taxes and bankruptcy costs. These frictions are crucial for firms in their choice of capital and liability structure, as recognized in the literature originating from Modigliani and Miller (1963) and Bax-ter (1967) and analyzed with structural models by Leland (1994). Banks face these frictions too, but they have to simultaneously incorporate other considerations, such as the potential of a run by depositors, FDIC deposit insurance premium, and charter authority’s closure of banks, in determining their optimal capital and liability structure. Figure 1 illustrates the liability structure of a typical bank. In Section 2.1, we discuss each part of the structure in detail.
Asset Side Liability Side
Assets: V
Volatility: Cash flow:
Deposits: D
Benefit: deduct tax⌧
Benefit: service income⌘
Cost: bankruptcy↵or
Cost: insurance premiumI
Subordinated Debt: D1
Benefit: deduct tax⌧
Cost: bankruptcy↵or
Tangible equity: V (D+D1) Equity: E
Bank value: F=D+D1+E Charter value: F V
Figure 1: An Illustration of Bank Liability Structure
2.1 Assets and Liabilities
A typical bank owns a portfolio of risky assets that generate cash flows. The portfolio of assets is valued at V, which is the major part of Figure 1. The asset is risky, and its value follows a stochastic process.11 The instantaneous cash flow of the asset is
V, where is the rate of cash flow. In a non-financial firm, V is the total earnings,
but in a bank, V represents only the earnings from bank assets such as loans, not
including the income from serving deposit accounts. The risk of the asset portfolio 11Following Merton (1974) and Leland (1994), we assume that the stochastic process is a geometric Brownian motion, which is described by equation (20) in Appendix.
is represented by the volatility of asset value and denoted by . Notice that is also the volatility of asset cash flow. We assume that the portfolio of assets is given
exogenously.12 Following Merton (1974) and Leland (1994), we assume that investors
have full information about asset value.13
Banks take deposits from households or businesses and provide account and liquid-ity services to depositors. Deposits, the first part on the liabilliquid-ity side in Figure 1, are the most important source of funds for banks to finance their assets. Let D denote the amount of deposits that a bank takes. Deposits are rendered safe through two chan-nels: (1) depositors withdraw their money early enough to ensure that the bank has enough assets to redeem their deposits in full; (2) the bank purchases insurance that guarantees the depositors in full. The first channel may precipitate financial distress costs and potential financial insolvency associated with a bank run. The second chan-nel requires the bank to pay insurance premium. We will discuss bank run and deposit insurance in the next subsection.
If deposits are risk-free, the fair interest rate on deposits is the risk-free rate, de-noted by r. Banks typically pay a lower interest rate on deposits. Depositors accept a lower interest rate, sayr ⌘1 for⌘1>0, because customers receive some liquidity
ser-vices associated with maintaining accounts and transacting certain normal payments.14 Banks also charge fees for services such as money transfers, overdrafts, etc. Let⌘2 be the banks’ fee incomes on each dollar of deposits. A bank’s net liability on deposits is
C = (r ⌘1)D ⌘2D, excluding deposit insurance premium. Let⌘=⌘1+⌘2, which is the net income on each dollar of deposits. The net deposit liability isC = (r ⌘)D, ex-cluding deposit insurance premium. The parameter⌘plays a crucial role in our model 12This assumption rules out interesting issues of endogenous asset substitution. The literature has pointed out that debt may create incentives to substitute assets with higher risk (e.g., Green, 1984, and Harris and Raviv, 1991) and FDIC insurance may also make for such incentive (e.g., Pennacchi, 2006, and Schneidar and Tornell, 2004). Clearly, modeling the endogenous asset choice along with the liability choice is an important direction for future research. However, our study may be viewed as an analysis of the optimal liability structure of the bank, which has already optimally chosen its asset portfolio.
13In reality, active investors use all available information to assess bank asset value and cash-flows although only accounting values of assets are directly observable in quarterly frequency. The full-information assumption sets aside the disparity between accounting value and intrinsic value. We may therefore interpretV as the fair accounting value. If the assets are of same risk category, we may inter-pretV as the value of risk-weighted assets.
14The Banking Act of 1933, known as the Glass-Steagall Act, prohibited banks from paying interest on demand deposits and gave the Fed the authority to impose ceilings on interest rates paid on time deposits. The prohibition and ceiling of interest rate on deposits were removed after the Depository Institutions Deregulation and Monetary Control Act of 1980 and the Depository Institutions Act of 1983, the latter of which is known as the Garn-St. Germain Act.
of banks. It represents a sacrifice to the required rate of return that the households are willing to accept for the services provided by the bank. This sacrifice distinguishes deposits from other form of debt. If deposits are risk-free because of deposit insurance, the bank’s total liability on deposits is I + C, where I is the insurance premium. If deposits are not insured but are risk-free because of depositors’ ability to run, we have
I =0.
Another important form of debt issued by banks is subordinated debt, the second part on the liability side in Figure 1. Subordinated debt pays coupon until bankruptcy, at which it has a lower priority than deposits in claiming the liquidation value of bank assets. The lower priority potentially protects deposits at bankruptcy. For that reason, long-term subordinated debt is treated as Tier 2 capital in bank capital regulation. Subordinated debt comes with a cost: its yield contains a credit spread, denoted bys, over the risk-free rate to compensate debt holders for bearing the risk of bankruptcy. The credit spread arises endogenously in our model; it depends on the risk of assets and the leverage of the bank. Thus, a bank’s choice of liability structure affects the credit spread which we will solve endogenously along with the value of subordinated debt. The liability on subordinated debt isC1= (r+s)D1, where D1 is the value of the debt at issuance (face value).
A typical bank is owned by its common equity holders, who garner all the residual value and earnings of the bank after paying the contractual obligations on deposits and subordinated debt. The first slice of value that equity owners lay claim to is the difference between assets and debt: V (D+D1), also on the liability side in Figure 1. This slice, referred to as tangible equity or book-value of equity, is the value equity holders would receive if bank assets are liquidated at fair value and all debt is paid off at par. A larger book-value of equity means a smaller loss for depositors and subordinated debt holders after liquidation. Hence, regulators regard it as bank capital of the highest quality, the core Tier 1 capital.
Equity holders are also rewarded by all future earnings of the bank. The present value of future earnings is the bank’s charter value, the bottom part on asset side in Figure 1. Part of the earnings is the savings from corporate tax. Since the expenses on debt financing are deductible from earnings for tax purposes, the flow of tax saving is ⌧(I+C +C1). The dividend paid to equity holders is the difference between the asset cash flow and the after-tax liability associated with deposits and subordinated debt:
V (1 ⌧)(I +C +C1). Since equity value depends on its dividend, it is affected by the liability structure. In a bank with deposit insurance, the liability structure is
characterized by the triplet(I,C,C1). In an uninsured bank that faces a bank run, the pair(C,C1)typifies the liability structure.
2.2 Bank Run, FDIC, and Charter Authority
A consequence of borrowing through deposits is the risk that depositors may run, a major challenge commonly faced by banks but not by non-financial firms. As experi-enced in the crises of the U.S. banking history and theorized by Diamond and Dybvig (1983), depositors may run from a bank if they believe it has difficulty in repaying their deposits promptly upon their demand. When depositors run, the bank will be closed, unless it is recapitalized to stop the run, and its assets will be liquidated. Suppose that the liquidation occurs through bankruptcy courts. Then the costs of liquidation will include dead-weight losses due to liquidation discount and legal expenses. This is a fraction↵of the asset value Va at bankruptcy. The value after bankruptcy is(1 ↵)Va.
Deposits carry with them the risk of a bank run. With full information, it is rational for depositors to run before the bank value drops below D/(1 ↵). It is also reasonable to assume that depositors may actually wish to run earlier than D/(1 ↵), worrying about a delay of payments when the bank files for bankruptcy. In our model, depositors run, and the bank is closed, when asset value drops to a levelVa withVa D/(1 ↵). Letting 1/(1 ↵), the threshold for bank to close due to bank run is Va=D.
The establishment of the FDIC is to deter bank runs by insuring that deposits (up to a limit) be paid when a bank closes.15 With FDIC insurance, a bank is closed by its charter authority, which is typically either the bank’s state banking commission or the Office of the Comptroller of the Currency (OCC). The charter authority closes a bank if the bank is insolvent or if the bank’s capital is deemed to be too low to be sustainable. For example, a bank is categorized by regulators as critically under-capitalized when the total capital that protects deposits drops to a threshold (say, 2% of asset value).16 The total capital is the sum of Tier 1 and Tier 2 capital. In our model, it is the sum of tangible equity and subordinated debt and amounts to[V (D+D1)] +D1 =V D. Let Va be the threshold when the charter authority closes the bank. Then, Va
D = 2%Va implies Va = D/0.98. In general, charter authority closes a bank when
its asset value reaches Va = D, where 1. The closure rule in our model may
15To deter bank runs during the credit crisis of 2007–2009, the FDIC deposit insurance limit was raised from $100, 000 to $250, 000 on October 3, 2008.
16For a review of the rules for the list of critically under-capitalized banks, we refer readers to Shibut, Critchfield and Bohn (2003).
also be intuitively interpreted as capital requirement, the minimum capital for a bank to operate, as modeled in Rochet (2008). Under such a capital requirement, charter authorities will shut down the bank, when the capital falls below the capital standards. If the requirement of total capital is 10%, then=1/0.90.
The FDIC functions both as a receiver of the closed banks and an insurer of the deposits. As a receiver, the FDIC liquidates the assets of a closed bank in its best effort to pay back the bank’s creditors. Suppose the liquidation cost is Va, proportional to
the asset value Va when the bank is closed. We allow 6= ↵ because the costs
asso-ciated with the liquidation by the FDIC may be different from the costs of liquidation through bankruptcy court. Since the FDIC does not go through the lengthy procedure of bankruptcy, <↵may potentially be true.17
As an insurer, the FDIC paysDto depositors when the bank is closed. The insurance corporation losesD (1 )Vaif(1 )Va<Dand nothing otherwise. The loss function
is[D (1 )Va]+, where[x]+= x if x 0 and[x]+=0 if x <0. Since Va=D, the
loss function is positive if<1/(1 ), in which case the FDIC expects to suffer a loss after bank closure.18 To cover the loss, the FDIC charges insurance premium on banks. In 2006, Congress passed reforms that permits the FDIC to charge risk-based premium. For deposit insurance assessment purposes, an insured depository institution is placed into one of four risk categories each quarter, depending primarily on the institution’s capital level and supervisory evaluation. Hence, a riskier bank pays higher insurance
premium than a safer bank does. Recall that I denotes the deposit insurance premium
a bank pays.19
The economic role of FDIC and charter authority in our model can be explained as follows. Depositors run at the right time to make their deposits risk-free if deposits are not insured. Deposit insurance prevents a bank run and lets the charter authority to 17Title II of the Dodd-Frank Act is perhaps a reflection of the belief that the cost of FDIC liquidation is lower than the cost of bankruptcy procedures. Title II authorizes the FDIC to receive and liquidate failed large financial institutions in order to avoid lengthy and costly bankruptcy procedures, which are supposed to be harmful for the stability of financial system.
18In practice, the FDIC always expects a chance of loss because liquidation cost is uncertain. To keep analysis tractable, we assume a fixed and<1/(1 )so that the FDIC expects a loss.
19Until 2010, the FDIC assesses the insurance premium based on total deposits. The assessment rate of the insurance is asuch that I = aD. There have long been concerns that banks shift deposits out of account temporally at quarter-ends to lower the assessment base. Since April 2011, the FDIC has changed the assessment base to the difference between the risk-weighted assets and tangible equity, as required by the Dodd-Frank Act (Section 331). If V equals the value of risk-weighted assets, the new assessment base equalsD+D1, which implies the new assessment rate isbsuch thatI =b(D+D1). The actual premium calculations may also depend on credit rating and the proportion of long-term debt to deposits. See Federal Deposit Insurance Corporation (2011) for more details.
close a bank later than the time depositors would have chosen to run were there no deposit insurance. The prevention of a bank run increases the expected life of the bank. The bank pays insurance premium to FDIC in “good states” when it is solvent. Keeping a fixed liability structure, the transfer of payments across the states improve the overall value of the bank by receiving more service income, increasing the tax shields, and reducing the expected cost of default. Section 4.2 will show that the combined actions of the charter authority and the FDIC create additional value for banks, although the expected dead-weight loss associated with bankruptcy increases after banks adjust their liability structures optimally.
Equity holders can choose to default before a bank run or a regulatory closure. Absent a bank run and regulatory closure, there is an optimal point for equity holders to default. The default decision maximizes equity value, given a liability structure. The optimal default of debt is referred to asendogenous defaultand derived by Leland (1994) for firms with long-term debt but without deposits. Section 3.1 provides the
formula of endogenous default in the presence of deposits. Let Vd be the point of
endogenous default, i.e., equity holders choose to default if and only if asset value V
reaches or drops below Vd, in the absence of a bank run or regulatory closure. Then
bankruptcy happens if either the debt is defaulted by equity holders endogenously or the bank is closed due to bank run or by charter authority. In other words, the point of bankruptcy isVb=max{Vd,Va}.
In summary, banks face three types of bankruptcy. The first type is endogenous default chosen by equity holders. In this type of bankruptcy, liquidation of assets has to go through private-sector bankruptcy procedure, and the cost associated with the procedure is↵Vd. The second type is a bank run, and bankruptcy cost is↵Va, as it also
goes through bankruptcy procedure. The last type is bank closure by charter authority. The cost of closing a bank is Va as the FDIC liquidates the assets. In order to keep the formulation simple, we denote the recovery value of assets after bankruptcy by
(1 )Va, where equals↵ or , depending on the type of bankruptcy. When bank
assets are liquidated after bankruptcy, depositors are paid first, and the subordinated debt holders are paid the next if there is value left. Consequently, the payoff to debt holders is⇥(1 )Vb D⇤+.
3 Valuation and Optimization
Table 1 summarizes the exogenous parameters in the model and the assumptions on them. In the table, service income is positive but with a rate smaller than the risk-free rate: 0 < ⌘ < r. Corporate tax is present: 0 < ⌧ < 1. The bankruptcy and FDIC
liquidation are both costly: 0 < ↵ < 1 and 0 < < 1. These assumptions are not
only realistic but also the requisite mathematical conditions to carry out valuation and optimization.
Parameter Notation Allowed range Asset volatility (0,1)
Asset cash flow [0,1)
Asset value V (0,1)
Riskless interest rate r (0,1)
Bank service income ⌘ (0,r)
Corporate tax benefit ⌧ (0, 1)
Court bankruptcy cost ↵ (0, 1)
FDIC liquidation cost (0, 1) Regulatory closure [1,1)
Insurance subsidy 1 ! [0, 1]
Table 1: Exogenous parameters are pre-specified, not determined by either valuation or optimization in the model. The allowed ranges are assumptions of the model.
3.1 Bank Valuation and Endogenous Insurance Premium
Since deposits are either withdrawn with full value or insured by FDIC, the value of deposits is its par value D. Because the net liability on deposits is C = (r ⌘)D, the value of deposits is related to its liability by D=C/(r ⌘).
The values of subordinated debt and equity are affected by the risk of bankruptcy. The Arrow-Debreu state price of bankruptcy plays a key role in bank valuation. Con-sider a security that pays $1 when bankruptcy occurs, and pays nothing otherwise. The price of this security is the state price of bankruptcy. The state price is Pb = [Vb/V] , where is the positive root of a quadratic equation, which is given by (22) in Appendix.
The quadratic equation implies that is increasing withr and decreasing with and
. If the cash flow of assets is zero, =0, we have =2r/ 2, which is proportional to
r and inversely proportional to 2. The state price P
b is a solution to Merton’s (1974)
pricing restriction, which is equation (21) in Appendix.
bankruptcy boundary and its state price. The following theorem, derived in Appendix A.1, summarizes the relation between bank value and liability structure.
Theorem 1 Given a liability structure(I,C,C1), the boundary of bank run or regulatory
closure and the boundary of endogenous default are, respectively,
Va =C/(r ⌘) (1)
Vd = (1 ⌧)[ /(1+ )](I+C+C1)/r. (2)
The bankruptcy boundary is Vb =max{Va,Vd}. The equity, subordinated debt, and bank
values are, respectively,
D1= (1 Pb)C1/r+Pb⇥(1 )Vb D⇤+ (3)
E=V (1 ⌧)(1 Pb)(I+C +C1)/r PbVb (4)
F=V Pbmin{ Vb,Vb D}
+ (1 Pb)⇥C⌘/(r ⌘) +⌧(I+C +C1) I⇤/r. (5)
In equation (3), subordinated debt value is the sum of expected coupon value before bankruptcy and expected recovery value at bankruptcy. In equation (4), equity value is the residual asset value after subtracting the expected after-tax liabilities on insurance, deposits, and subordinated debt and the expected value of bankruptcy loss. In equation (5), which is for bank value, the first term is asset value, the second term reflects the value of expected loss from bankruptcy, and the last term shows the value of expected service income and tax benefit after paying insurance premium.
Theorem 1 shows the role of service income and deposit insurance in bank valua-tion. Along with tax savings on debt, account service income (⌘) increases bank value as shown by the last term on the right-hand side of equation (5). The ability of a bank to attract deposits at a rate lower than the risk-free rate comes at a price: the bank has to close and incur bankruptcy cost if depositors run or if the charter authority closes the bank. For a bank with deposit insurance, insurance premium reduces bank value, which is evidenced by the last term of the equation. Although the liability structure in the theorem includes insurance premium, these formulas in the theorem apply to banks without deposit insurance if we setI =0.
We obtain the endogenous credit spread of subordinated debt from Theorem 1. The endogenous credit spread is s= C1/D1 r, where D1 is a function ofC1 as given in equation (3). The credit spread takes the probability of bankruptcy into account through state price Pb; at the same time, the state price is affected by the liability
in equation (3) explicitly. The premium affects the endogenous default boundary in equation (2), which in turn affects bankruptcy boundaryVband its state price. The last two affect the credit spread directly.
A comparison of the model of banks with the model of firms in Leland (1994) shows the connection and distinction between banks and non-financial firms. If we set
C =I =0 but C1>0, the formulas in Theorem 1 reduce to those in Leland (1994) for
a firm with an unprotected debt—the word “subordinated” drops when there are no deposits. If we set I =⌘=C1=0 butC >0, the formulas in Theorem 1 coincide with Leland’s for firms with a debt protected at levelD. Leland’s seminal capital structure theory is about non-financial firms, which is not applicable to banks that take deposits, earn service income, may pay deposit insurance premium, and face the risk of bank run or regulatory closure. Our model extends Leland’s to banks and offers a consistent framework for understanding the similarities and differences between banks and other firms.
While the deposit insurance premium is exogenously given in Theorem 1, it should endogenously depend on the amount of deposits under insurance and the risk involved. In principle, the insurance corporation should charge each bank a fair insurance pre-mium. A fair premium makes the insurance contract worth zero to each party of the contract. The next theorem, derived in Appendix A.2, characterizes the fair insurance premium.
Theorem 2 Given D dollars of deposits, the fair insurance premium is
I =r[1 (1 )]+DPa/(1 Pa), (6)
where Pa= [D/V] is the state price of bank closure.
An alternative way to write the insurance pricing equation is
(1 Pa)(I /r) =Pa[1 (1 )]+D, (7)
which says that the expected present value of insurance premium paid to the insurance corporation equals the expected present value of the insurance obligations at bank closure. If<1/(1 ), the fair premiumI is positive. It converges to zero asrises to 1/(1 ). If 1/(1 ), the fair premium is zero because the bank will be closed with enough asset value to cover the deposits in full.
The fair insurance premium I increases with D. If deposits increase, not only the insurance premium increases, the assessment rate of insurance premium, which is the premium on each dollar of deposits, also increases. By Theorem 2, the assessment rate
is
h⌘I /D=r[1 (1 )]+Pa/(1 Pa). (8)
The rate is increasing with Dbecause Pa is bigger for a largerD. The positive relation
betweenhand Dmakes sense because an expansion of deposits exposes the insurance
corporation to a bigger risk.
Some academics have argued that the FDIC does not charge enough insurance pre-mium to cover its risk exposure.20 A premium lower than the fair rate provides subsi-dized insurance to banks. To allow for subsisubsi-dized insurance premium, we assume that
the FDIC insurance premium is I =!I , where != 1 represents a fair premium and
!< 1 represents a subsidized premium. Relating to the net cash outflow on deposits
byD=C/(r ⌘), we haveI =iC, where
i=![1 (1 )]+[r/(r ⌘)]Pa/(1 Pa). (9)
If the FDIC subsidizes deposit insurance, it increases the bank value because the bank pays lower insurance premium for enjoying the risk-free value of deposits. Even with the subsidy, the assessment rate and the total premium a bank pays still endogenously depends on the amount of deposits and the bank’s risk profile.
With endogenous insurance premium, a liability structure is characterized by the pair(C,C1)because C determines I. Imposing I = iC in the bank value formula (5), we obtain
F =V + (1 Pb)[⌘/(r ⌘)+⌧ (1 ⌧)i]C/r + (1 Pb)⌧C1/r
Pbmin{ Vb,Vb D}. (10)
On the right-hand side of equation (10), the second term is the value of tax deduction and account service income, netted off against the insurance premium. The third term is the value of tax benefits to the bank for its interest expense on subordinated debt. The last term is the expected value of bankruptcy loss, for which bankruptcy cost takes the value of↵or , depending on the type of bankruptcy.
3.2 Optimal Liability Structure
Now we proceed to examine how a value-maximizing bank chooses its liability struc-ture. We first consider an uninsured bank, which is neither under FDIC deposit insur-20See Duffie, Jarrow, Purnanandam, and Yang (2003). On the other hand, one may argue that a lower premium is necessary to compensate the insured banks for the costs of reporting requirements and tight regulation.
ance nor subject to regulatory closure. The bank takes into account the possibility that depositors may run in order to protect their deposits. The uninsured bank is important for understanding the inherent difference between banks and other firms because we want to know whether the properties of bank liability structure are driven by banking business per se or government regulation, or both.
The uninsured bank serves as a benchmark for evaluating the effects of regulatory mandates such as FDIC insurance and charter authority’s closure of troubled banks. The benchmark is useful for examining how a bank might arrange its liability struc-ture differently in alternative regulatory environments. The theory presented this sec-tion will allow us gain insights into the optimal response of banks to the FDIC. The optimally-responding banks adjust their leverage, liability structure, and default deci-sions, relative to the benchmark in which banks make their choices of liability structure unfettered by any government interventions.
As pointed out earlier, a liability structure of an uninsured bank is described by the pair(C,C1). An optimal liability structure is the deposit liability C⇤ and subordinated debt liability C⇤
1 that maximize bank value. The next theorem, derived in Appendix
A.3, provides a characterization of the optimal liability structure for an uninsured bank, which is not subject to regulatory closure.
Theorem 3 Suppose 0< ⌘ < r, 0< ⌧ < 1, and 1/(1 ↵). The optimal liability
structure of an uninsured bank is unique. In the optimal liability structure, V⇤
a =Vd⇤, and
the state price of bankruptcy is P⇤ b = 1 1+ · ⌘(1 ⌧) +r⌧(1+ ) ⌘(1 ⌧) +r⌧(1+ )+r(1 ⌧)↵ . (11)
The optimal deposit and subordinated-debt liabilities are
C⇤= (r ⌘)V P⇤ b 1/ / (12) C⇤ 1 =rV Pb⇤ 1/ ñ 1+ (1 ⌧) r ⌘ r ô . (13)
Equation (11) gives the exact formula of the optimal state price P⇤
b; it is an elementary
algebraic function of the following exogenous parameters: r, , ,⌧,⌘, and↵.
The theorem characterizes the optimal liability structure of a bank that faces corpo-rate tax, bears the risk of costly bankruptcy, and takes deposits to earn service income. Combining Theorem 3 with Theorem 1, we obtain analytical solutions, which we omit to save space, for deposit value D⇤, subordinated debt value D⇤
1, equity valueE⇤, bank value F⇤, bankruptcy boundaryV⇤
of the uninsured bank. The ratio of subordinated debt liability to deposit liability is a characterization of the liability structure and is thus referred to asliability ratio. By the theorem, the optimal liability ratio is x⇤=C⇤
1/C⇤=r(1+ )/[ (1 ⌧)(r ⌘)]. The theorem states that the optimal amount of subordinated debt makes the en-dogenous default boundary coincide with the bank-run boundary. Deposits attract a discount in the deposit rate as well as service fees, in addition to tax savings. The cost of taking deposits is the expected loss due to a bank run. In contrast, subordinated debt brings tax savings but produces no account services or fee income; its cost is the ex-pected loss due to bankruptcy. Therefore, at the margin, the bank should use deposits, not subordinated debt, to balance the benefits of debt with the loss to bankruptcy. With this balance, the bank should take as much subordinated debt as possible for availing the tax benefits but should avoid the expected bankruptcy cost resulting from endoge-nous default. To avoid the expected cost associated with endogeendoge-nous default, the bank should not set the endogenous default boundary above the bank-run boundary. As a result, the optimal subordinated debt should make default occur at exactly the same point at which bank run takes place.
The assumption of a rational bank run, 1/(1 ↵), is essential for Theorem 3. We have found thatV⇤
d >Va⇤may happen in the optimal liability structure if<1/(1 ↵).
In this situation, depositors run from the bank at a point when the bank does not have enough assets to refund the deposits. Such a late bank run is not rational for depositors. The services associated with deposits are important for Theorem 3. If ⌘=0 while ⌧ 2 (0, 1) and 1/(1 ↵), the optimal liability structure is not unique. If we
set ⌘ =0 in formulas (11)–(13), we obtain the optimal structure with the maximum
deposits, but every C with 0 C C⇤ leads to the same maximum bank value. The
optimal capital structure is not unique for a bank with ⌘ = 0 because deposits and
subordinated debt have the same tax benefits and bankruptcy costs in the absence of account service.21 However, setting ⌘
= 0 and C = 0 in Theorem 3 gives the unique
optimal liability structure for a firm that takes no deposits. This corresponds to the unique optimal capital structure of a firm as modeled by Leland (1994). Obviously, a firm holding no deposits and providing no account service is not a bank. Hence, a structural model without considering deposits and bank services is not appropriate for 21Without service income, deposits in our model bears resemblance to the secured debt in Leland’s (1994) because deposits are protected by bank run. Leland considers the optimal capital structure of firms that take either secured or unsecured debt but not the optimal mix of the two. He analytically solves for the optimal capital structure of firms that take unsecured debt, but for a firm that takes secured debt, he solves for the optimal structure numerically.
understanding banks’ optimal liability structure and leverage.
Corporate tax plays an important role in Theorem 3. If⌘2(0,r)and 1/(1 ↵) but⌧=0, the bank can maximize its value without issuing subordinated debt. In the absence of tax benefits, increasing subordinated debt from zero does not alter bank value, and thus the optimal level of subordinated debt is indeterminate. However, if a bank finances its operations only by taking deposits, then there is a unique optimal level of deposits when tax rate is zero, as stated in the theorem below.
Theorem 4 Suppose⌧=0,0<⌘< r, and 1/(1 ↵). The optimal liability structure
is unique for an uninsured bank that finances its operations by deposits and equity. In the optimal liability structure, the bank-run boundary is higher than the endogenous default
boundary: V⇤
a >Vd⇤. The state price of bankruptcy is
P⇤ a = 1 1+ · ⌘ ⌘+r( 1), (14)
and the optimal deposit liability is
C⇤= (r ⌘)V P⇤
a1/ /. (15)
The proof of this theorem is shown in Appendix A.4. This optimal liability structure in the absence of taxes is especially relevant to banks as the motive to issue deposits arises from liquidity provision, a feature that is unique to banks. Our result in Theorem 4 may help explain why banks in the 19th century used substantial leverage in the form of deposits when there were no tax advantages, as documented by Calomiris and Carlson (2015). Theorem 4 shows that leverage is desired by banks despite the absence of corporate taxes benefits.
Moreover, the inequality V⇤
a >Vd⇤ in Theorem 4 explains why equity holders never
chose to default before bank run as observed in history. A bank without subordinated debt provides account and liquidity services on deposits but receives no tax benefit. For this reason, tax benefit is typically ignored in the literature that focuses on bank account services. Models of banks without tax benefit and subordinated debt are nevertheless largely inconsistent with the typical bank capital structure in today’s world.
When there is no corporate tax, subordinated debt is however indeterministic in op-timal liability structure. The indeterminacy suggests that a model ignoring tax savings may not be appropriate for understanding modern bank liability structure that includes subordinated debt. The empirical relevance of taxes in bank capital structure has been recently examined by Schepens (2014) who exploited a recent change in the tax code
in Belgium, which permitted tax advantages to equity for the first time (thereby re-ducing the tax discrimination between bank debt and bank equity). He found that the tax changes led the banks to issue more equity and improved their capital ratios. This evidence shows that banks do respond to tax changes by altering their liability structure Theorem 3 ignores FDIC deposit insurance and regulatory closure, but it serves as a useful benchmark so that we can examine the effects of deposit insurance and bank regulation. For an FDIC insured bank, the optimal liability structure is a pair of C⇤
and C⇤
1 that maximizes the bank value in equation (10) subject to equation (9). The
value-maximizing bank in our framework is fully aware that any decision pertaining to leverage and liability structure has a consequence on the FDIC insurance premium. The bank should therefore be mindful of the channel in its choice of leverage and liabil-ity structure. The endogenous determination of FDIC premium and liabilliabil-ity structure captures the feedback channel from FDIC to the banks and vice versa.
The next theorem, derived in Appendix A.5, characterizes the conditions for a lia-bility structure to be optimal in a bank under FDIC insurance.
Theorem 5 Suppose0<⌘<r,0<⌧<1,1<<1/(1 ), and the FDIC insurance
premium is I =!I , where I is defined in Theorem 2. A liability structure with Vd < Va
is never optimal for an FDIC-insured bank. There exists⇤2[1, 1/(1 ))such that for
all 2 (⇤, 1/(1 )), the optimal structure is unique and satisfies Vd⇤ = Va⇤. In such
optimal structure, the state price of bankruptcy is P⇤ b = 1 1+ · ⌘(1 ⌧) +r⌧(1+ ) ⌘(1 ⌧) +r⌧(1+ ) +r(1 ⌧) { 1+![1 (1 )]+}. (16)
The optimal deposit and subordinated debt liabilities are
C⇤= (r ⌘)V P⇤ b1/ (17) C⇤ 1 = rV Pb⇤1/ ñ 1+ (1 ⌧) r ⌘ r ![1/ (1 )] + P ⇤ b 1 P⇤ b ô . (18)
Formula (16) shows that the optimal state priceP⇤
b is a function of the following
exoge-nous parameters: r, , ,⌧,⌘, ,, and!. Combining this theorem with Theorems 1
and 2, we obtain analytical solutions, which we omit to save space, for the deposits value D⇤, subordinated-debt value D⇤
1, equity value E⇤, bank value F⇤, bankruptcy boundaryV⇤
b, credit spread s⇤, and insurance premium I⇤ in the optimal capital
struc-ture of the FDIC insured bank.
Theorem 5 shows that it is optimal for banks to leverage so that the endogenous default of subordinated debt is as late as the closure of banks. FDIC insurance and
regulatory closure do not directly affect how a bank optimally chooses subordinated debt, but they indirectly affect the choice through closure boundary. The optimal sub-ordinated debt still maximizes tax benefit and avoids protecting deposits. In particular, Theorem 5 shows that zero subordinated debtC1=0 is not optimal for a bank as long as the insurance premium is not too high. The economic intuition is simple. When the insurance premium is not too high, it is optimal to use a positive level of deposits. By the optimal condition that the bank closure boundary must equal the default boundary, the bank should issue a positive amount of subordinated debt to meet the condition. It is also easy to reason analytically. IfC1=0, Theorem 1 gives
Va=C/(r ⌘), Vd = (1 ⌧)[ /(1+ )](1+i)C/r. (19)
If iis not too large, the above equations imply Va>Vd, indicating that the structure is
suboptimal by Theorem 5.
In theory, if asset volatility and liquidation cost are high enough, it is possible for a liability structure with Vd > Va to be optimal for some lowclose to 1. We have
confirmed this possibility by both mathematical derivations and numerical
optimiza-tion. If and are very high andis very low, the fair insurance premium rateimay
be very high, making deposits too expensive as source of funds compared to subordi-nated debt. When that happens, reducing deposits to have Va < Vd may be optimal.
Preventingifrom being too high is the reason forto be higher than a threshold⇤in the theorem. Nevertheless, for all the asset volatility and liquidation cost we consider in later sections, we find⇤=1. That is,Va⇤=Vd⇤and the formulas in Theorem 5 hold
for all2(1, 1/(1 )).
Theorem 5 incorporates the endogenous insurance premium in optimal liability structure. Besides considering the tradeoff between tax benefits, account service in-come, regulatory closure, and bankruptcy costs, banks take the cost of deposit
insur-ance into account. If we set 1/(1 ↵) and assume that ↵ , the insurance
premium becomes zero. Consequently, the formulas in this theorem reduce to those in Theorem 3. With a generaland a positive! in this theorem, the assessment rate !hof insurance premium is increasing with D, and thusi increases withC. Therefore, under the assumption of Theorem 5, banks consider both the increase in insurance
premium caused directly by the expansion of D as well as the increase caused
indi-rectly through the rise of assessment rate. In Section 5.2, we will show the impact of endogenous insurance premium on banks’ optimal choice of capital structure.
4 A Quantitative Illustration
The model just developed paves a way to characterize quantitatively the optimal bank liability structure. As discussed earlier, we consider two types of banks. The first type operates without deposit insurance and regulatory closure. Since deposits in these banks are not insured, they face the risk of a bank run. In practice, many non-U.S. banks face the risk of a bank run because their governments do not provide deposit
insurance.22 Some U.S. banks are also not covered by FDIC deposit insurance. In
theory, an uninsured bank serves as a counterfactual for the second type of banks, which are covered by FDIC insurance and subject to regulatory closure. The second type is the majority of banks in the U.S.
4.1 A Practical Range of Exogenous Parameters
While the theoretical range of the exogenous parameters are as wide as those listed in Table 1, the practical range of the parameters should be much narrower. In the numerical illustration and analysis of comparative statics, we choose a range that are practically conceivable and interesting.
As our model inherits the major advantage of structural models that coherently connects the risk of debt and equity to the risk of assets, the risk comes from asset volatility ( ), which is one of the most important parameters to affect the leverage and liability structure. Since asset volatility is not directly observable, investors infer asset volatility from accounting data and market prices. Moody’s KMV provides estimates of asset volatility for a large number of companies across a wide range of industries.
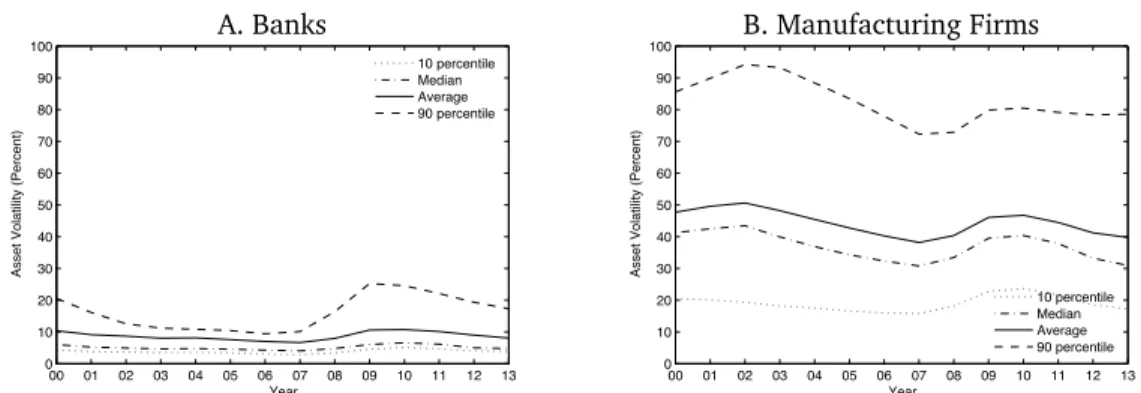
In Figure 2, we present the average, median, and the 10/90-percentiles of Moody’s estimates for banks in panel A. As a comparison, we present the estimates for manufac-turing firms in panel B. The figure shows a difference between the assets held by banks and those owned by manufacturing firms: bank assets have much lower volatility. The average asset volatility is around 10% for banks, whereas it is 40⇠50% for manufac-turing firms. Although bank asset volatility fluctuates over time, the median is around 5% for 2001–2012. The 90 percentile of bank asset volatilities is well below 15% for 22In September 2007, Northern Rock, a U.K. Bank, experienced a run on its deposits, and had to be nationalized in 2008. See Shin (2008) for a cogent analysis of the Northern Rock bank run. Bank runs have happened in Europe and Asia even after the recent financial crisis. In 2010, depositors “ran” from two Swedish banks, Swedbank and SEB, and a Chinese bank, Jiangsu Sheyang Rural Commercial Bank. In 2013, depositors ran from Cypriots banks and forced the country to close its banks for many days. In 2014, depositors ran from two Bulgarian banks, Corporate Commercial Bank and First Investment Bank.
2001–2007, and it stays below 25% even for the period of 2007–2012. In view of these stylized facts, we let 2[0.03 , 0.20] in our study of comparative statics.
A. Banks B. Manufacturing Firms
00 01 02 03 04 05 06 07 08 09 10 11 12 13 0 10 20 30 40 50 60 70 80 90 100 Year
Asset Volatility (Percent)
10 percentile Median Average 90 percentile 00 01 02 03 04 05 06 07 08 09 10 11 12 13 0 10 20 30 40 50 60 70 80 90 100 Year
Asset Volatility (Percent)
10 percentile Median Average 90 percentile
Figure 2: Plots of the average, median, and 10/90-percentiles of asset volatilities of banks (panel A) and manufacturing firms (panel B) from 2000 to 2013. Moody’s KMV Investor Service provided the estimates of asset volatilities.
Another parameter of bank assets is its rate of cash flow ( ). If the assets contain only commercial and consumer loans, the cash flow are interest and principal payments of the loans. In the numerical illustration and comparative statics, we set the cash-flow rate to 8%, which is the average mortgage rate in the U.S. during 1984–2013. Correspondingly, we also set the risk-free rate to the average Federal funds rate during the same period; this gives an estimate of 5%. We choose this period because we would like to make our numbers broadly comparable to the aggregate balance sheet data of FDIC-insured commercial banks and savings institutions. The balance sheet data for this period are provided by the FDIC, and both the mortgage rate and Federal funds rate data are obtained from Table H.15 from the Federal Reserve.
The income from deposit services is important in bank liability structure. The net income from deposit services should be determined in the competitive market of de-posits. In a perfect competitive market with free entry, the net income would be driven to zero, or it should just cover the insurance premium if a bank has deposit insurance. At least in the U.S., new entry of banks into the market is regulated by charter author-ities.23 Without free entry, deposit rents arise from the market power enjoyed by the bank (De Nicolo and Rurk Ariss, 2010). The profitability should depend on the amount
of deposits and the bank. Thus, parameter ⌘may differ across banks and should be a
function of D. We do not explicitly model the equilibrium of deposits or the demand 23Founders of a new bank have to show their integrity and ability to manage the bank. In addition, the regulators demand evidence of need for a new bank before granting a charter. Peltzman (1965) documents the restriction on entry of commercial banking. Jayaratne and Strahan (1998) examines the effects of entry restrictions on bank efficiency.
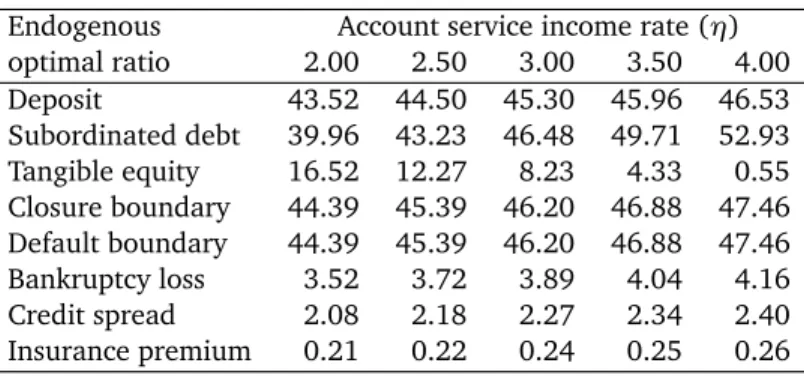
function of deposits, D(⌘), in order to keep the model tractable and to focus on the choice of liability. We instead assume ⌘ to be a constant but allow it to be different across banks. A range of values, ⌘ 2 [0.02 , 0.04], are examined in our analysis of comparative statics.
Since a benefit of leverage is the tax deductibility of interest expenses on debt, cor-porate tax rate is an important parameter in capital structure. The statutory corcor-porate tax rate in the U.S. ranges up to 35%. The U.S. Department of Treasury (2007) re-ports that the effective marginal tax rate on investment in business varies substantially by business sectors. The academic literature suggests that the effective corporate tax rate is around 10% for non-financial firms (Graham, 2000) but can be more important for banks (Heckemeyer and Mooij, 2013). In our analysis of comparative statics, we consider a wide range,⌧2[0.01 , 0.20].
Bankruptcy cost counters the benefit of debt, but the task of measuring it has al-ways been a challenge. A well-known reference is the study of Altman (1984), which examines a sample of 19 industrial firms which went bankrupt over the period of 1970– 1978. The estimated bankruptcy cost is 19.7% of the firm’s asset value just prior to its bankruptcy. Bris, Welch and Zhu (2006), however, show that bankruptcy cost varies across firms and ranges between 0% and 20% of firm assets. Banks experienced higher bankruptcy costs. Based on 791 FDIC-regulated commercial banks failed during 1982– 1988 (the Savings and Loan Crisis), James (1991) estimates that bankruptcy cost is 30% of a failed bank’s assets. Based on 325 insured depository institutions failed dur-ing 2008–2010 (the Great Recession), Flannary (2011) estimates that bankruptcy cost is about 27% of a failed bank’s assets. In light of these estimates, we choose 27% as the mid-point of the range in our analysis of the effects of↵and . The range we consider is[0.17 , 0.37].
The other exogenous parameters are as follows. For an unregulated bank, we as-sume bank run happens at the point when the bank has exactly enough assets to repay deposits after liquidation in bankruptcy procedures, i.e,=1/(1 ↵). For an FDIC in-sured bank, state banking regulatory agency closes it when it is unable to meet its obli-gations to depositors. The parameterfor bank closure should thus be at least 1. When a bank’s total capital is less than 2% of its assets, the FDIC classifies it as “critically un-dercapitalized,” and the charter authority typically closes the bank. Given these insti-tutional arrangements, we set the regulatory closure rule as=1/(1 0.02)⇡102%.
4.2 An Example of Endogenous Liability Structure
The optimal liability structure is characterized by a set of ratios endogenously deter-mined by bank management.24 The first endogenous variable of our interest is the ratio of deposits to assets, D/V. The next is the ratio of subordinated debt to assets, D1/V. The leverage of the bank is measured by the ratio of tangible equity to assets, which is referred to as Tier 1 ratio in bank regulation. Since the tangible equity isV D D1, the ratio of tangible equity to assets is(V D D1)/V. Higher leverage corresponds
to lower tangible equity.25 The amount of deposits determines the boundary of bank
run or regulatory closure, whereas the total leverage affects the boundary of endoge-nous default. The two boundaries relative to asset value, Va/V and Vd/V, determine
the distance to bankruptcy. The higher of the two is the bankruptcy boundary Vb/V, which influences the expected value of bankruptcy loss, Pb Vb/V, another endogenous variable of our interest. The possibility of bankruptcy causes the bank to pay a credit spread, s, on subordinated debt. The credit spread is observable in the market. For
banks with deposit insurance, the insurance premiumI is endogenously determined by
the liability structure. The charter value of the bank, which is the difference between bank value and asset value, is of our interest. We may calculate it as percent of asset value: (F V)/V.
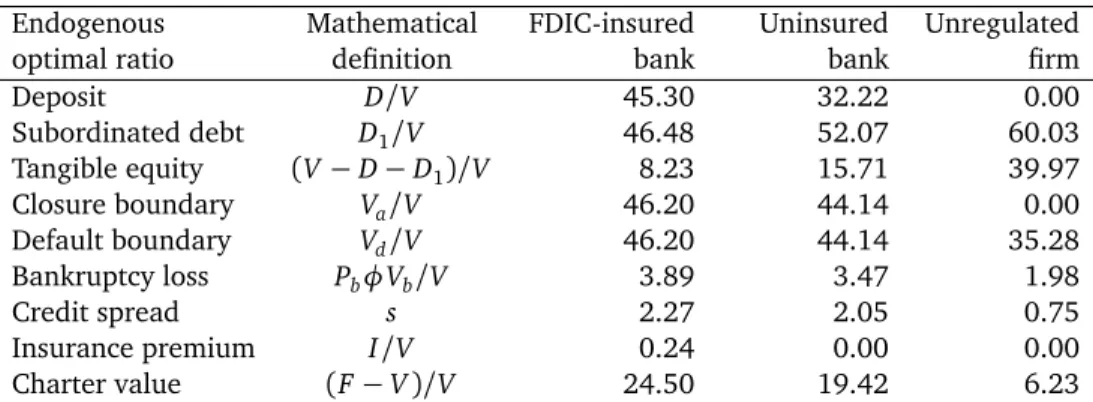
Table 2 presents optimal liability structure and related endogenous variables for both FDIC-insured and uninsured banks, as well as for a non-financial firm that does not take deposits. The parameters used for generating the optimal liability structure are chosen from the ranges discussed in Section 4.1. We later vary these parameters to examine the effect of each.
Table 2 reveals some distinctive characteristics of bank optimal liability structure. The most striking is the high level of leverage for FDIC-insured banks, which is typical in banks but not common in non-financial firms. In the FDIC-insured bank, the op-timal deposit level is 45.30% of asset value, and the opop-timal subordinated debt level is 46.48%. This liability structure leaves only 8.23% of tangible equity. Although this liability structure is only for illustrating our theory, it is broadly comparable to the av-erage liability structure of FDIC-insured banks. In Table 3, we present the statistics of 24Even though the levels of some debt, such as deposits, are partially determined by the supply in the markets, banks have control of the ratios because they can adjust the level of assets to achieve their desired capital structure.
25It is useful to point out that tangible equity of a bank can be negative in practice. In its December 2011 filing, last time as a bank holding company, the U.S. operations of Deutsche Bank had total assets of $355 billion and Tier 1 capital of negative $5.68 billion.
Endogenous Mathematical FDIC-insured Uninsured Unregulated optimal ratio definition bank bank firm
Deposit D/V 45.30 32.22 0.00 Subordinated debt D1/V 46.48 52.07 60.03 Tangible equity (V D D1)/V 8.23 15.71 39.97 Closure boundary Va/V 46.20 44.14 0.00 Default boundary Vd/V 46.20 44.14 35.28 Bankruptcy loss Pb Vb/V 3.89 3.47 1.98 Credit spread s 2.27 2.05 0.75 Insurance premium I/V 0.24 0.00 0.00 Charter value (F V)/V 24.50 19.42 6.23
Table 2: The optimal liability structures in FDIC-insured and uninsured banks and an unregulated firm that does not take deposits. All values are reported in percentage points. In the calculation of endoge-nous variables, we set =0.05,⌘=0.03, ⌧=0.15, !=0.9, and↵= =0.27. For FDIC-insured
banks,=1.02, but=1/(1 ↵)for uninsured banks.
Average Median StDev Maximum Minimum Demand/Savings Deposits 45% 44% 5% 59% 39%
Other Liabilities 47% 49% 6% 53% 30%
Total Liabilities 92% 92% 2% 95% 89%
Total Equity 8% 8% 2% 11% 5%
Table 3: Statistics of the aggregate liability structure of all FDIC-insured commercial banks and savings institutions from 1984 to 2013. Source: The Federal Deposit Insurance Corporation.
liability structure of all FDIC-insured commercial banks and savings institutions from 1984 to 2013.26
Consideration of uninsured banks helps answer an important question: are banks fundamentally different from non-financial firms regardless of FDIC insurance and reg-ulatory closure? This question is important for understanding the effects of deposit insurance and regulatory closure, which will be discussed in the next subsection. Table 2 shows that high level of leverage is also optimal for a bank even without deposit insurance. With the baseline values of exogenous parameters, the sum of deposits and subordinated debt amounts to about 84.29 percent of the asset value, leaving only 15.71 percent of tangible equity. This means the FDIC insurance is not the sole reason for high leverage of banks.
High leverage in uninsured banks is likely related to a fundamental factor that 26Since our model considers only two kinds of debts: the deposits that can run and earn ser-vice/liquidity premium and the debt that cannot run or earn service/liquidity premium, Table 3 dis-tinguishes only demand and savings deposits from the rest of the liabilities. The actual liability structure of banks are far more complex than the structure presented in the table. The complexity of full array of bank debt is beyond the scope of this paper.