ISTANBUL TECHNICAL UNIVERSITYFGRADUATE SCHOOL OF SCIENCE ENGINEERING AND TECHNOLOGY
CLASSIFICATION METHODS FOR MOTOR IMAGERY BASED BRAIN COMPUTER INTERFACES
Ph.D. THESIS Ayhan YÜKSEL
Department of Electronics and Communications Engineering Electronics Engineering Programme
ISTANBUL TECHNICAL UNIVERSITYFGRADUATE SCHOOL OF SCIENCE ENGINEERING AND TECHNOLOGY
CLASSIFICATION METHODS FOR MOTOR IMAGERY BASED BRAIN COMPUTER INTERFACES
Ph.D. THESIS Ayhan YÜKSEL
(504082201)
Department of Electronics and Communications Engineering Electronics Engineering Programme
Thesis Advisor: Prof. Dr. Tamer ÖLMEZ
˙ISTANBUL TEKN˙IK ÜN˙IVERS˙ITES˙IFFEN B˙IL˙IMLER˙I ENST˙ITÜSÜ
MOTOR HAREKET HAYAL˙I TABANLI BEY˙IN B˙ILG˙ISAYAR ARAYÜZLER˙I ˙IÇ˙IN
SINIFLANDIRMA METOTLARI
DOKTORA TEZ˙I Ayhan YÜKSEL
(504082201)
Elektronik ve Haberle¸sme Mühendisli˘gi Anabilim Dalı Elektronik Mühendisli˘gi Programı
Tez Danı¸smanı: Prof. Dr. Tamer ÖLMEZ
Ayhan YÜKSEL, a Ph.D. student of ITU Graduate School of Science Engineering and Technology 504082201 successfully defended the thesis entitled “CLASSIFICA-TION METHODS FOR MOTOR IMAGERY BASED BRAIN COMPUTER INTER-FACES”, which he prepared after fulfilling the requirements specified in the associated legislations, before the jury whose signatures are below.
Thesis Advisor : Prof. Dr. Tamer ÖLMEZ ... Istanbul Technical University
Jury Members : Prof. Dr. Tayfun GÜNEL ... ˙Istanbul Technical University
Prof. Dr. Nizamettin AYDIN ... Yıldız Technical University
Prof. Dr. Mustafa BA ˘GRIYANIK ... ˙Istanbul Technical University
Yrd. Doç. Dr. Gökhan B˙ILG˙IN ... Yıldız Technical University
Date of Submission : 26 May 2016 Date of Defense : 18 July 2016
FOREWORD
This thesis is the result of my three years of studying at Istanbul Technical University, Electrical and Electronics Enginnering Faculty, Medical Electronics Laboratory. The purpose of the research is to study brain computer interfacing and motor imagery classification.
I am deeply grateful to my PhD supervisor Prof. Dr. Tamer Ölmez for his supervision, advice and key scientific insights guiding me to the completion of this thesis. Whenever I lost track on how to proceed he ordered helpful advices. On the other hand, he encouraged me to expand my horizon. He also made numerous suggestions on how to improve this thesis and without his input many issues would not have been spotted. I was lucky to have Prof. Dr. Tamer Ölmez as my supervisor. Also i appreciate very valuable advices and supervision for my jury members, Prof. Dr. Ahmet Co¸skun Sönmez, who passed away suddenly, may his gentle soul rest in peace, Prof. Dr. Tayfun Günel and Prof. Dr. Nizamettin Aydın for their very valuable advices and supervision.
I want to thank to people who i met during my academic study and influenced me any way, Prof. Dr. Mehmet Korürek, may his gentle soul rest in peace, Prof. Dr. Zümray Dokur Ölmez and Dr. Kenan Tekinda˘g from AORT medical company.
I would like to thank the Scientific and Technological Research Council of Turkey (TÜB˙ITAK) Science Fellowships and Grant Programmes Department (B˙IDEB) for my scholarship.
I like to give my very special thanks from deep of my heart to my father, I wish he could be with us now; my mother, my sisters and, my dear wife, who has a great role for encouraging me to finish this thesis.
TABLE OF CONTENTS Page FOREWORD... ix TABLE OF CONTENTS... xi ABBREVIATIONS ... xv SYMBOLS ...xvii
LIST OF TABLES ... xix
LIST OF FIGURES ... xxi
SUMMARY ...xxiii
ÖZET ... xxv
1. INTRODUCTION ... 1
2. BRAIN COMPUTER INTERFACES... 5
2.1 Steady State Visual Evoked Potentials (SSVEP) ... 6
2.2 P300 Evoked Potentials ... 7
2.3 Slow Cortical Potentials (SCP)... 9
2.4 Cortical Neuronal Activation Potentials ... 10
2.5 Motor Imagery (MI) ... 10
2.5.1 Motor cortex ... 11
2.5.2 Imagination of motor movement ... 13
3. CLASSIFICATION OF MOTOR IMAGERY SIGNALS ... 17
3.1 Properties of Motor Imagery Signals ... 17
3.1.1 Low spatial resolution ... 17
3.1.2 Variations between subjects and sessions... 18
3.1.3 A few number of classes... 18
3.1.4 Non-stationary EEG ... 19
3.1.5 Inexperienced subjects... 19
3.2 A General Framework for Classification of Motor Imagery Signals ... 19
3.2.1 Motor imagery experiment design... 20
3.2.2 Motor imagery signal acquisition ... 21
3.2.3 EEG data preprocessing ... 24
3.2.3.1 Channel selection... 24
3.2.3.2 Frequency selection ... 25
3.2.3.3 Active segment selection ... 26
3.2.4 Spatial filtering for EEG data processing ... 27
3.2.5 Feature extraction methods... 32
3.2.6 Classification methods for EEG data... 33
3.3 Common Spatial Patterns (CSP) ... 34
3.3.1 A toy data example ... 39
3.3.3 Extending CSP for multiclass classification... 42
3.4 Regularized Common Spatial Patterns ... 44
3.4.1 Tikhonov regularized CSP (TRCSP)... 45
3.4.2 Weighted Tikhonov regularized CSP (WTRCSP)... 45
3.4.3 Invariant CSP... 46
3.4.4 Spatially regulaized CSP ... 46
3.4.5 Stationary CSP... 47
3.4.6 Task related & spatially regularized CSP (TR&SR-CSP)... 47
3.4.6.1 Multiclass TR&SR-CSP ... 48
3.5 Spatial Filter Network (SFN) ... 50
3.5.1 General structure of spatial filter network ... 50
3.5.2 Training of SFN... 53
3.5.2.1 Error function... 54
3.5.2.2 Backpropagation method ... 54
3.5.2.3 Levenberg–Marquardt method... 56
3.5.3 Running SFN with toy data ... 58
3.5.4 Convergence of network ... 60
3.5.5 Training time ... 60
3.6 Spatial - Spectral Filtering Methods... 61
3.6.1 Common spatio-spectral patterns (CSSP) ... 63
3.6.2 Common sparse spectral spatial patterns (CSSSP) ... 64
3.6.3 Filter bank common spatial patterns (FBCSP) ... 65
3.6.4 Spectrally weighted common spatial patterns (Spec-CSP ) ... 65
3.6.5 Discriminative filter bank common spatial patterns (DFBCSP ) ... 67
3.6.6 Filter bank common spatio-spectral patterns (FBCSSP )... 68
3.6.6.1 Filter bank selection... 70
3.6.6.2 Conclusion ... 72
4. COMPUTER SIMULATIONS ... 75
4.1 Data Description ... 75
4.1.1 BCI competition III data set IVa... 76
4.1.1.1 Experiment procedure... 77
4.1.1.2 Data format ... 77
4.1.2 BCI competition III data set IIIa ... 78
4.1.2.1 Experiment procedure... 78
4.1.2.2 Data format ... 79
4.2 ERD Signal Demonstration ... 80
4.3 Data Preprocessing ... 81
4.4 Data Processing Phase ... 85
4.4.1 Configuration of evaluated methods ... 86
4.4.1.1 CSP ... 87 4.4.1.2 TRCSP ... 87 4.4.1.3 SRCSP ... 87 4.4.1.4 sCSP... 88 4.4.1.5 TR&SR-CSP... 88 4.4.1.6 SFN ... 88
4.4.1.7 CSSP ... 89 4.4.1.8 CSSSP... 89 4.4.1.9 DFBCSP ... 89 4.4.1.10FBCSP ... 89 4.4.1.11FBCSSP ... 89 4.4.2 Performance criteria ... 90
4.4.3 Filter visualization technique ... 91
4.5 Performance Evaluation Results... 92
4.5.1 Spatial filters visualizations ... 95
4.5.2 Spectral filters of the proposed method ... 100
5. CONCLUSION ... 107
REFERENCES... 111
APPENDICES ... 127
ABBREVIATIONS
BCI :Brain Computer Interface
CPU :Central Processing Unit
ALS :Amyotrophic Lateral Sclerosis
VEP :Visual Evoked Potentials
SMA :Supplementary Motor Area
ERD :Event Related Desynchronization
ERS :Event Related Synchronization
EEG :Electroencephalography
SSVEP :Steady State Visual Evoked Potentials
MI :Motor Imagery
SCP :Slow Cortical Potentials
CSP :Common Spatial Patterns
LDA :Linear Discriminant Analysis
RCSP :Regularized Common Spatial Patterns
TRCSP :Tikhonov Regularized Common Spatial Patterns
iCSP :Invariant Common Spatial Patterns
SRCSP :Spatially Regulaized Common Spatial Patterns
SCSP :Stationary Common Spatial Patterns
TR&SR-CSP:Task Related & Spatially Regularized Common Spatial Patterns
SFN :Spatial Filter Network
BP :Back Propagation
LM :Levenberg-Marquardt
CSSP :Common Spatio-Spectral Patterns
CSSP :Common Sparse Spectral Spatial Patterns
SBCSP :Sub Band Common Spatial Patterns
FBCSP :Filter Bank Common Spatial Patterns
Spec-CSP :Spectrally Weighted Common Spatial Patterns
DFBCSP :Discriminative Filter Bank Common Spatial Patterns
SYMBOLS
N :Number of EEG channels T :Number of samples in an epoch K :Number of epochs in a dataset R :Coavariance matrix
~w :Spatial filter
W :Spatial filter matrix C :Number of classes
m :Number of spatial filters per class
α :Multiplier parameter for regularized CSP method
r :Scale parameter for electrode distance for regularized CSP method µ :Learning rate for SFN method
τ :Delay parameter for CSSP method
B :Sparsification parameter for CSSSP method F :Number of filters for FBCSSP method P :Filter degree for FBCSSP method
LIST OF TABLES
Page Table 3.1 : Pseudo-code for BP algorithm ... 56
Table 3.2 : Pseudo-code for LM algorithm. ... 58
Table 4.1 : Subject labels, train and test sizes for BCI competition III Data Set IVa. ... 77
Table 4.2 : An example table for selecting the best hype parameter combination. 87
Table 4.3 : Classification performances of the listed methods for the subjects in BCI competition III Data Set IVa. ... 93
Table 4.4 : Classification performances of the listed methods for the subjects in BCI competition III Data Set IIIa. ... 94
LIST OF FIGURES
Page Figure 1.1 : Basic design and operation of a BCI system. ... 2
Figure 2.1 : A SSVEP signal example. ... 7
Figure 2.2 : P300 speller and P300 signal... 8
Figure 2.3 : Slow cortical potentials observed in an experiment. ... 9
Figure 2.4 : Cortical neuronal BCI... 10
Figure 2.5 : Human Motor Cortex... 11
Figure 2.6 : The Homunculus figure. ... 13
Figure 2.7 : An example figure showing ERD and ERS signals... 15
Figure 3.1 : A general flow diagram about motor imagery classification. ... 20
Figure 3.2 : A trial of a motor imagery experiment. ... 21
Figure 3.3 : EEG electrode locations acording to the international 10-20 standard. ... 22
Figure 3.4 : Frequency spectrum of EEG signal. ... 23
Figure 3.5 : Frequency spectrum of EEG signal during motor imagery. ... 25
Figure 3.6 : Determination of motor imagery active segment. ... 26
Figure 3.7 : Volume conduction effect in scalp EEG. ... 28
Figure 3.8 : Illustration of an epoch in a motor imagery experiment. ... 35
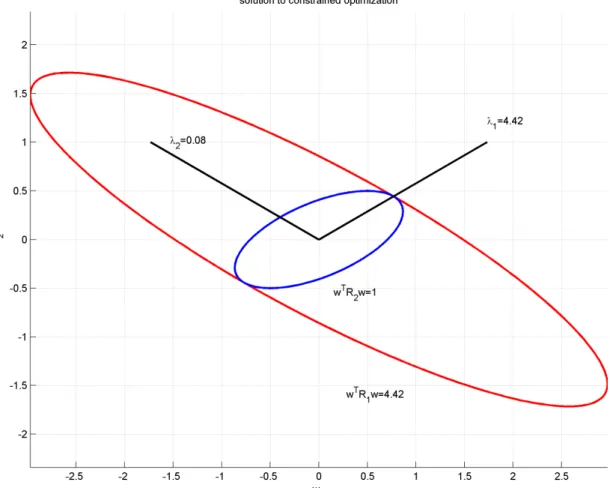
Figure 3.9 : An example figure for constrained optimization of Rayleigh ratio. .. 38
Figure 3.10 : A toy data example for CSP... 40
Figure 3.11 : Plot of obtained eigenvalues for EEG data set. ... 41
Figure 3.12 : Scattering of features for spatially filtered EEG data. ... 42
Figure 3.13 : Illustration of spatial filters obtained with the CSP method... 43
Figure 3.14 : Plot of penalty function for TR&SR-CSP algorithm. ... 49
Figure 3.15 : Structure of the proposed spatial filter network (SFN)... 51
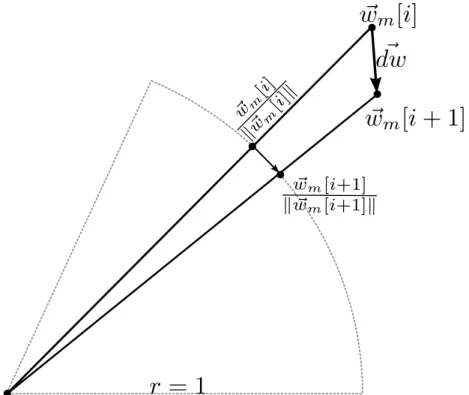
Figure 3.16 : A representative figure of searching the optimal spatial filter over the hypersphere of unit radius... 52
Figure 3.17 : Convergence of Backpropagation and Levenberg–Marquardt algorithms to the desired error. ... 59
Figure 3.18 : Input data and SFN output data for toy data with 2 classes. ... 61
Figure 3.19 : Input data and SFN output data for toy data with 4-classes. ... 62
Figure 3.20 : Converge behavior of the SFN ... 63
Figure 3.21 : Training time of SFN... 63
Figure 3.22 : A block diagram representing the common spatio-spectral patterns algorithm. ... 64
Figure 3.23 : A block diagram representing the common sparse spatio-spectral patterns algorithm. ... 65
Figure 3.24 : A block diagram representing the filter bank common spatial patterns algorithm. ... 66
Figure 3.25 : A flowchart regarding filter bank common spatio - spectral patterns method... 69
Figure 3.26 : Frequency responses of the selected FIR filters used in the study... 72
Figure 3.27 : Toy data example for the FBCSSP method. ... 73
Figure 4.1 : EEG channels used in BCI competition III Data Set IVa. ... 76
Figure 4.2 : Timing diagram for the BCI competition III Data Set IVa. ... 77
Figure 4.3 : EEG channels used in BCI competition III Data Set IIIa... 79
Figure 4.4 : Timing diagram for the BCI competition III Data Set IIIa... 79
Figure 4.5 : Flow diagram of a sample application for ERD signal demonstra-tion. ... 81
Figure 4.6 : ERD signal obtained from subjectay. ... 82
Figure 4.7 : Preprocessing flow diagram... 83
Figure 4.8 : Selected EEG channels in the study. ... 83
Figure 4.9 : Frequency response of the selected filters for preprocessing. ... 84
Figure 4.10 : Obtained train/test sets for five-fold cross validation. ... 85
Figure 4.11 : Block diagram for data processing. ... 86
Figure 4.12 : Confusion matrix generated for performance evalueation. ... 90
Figure 4.13 : Example figures for spatial filter visualization. ... 91
Figure 4.14 : Boxplots displaying the disturbance of classificaion performances for the subjects in dataset IVA. ... 95
Figure 4.15 : Boxplots displaying the disturbance of classificaion performances for the subjects in dataset IIIA. ... 96
Figure 4.16 : Locations of primary motor and somatosensory areas over the brain. 97
Figure 4.17 : Obtained spatial filters for subjectaa. ... 97
Figure 4.18 : Obtained spatial filters for subjectal... 98
Figure 4.19 : Obtained spatial filters for subjectav. ... 98
Figure 4.20 : Obtained spatial filters for subjectaw. ... 99
Figure 4.21 : Obtained spatial filters for subjectay. ... 99
Figure 4.22 : Obtained spatial filters for subjectk3b. ... 101
Figure 4.23 : Obtained spatial filters for subjectk6b. ... 102
Figure 4.24 : Obtained spatial filters for subjectl1b... 103
CLASSIFICATION METHODS FOR MOTOR IMAGERY BASED BRAIN COMPUTER INTERFACES
SUMMARY
Brain computer interfacing (BCI) is an emerging topic which is applied to several areas from gaming equipment to health assistive devices. BCI technology aims establishing a direct communication pathway between the user’s brain and any electronic device. Motor imagery is a BCI methodology in which the user’s imagining of moving a limb is detected without any actual physical movement. Among different BCI techniques, motor imagery is the most popular BCI methodology because of its practicality and being an independent BCI method. Generally, electroencephalogram (EEG) is used for acquiring motor imagery signals since it is a practical, cheap, fast and non-invasive technique for analyzing brain signals. However, classification of motor imagery signals is a challenging topic. Poor spatial resolution of EEG signal makes it difficult to clearly extract motor imagery signals directly. Poor spatial resolution causes motor imagery signals to be mixed up with the signals from the signal sources in the brain which are much stronger.
In this study, novel methods for classification of motor imagery signals were developed. For this purpose, existing methods and proposed methods were presented and their classification performances were analyzed.
In this thesis, firstly, BCI concept and main BCI methodologies were presented. Motor imagery paradigm and physiological sources and main properties of motor imagery signals were described. Then, an extensive literature review about classification of motor imagery signals was exhibited. Next, the state of art method in the motor imagery classification called common spatial patterns (CSP) method was analyzed and then, regularized CSP methods which addresses some drawbacks of CSP were described. Next, the first contribution of this thesis,task related & spatially regularized CSP method was presented as a regularized CSP algorithm. After that, the second contribution of this thesis, a spatial filtering and classification structure namedspatial filter network (SFN) method was presented. After presenting the spatial filtering algorithms, spectral and spatial filtering methodologies were presented. In this manner, a spatio-spectral filtering method called filter bank common spatio-spectral patterns (FBCSSP) method was proposed. Before running the proposed methods, datasets used in the study were introduced. Then, selected configurations of the methods were described.
Obtained results of the proposed methods of this study are promising. Their performance evaluations were reported along with important methods from the literature. Developed methods increased the classification performance of the given datasets. Also the physiological suitability of the proposed methods was demonstrated by analyzing obtained spatial and spectral filters. Results showed the effectiveness of the proposed methods.
MOTOR HAREKET HAYAL˙I TABANLI BEY˙IN B˙ILG˙ISAYAR ARAYÜZLER˙I ˙IÇ˙IN
SINIFLANDIRMA METOTLARI ÖZET
Beyin bilgisayar ara yüzü (BBA), son yıllarda oldukça geli¸sme sa˘glayan bir ara¸stırma konusudur. Oyun ekipmanlarından yapay organlara kadar çok çe¸sitli alanlarda kullanım alanlarına sahip BBA teknolojisinin temel amacı, BBA kullanıcısının beyni ve elektronik bir cihaz arasında herhangi bir çevresel sinir yollarına ba˘glı olmayan aracısız bir haberle¸sme kanalı kurmaktır. Motor hareket hayali (MHH), kullanıcının, motor bir hareketi hayal etmesi sırasında alınan beyin sinyallerinden o hareketin tahmin edilmesi esasına dayanan bir BBA yöntemidir. Ba˘gımsız bir BBA türü olması ve pratik olması gibi nedenlerden dolayı, motor hayali çe¸sitli BBA türleri arasında en popüler olanıdır. Motor hareket hayali sinyalleri beyinin motor korteks olarak adlandırılan, istemli hareketlerden sorumlu bölgesinden elde edilir. Bu sinyallerin alınması için fonksiyonel manyetik rezonans görüntüleme (fMRI), pozitron emisyon tomografi (PET), Elektrokortikogram (EKoG) ya da Elektroansefalografi (EEG) gibi i¸saret alma metotları kullanılabilir. Bu sinyal türleri içerisinde pratik, ucuz, hızlı ve giri¸simsiz bir yöntem oldu˘gundan, genellikle EEG tercih edilir. Popüler olmasına ra˘gmen, motor hareket hayali i¸saretlerinin sınıflandırılması oldukça zordur. Bunun temel nedeni ise, dü¸sük uzamsal çözünürlüktür. Dü¸sük uzamsal çözünürlük nedeniyle motor hareket hayali ile ili¸skili sinyaller beynin farklı bölgelerinde bulunan ba¸ska sinyal kaynakları ile karı¸sır ve bu, elde edilen EEG sinyalinden motor hareket hayali sinyallerinin ortaya çıkarılmasını güçle¸stirir. Ayrıca motor hareket hayali sinyal karakteristiklerinin ki¸siden ki¸siye hatta aynı ki¸si için zamanla de˘gi¸sebilir olması, sınıf sayısının sınırlı olması, EEG i¸saretinin dura˘gan olmaması ve deneklerin motor hareketlerin hayal edilmesi konusunda tecrübesiz olması da bu tarz i¸saretlerin sınıflandırılmasını güçle¸stiren unsurlardandır.
Tezin giri¸s kısmında BBA hakkında temel bilgiler ve önemli BBA metotlarından bahsedilmi¸stir. Bu BBA metotları ¸su ¸sekilde sıralanabilir: i) Dura˘gan görsel uyarılmı¸s potansiyel (Steady state visual evoked potentials) tabanlı BBA, ii) P300 tabanlı BBA, iii) Yava¸s kortikal potansiyeller (Slow cortical potentials) tabanlı BBA, iv) Kortex-neron aktivasyon potansiyeli (Cortical-neuronal activation potentials) tabanlı BBA, v) Motor hareket hayali (Motor imagery) tabanlı BBA. Tez çalı¸sması konusu motor hareket hayali oldu˘gu için, MH hakkında detaylı bilgiler verilmi¸stir. MH sinyallerinin fizyolojik temelleri, sinyal karakteristikleri, MH sinyallerinin i¸slenmesi sırasında kar¸sıla¸sılan zorluklar gibi konulara de˘ginilmi¸stir. Ardından, motor hareket hayali i¸saretlerinin sınıflandırılmasına yönelik ayrıntılı bir literatür ara¸stırması sunulmu¸stur.
Motor hareket hayali sırasında, motor korteks bölgesinde olay ili¸ski senkronizasyon (event related synchronisation, ERS) ve olay ili¸skili desenkronizasyon (event related desynchronisation, ERD) olarak adlandırılan güç de˘gi¸simleri meydana gelir. ERD, belirli bir frekans bandında ölçülen i¸saretteki güç dü¸sümüne, ERS ise belirli bir
frekansta ölçülen i¸saretteki güç artı¸sına kar¸sılık gelir. Motor hareket hayali sırasında en belirleyici i¸saret, 8-16 Hz arasındaki µ bandındaki güç dü¸sümüdür. Ayrıca 20-30 Hz arasında da ERS i¸saretleri motor hareket hayali ile birlikte görülmektedir.
Çalı¸smada motor hareket hayali olarak adlandırılan, ki¸sinin kaslarını hareket ettirmesi ya da ettirmeye niyetlenmesi sırasında beynin motor korteks bölgesinde ortaya çıkan güç de˘gi¸simlerini analiz eden beyin bilgisayar ara yüzü konusunda mevcut sınıflandırma metotları ara¸stırılmı¸s ve tez çalı¸smasında yeni metotlar geli¸stirilmi¸stir. Bu çalı¸smada, motor hareket hayali i¸saretlerinin sınıflandırılması için yeni metotlar geli¸stirilmi¸stir. Bu amaçla literatürdeki mevcut metotlar ile beraber, tez kapsamında geli¸stirilen metotlar sunulmu¸s ve tüm bu metotların sınıflandırma performansları incelenmi¸stir.
Metotlar kısmında, MH sınıflandırmasına yönelik literatürdeki belli ba¸slı yöntemler anlatılmı¸stır. Öncelikle, MH sınıflandırmasına yönelik genel bir çerçeve çizilmi¸s, ardından, her bir i¸slem adımı detaylı bir biçimde, literatürdeki mevcut yayınlardan bahsedilerek anlatılmı¸stır. MH sınıflandırmada çok önemli bir uzamsal sınıflandırma metodu olan “Ortak uzamsal örüntüler” (Common Spatial Patterns, CSP) metodu anlatılmı¸s ve CSP metoduna yapılan iyile¸stirmelerden bahsedilmi¸stir.
Metotlar kısımda, Tezin katkılarından ilki olan “Görev ili¸skili & uzamsal düzenlemeli ortak uzamsal örüntüler” (Task Related & Spatially Regulaized Common Spatial Patterns, TR&SR-CSP) isimli çalı¸sma anlatılmı¸stır. Bu çalı¸smada düzenlenmi¸s bir CSP metodu önerilmi¸stir. Metot motor hareket hayali sinyallerinin beyindeki olu¸sum noktalarını kullanan bir düzenlenmi¸s (regularized) CSP metodudur. Bu metotta, uzamsal filtrelerin e˘gitimi sırasında özel olarak hazırlanmı¸s bir ceza matrisi olu¸sturma algoritması tanıtılmı¸stır. Bu ceza matrisi, verilen görevlere ili¸skin motor korteksteki konumları göz önünde bulundurarak uzamsal filtrelerin korteks üzerinde bu bölgelere odaklanmasını sa˘glamı¸stır. Çalı¸sma sonuçları incelendi˘ginde, fizyolojik verilerle uyumlu sonuçların elde edildi˘gi gözlemlenir. Çalı¸sma 2014 senesinde biyo-informatik ve biyomedikal mühendisli˘gi uluslar arası konferansı” (IWBBIO) konferansında sunulmu¸stur.
Metotlar kısmında ikinci olarak CSP’nin eksikliklerine de˘ginilerek “Uzamsal filtre a˘gı” (Spatial Filter Network, SFN) metodu sunulmu¸stur. Bu metot, bir uzamsal filtre ve bir sınıflandırıcının birlikte optimizasyonunu sa˘glayan çok katmanlı bir yapıdır. Önerilen yöntem, CSP metodunun iki problemini adresler ve bunlara çözüm arar. Bu problemler, i) CSP metodunun yalnızca sınıflar arası saçılımları iyile¸stirmesi, buna ra˘gmen, sınıf içi saçılımlar ile ilgilenmemesi, ii)CSP metodunun sınıflandırma performansı ile de˘gil, verilen optimizasyon fonksiyonunu iyile¸stirmeye çalı¸smasıdır. SFN ise e˘gitim kümesindeki her elemanı tek tek a˘ga sunarak, hem uzamsal filtreyi, hem de sınıflandırıcıyı e˘gitir. SFN a˘gının e˘gitimi için yapay sinir a˘glarında kullanılan geriye yayılım yöntemi kullanılmı¸stır. Bunun için a˘ga sunulan her e˘gitim kümesi elemanı için a˘gın olu¸sturdu˘gu çıkı¸s incelenmi¸s ve hem uzamsal filtre a˘gırlıkları, hem de sınıflandırıcı a˘grırlıkları güncellenmi¸stir. Optimizasyon yöntemi olarak yapay sinir a˘glarının e˘gitiminde kullanılan Levenberg-Marquardt (LM) ve back propogation (BP) metotlarından yararlanılmı¸stır. Tez içersinde SFN metodunun çalı¸stırılmasına ve e˘gitimine yönelik matematiksel denklemler sunulmu¸stur. SFN metoduna ili¸skin yayın, PLoS One isimli dergide yayınlanmı¸stır.
Metotlar kısmında son olarak uzamsal – spektral filtreleme metotlarına de˘ginilmi¸stir. Bu metotlar hem uzamsal hem de spektral düzlemde optimizasyonlar yapmaktadırlar.
CSP basitli˘gi ile beraber güçlü bir metot olmasına kar¸sın, bazı eksiklikleri vardır. Motor hareket hayali tabanlı beyin bilgisayar ara yüzlerinde CSP’nin ba¸sarısı büyük oranda ERD (olay tabanlı desenkronizasyon) ve ERS (olay tabanlı senkronizasyon) olarak adlandırılan fizyolojik fenomenlere ba˘glıdır. Halbuki pratikte ERD’nin bulundu˘gu frekans bandı ki¸siden ki¸siye farklılık gösterir. Bu, pratik bir BCI tasarlarken kar¸sıla¸sılan en büyük problemlerden biridir. Yakın zamana kadar CSP kullanılırken frekans bandı ya geni¸s bant kullanılarak tanımsız bırakılmaktaydı ya da manüel ayarlanmaktaydı. Genel olarak, CSP’yi EEG i¸saretini filtrelemeden ya da uygun olmayan bir frekans bandında filtreleyerek uygulamak dü¸sük bir sınıflandırma ba¸sarımı verecektir. Bu durumda yapılacak bir i¸s, zaman harcayıcı bir ara¸stırmalar ve bazı manüel ayarlamalar ile her bir denek için en iyi frekans bandını bulmak olacaktır. Bu ¸sekilde sınıflandırmanın ba¸sarımı artırdı˘gı gösterilmi¸s olsa da, zaman harcayıcı ve zahmetli bir i¸stir. Bu nedenle son zamanlarda uzamsal filtrelerin frekans filtreleri ile e¸s zamanlı optimizasyonuna ili¸skin yöntemlerin ara¸stırılması oldukça önem kazanmı¸stır. Bu nedenlerden dolayı, CSP gibi sadece uzamsal düzlemde çalı¸san metotlar yerine filtrelerin spektral karakteristiklerinin de otomatik olarak iyile¸stirilmesi amaçlanı¸stır. Literatürdeki mevcut spatio-spectral metotlar anlatılmı¸s ve tezin son çıktısı olan “Filtre bankası temelli ortak uzamsal örüntüler” (Filter bank common spatio spectral patterns, FBCSSP) isimli, hem spektral hem de uzamsal düzlemde filtre iyile¸stirilmesi yapan bir metot geli¸stirilmi¸stir. Sunulan metot, çe¸sitli frekanslarda filtreleme yapan bir filtre bankası ve arka arkaya dizilmi¸s iki adet CSP katmanından olu¸sur. ˙Ilk CSP katmanı, her bir filtre bankası çıkı¸sını uzamsal olarak filtreler böylece, EEG i¸sareti dar bantlarda uzamsal filtrelenmi¸s olur. ˙Ikinci CSP katmanı ise ilk katmandan gelen uzamsal filtrelenmi¸s i¸saretleri alarak en önemli i¸saretleri ortaya çıkartmaya çalı¸sır. Bu nedenle ikinci katman bir nevi frekans seçimi yapmaktadır. ˙Iki CSP katmanı ise spatio-spektral bir filtre yapısı olu¸sturmu¸s olur. Sonuçlar incelendi˘ginde, yüksek sınıflandırma ba¸sarımlarına ula¸sılabildi˘gi görülmektedir. Sunulan çalı¸sma “Biyo-medikal ve biyo informatik alanlarında bilgi teknolojileri” (ITBAM 2016) isimli konferansta sunulmak üzere kabul almı¸stır. Çalı¸sma “Bilgisayar bilimlerinde konferans notları” (LNCS) isimli dergide yayınlanacaktır.
Sonuçlar kısmında, kullanılan veri kaynaklarından bahsedilmi¸s, veri kümelerinin özelliklerinden bahsedilmi¸stir. Daha sonra, sonuçların elde edilmesine yönelik bir çerçeve sunulmu¸s ve yapılacak de˘gerlendirmeler anlatılmı¸stır. Ayrıca sonuçlar elde edilirken kullanılan metotlara ili¸skin bütün parametre ayarlamaları detaylıca sunulmu¸stur. Sonuçlar kısmında hem sayısal hem de görsel sonuçlar kar¸sıla¸stırmalı olarak verilmi¸stir. Sonuçlar incelendi˘ginde, önerilen metotların ba¸sarılı sonuçlar elde etti˘gi görülmü¸stür. Literatürdeki di˘ger metotlara ili¸skin sonuçlar ile de˘ger-lendirildi˘ginde, önerilmi¸s metotlardan elde edilen sınıflandırma performansları ümit vericidir. Önerilen metotların çalı¸sılan veri kümelerinde performansı yukarı çekti˘gi görülmektedir. Sayısal performans de˘gerlendirmesinin yanında ayrıca, önerilen metotların motor hareket hayali fizyolojisi ile uygunlu˘gu elde edilen uzamsal ve spektral filtrelerin analiz edilmesi ile gözlemlenmi¸stir. Bütün bu sonuçlar önerilen metotların etkili ve ba¸sarılı oldu˘gunu göstermektedir.
1. INTRODUCTION
Human brain is the most complex organ in the human body. Every thought, feeling, memory, experience or action is produced by our brain. Weighting about 1.4 kilograms, this jelly like mass of tissue contains nearly one hundred billion nerve cells called neurons. The complexity of the connectivity between these cells is enormous. Each neuron can make contact with thousands or even tens of thousands of others, via tiny structures called synapses. Also, the pattern and strength of the connections is constantly changing and it is impossible to find two brains alike.
Brain can be thought as a central processing unit (CPU) of an electronic device in which CPU perceives the outer world with various sensors such as temperature sensor, camera or microphone input while executing physical actions with servo motors, speakers or LEDs. The signal is transmitted between the CPU and those peripherals via conductive traces, similar to our peripheral nerves. However, in some cases such as amyotrophic lateral sclerosis (ALS) syndrome, the path between the brain and the peripheral limb may be broken and brain loses the ability to control the limbs. Therefore, an alternative path between the outer world and the brain becomes essential. Brain computer interface (BCI) is a communication and control mechanism between the user and the system. According to its original definition, a BCI is a communication and control system that does not depend in any way on the brain’s normal neuromuscular output channels [1]. It is obvious that, a BCI system gives the user ability to send control commands to an electronic device. Such an interface is the only way for a disabled person to use electronic devices. In order to control a BCI system properly, the user should generate different brain activation signals for different commands. While analyzing the brain signals of the user and converting them to an output device called neuro-prosthesis, a BCI system creates a direct link between the thoughts of the user and the outer world. In the first international BCI technology conference organized in 1999, a BCI system is defined as a “communication and control channel between the brain and the computer that does not depend on the
EEG ECOG SINGLEaUNIT
SIGNAL
ACQUISITION EXTRACTIONFEATURE TRANSLATIONALGORITHM
SIGNALaPROCESSING
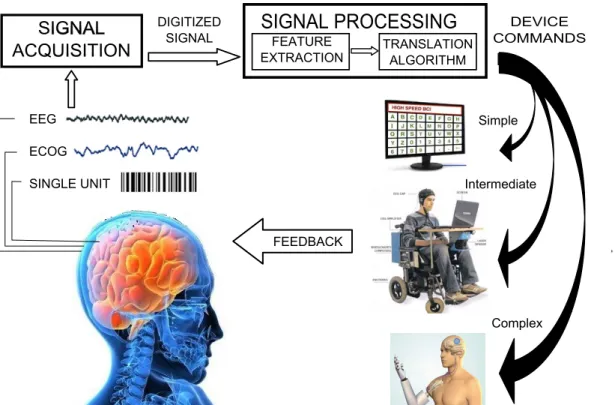
DIGITIZED SIGNAL DEVICE COMMANDS Simple Intermediate Complex FEEDBACKFigure 1.1: Basic design and operation of a BCI system.
brain’s normal output channels of peripheral nerves and muscles” [2]. In Figure 1.1, basic design and working principle of a BCI system is given. Signals from the brain are acquired by electrodes on the scalp or in the head and processed to extract specific signal features (e.g. amplitudes of evoked potentials or sensorimotor cortex rhythms, firing rates of cortical neurons) that reflect the user’s intention. These features are translated into commands that operate a device (e.g. a simple word processing program, a wheelchair, or a neuroprosthesis). Evoked potentials [3], sensor-motor cortex rhythms [4, 5] and neuronal activation frequencies [6] are examples for features used in BCI systems.
In the next step, obtained features are converted to the control commands for a controlling device. The controlling device may be any electronic device such as a health assistive device like a neuro-prosthesis, a wheel chair or a word processing program. The success of a BCI depends on how effective the two systems (user and the controlling device) interact with each other. In this system, the user should transmit various control commands by using his/her brain. In this case, the brain may be called as a signal source in a BCI system. The role of this signal source is to generate different patterns for different control commands. And for the BCI system, it should select and
extract the right features from obtained brain signals, convert them to the commands and send to the controlled device effectively [7].
The brain computer interface sets up a communication channel between the patient’s brain and the outer world. In this sense, BCI technology may be considered as an assistive technology that improves the life standards of the physically handicapped individuals. Amyotrophic lateral sclerosis (ALS), brainstem stroke, brain or spinal cord injury, cerebral palsy, muscular dystrophies, multiple sclerosis, and numerous other diseases impair the neural pathways that control muscles or impair the muscles themselves. They affect nearly two million people in the United States alone, and far more around the world [8–11]. Those most severely affected may lose all voluntary muscle control, including eye movements and respiration, and may be completely locked in to their bodies, unable to communicate in any way. The immediate goal is to provide these users, who may be completely paralyzed, or ‘locked in’, with basic communication capabilities so that they can express their wishes to caregivers or even operate word processing programs or neuro prosthesis. There are many BCI studies in the literature about rehabilitation of patients [12–15]. In addition to its benefits for highly disabled individuals, BCI technology is gaining importance in non medical applications such as neuroscience researches, robotic control, gaming and virtual reality [16–23].
A BCI system uses brain signals while recognizing the thoughts or intents of the user. Generally a BCI system uses electroencephalography (EEG) signals that are collected non invasively with electrodes located over the head [24–26]. Apart from EEG there are many studies in the literature about BCI with Magneto encephalography (MEG) [27, 28] functional magnetic resonance imaging (fMRI) [29, 30] and optical imaging methods [31, 32]. MEG, fMRI and optical imaging methods are impractical and expensive methods. Also, fMRI and optical imaging methods measure blood hemodynamic. Therefore, they can’t generate quick reactions. With its simplicity, practicality and having quick response, EEG is the most suitable discipline along the mentioned BCI methods [7, 33]. According to the signal type and signal source in the brain, various types of BCI systems are defined. Steady state visual evoked potentials (SSVEP), P300 evoked potentials, slow cortical potentials (SCP), cortical – neuronal activation potentials and motor imagery (MI) are the most known BCI
methodologies. Among this methods, motor imagery is the most popular method and widely used in BCI applications [34, 35]. Motor imagery is a mental process by which an individual rehearses or simulates a given physical action [36]. A motor imagery based brain–computer interface translates a subject’s motor intention into a command signal through real-time detection of motor imagery states, e.g. imagination of left and right hand movement [37]. The studies in this thesis are based on BCI systems with motor imagery. Detailed description about motor imagery among other methodologies will be given in the next chapter. In this thesis, new methods for classifying motor imagery signals are researched. Users’ intentions about moving their limb reflects some activation changes in motor cortex area. There are so many methods for extracting and classifying this activation patterns in the literature. This thesis proposes new classification methods to the literature which will be analyzed deeply in the following chapters. Each contribution is proposed as a new methodology for a corresponding motor imagery classification concept. The outline of the thesis is as follows: In chapter 2, motor imagery and other BCI methodologies are described. Physiological sources of motor imagery signals and brain activation patterns are mentioned. Also some background about motor imagery signal classification is given. Chapter 3 introduces the methods used for motor imagery signal classification. It starts with common problems faced while working with MI signals and then, continues with the spatial filtering paradigm and the most popular method used in BCI systems, common spatial patterns (CSP). After that, spatial filter regularizing methods in the literature are described along with the firstly proposed method of this thesis: “task related & spatially regularized common spatial patterns. (TR&SR-CSP)” Then, another contribution of this paper about spatial filtering is presented: “spatial filter network (SFN)”. Then, it introduces a newer paradigm called spatio-spectral filtering and gives some background about spatio-spectral filtering. Chapter 3 finally presents the last contribution of the thesis: “filter bank common spatio - spectral patterns (FBCSSP)”. The computer simulations of the methods presented in the previous chapters are given in Chapter 4. This chapter introduces the data sources used in the MI signal classification and then, shows the results of the proposed methods compared with other state-of-art methods in their topics. Chapter 5 summarizes the thesis, describes the difficulties met, criticizes the proposed methods with their handicaps, gives examples about future works and finally concludes the thesis.
2. BRAIN COMPUTER INTERFACES
In respect to their electrophysiological properties, current BCI systems may be summed up in five groups:
• Steady state visually evoked potentials (SSVEP)
• Slow cortical potentials (SCP)
• P300 evoked potentials (P300)
• Motor imagery (MI)
• Cortical neuronal activation potentials
These BCI methods may be called dependent or independent according to the underlying neuronal mechanisms for the given modality. SSVEP is a dependent BCI while other four are independent BCIs [7].
A dependent BCI does not use the brain’s normal output pathways to carry the message, but activity in these pathways is needed to generate the brain activity (e.g. EEG) that does carry it [7]. For example, a BCI system uses matrix of letters that flash one at a time, and the user looks directly at a specific letter so that the visual evoked potentials (VEP) recorded over the visual cortex at the interval of that letter is much larger than the intervals of other letters [38]. In this case, the brain’s output channel is EEG, but the generation of the EEG signal depends on gaze direction, and therefore on extra ocular muscles and the cranial nerves that activate them. A dependent BCI is essentially an alternative method for detecting messages carried in the brain’s normal output pathways: in the present example, gaze direction is detected by monitoring EEG rather than by monitoring eye position directly. While a dependent BCI does not give the brain a new communication channel that is independent of conventional channels, it can still be useful [39].
An independent BCI does not depend on brain’s normal output channels in any way. Peripheral nerves and muscles are not the carrier of the transmitted message and
furthermore, any activity in these muscles and nerves is not needed for generation of the brain activity which involves the message. For example, a BCI system which uses P300 modality is an independent BCI. In the study of Farwell and Donchin [3], the user looks at a matrix of letters which flashes one at a time. The user waits for a specific letter to be flashed. When it is flashed, P300 evoked potential is generated in the brain. In this case, the output channel of the brain is EEG and the generation of the EEG signal depends only on the user’s intent, not on the orientation of the gaze like SSVEP.
Peripheral nerves and muscles don’t play a critical role on the independent BCIs. Independent BCI systems utilize totally nonconventional output pathways of the brain, so that, they are of greater theoretical interest than dependent BCIs. Also, for patients with highly severe neuromuscular disabilities who may lack all normal output channels (including ocular muscles), independent BCI systems are likely to be more useful.
2.1 Steady State Visual Evoked Potentials (SSVEP)
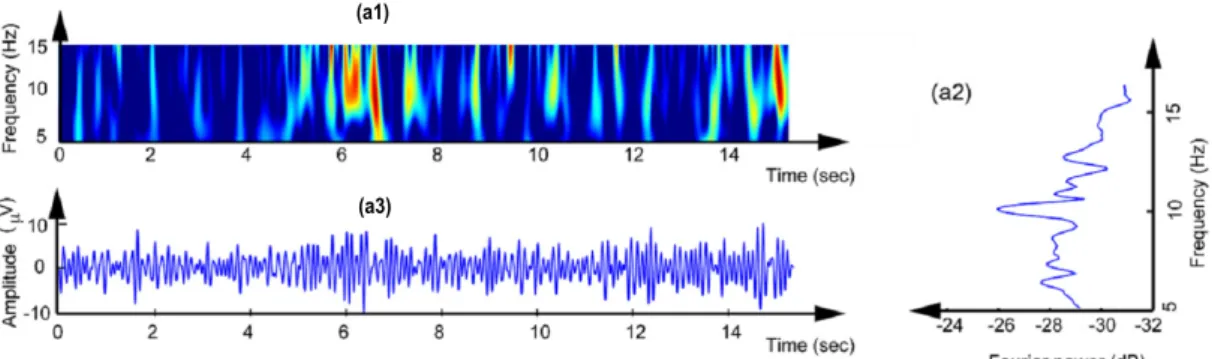
Steady state evoked potentials (SSEP) are sinusoidal vibrations observed in EEG when optical, auditory or somatic senses are stimulated with rapid and periodic stimulations. In case of Steady state visual evoked potentials based BCI, various stimulators (e.g. LEDs blinking in different frequencies) are displayed to the user in order to stimulate his/her occipital cortex [6, 40, 41]. When the user focuses on one of the blinking stimulators, the corresponding frequency component of the EEG signal received from occipital area will be much higher than that of the other blinking stimulators. Therefore, it will be very straightforward to find out which stimulator user had focused his attention on without any training. In Figure 2.1, sample EEG signal in time, frequency and time/frequency domains is shown while looking at a stimulator vibrating at 10 Hz frequency in a SSVEP BCI system.
Besides visually stimulated ones, BCI systems related with auditory (Steady State Auditory Evoked Potential, SSAEP) [43, 44] and somatic (Steady-state somatosensory evoked potentials, SSSEP) [45, 46] senses are developed in the literature.
Frequencies of stimulator used in SSVEP based BCI systems are generally less than 20 Hz. Also, maximum SNR is obtained at about 10 Hz which is inside the frequency
(a1)
(a3)
Figure 2.1: SSVEP signal while looking at a target vibrating at 10 Hz. a1: time, a2: frequency, a3: time-frequency axis (From: Vialatte et.al., 2010 [42]).
band (8 – 12 Hz) of the alpha waves in occipital area. Although it is possible to get the SSVEP signal components above 10 Hz, separability of various frequencies reduces [42].
Thanks to its shorter response times, higher information transfer rate (>25 bits/minute), requirement of less electrodes than other BCI modalities and no requirement for user training, SSVEP based BCI systems has gained extremely wide application areas [47]. In the study of Muller et al. [6], a prosthesis hand was controlled in four directions using SSVEP. They reported that the developed prosthesis hand could execute a new movement between 2 and 5 seconds. In another study of Calhoun et al. [48], a flight simulator controlled with two buttons was realized by using SSVEP based BCI system. In this study, average decision time was measured as 2.1 seconds with 92% accuracy. Cheng et al. [40], realized a multi class BCI system involving 10 number and 2 control buttons. They reported that the maximum information rate was measured 27.15 bits/minute. Lalor et al. [49] controlled a computer game using SSVEP. In this BCI system with two classes, gamers were able to play the game with mean performance of 89.5%. These SSVEP based BCI systems are called as dependent BCI systems since they depend on the user’s ability to control gaze direction. However, it was reported that, VEP amplitude in these systems reflects attention as well as gaze direction [50], and so that, they may be independent of neuromuscular function to some extent.
2.2 P300 Evoked Potentials
Infrequent or particularly significant auditory, visual, or somatosensory stimuli, when interspersed with frequent or routine stimuli, typically evokes a negative sudden peak at about 300 ms in the EEG over parietal cortex [51–53]. The ERP (event related
potential) called P300 or P3 wave is generally obtained in an interval between 300 ms and 500 ms after an infrequent stimulus occurs. The origin of P300 wave is unclear, some theories state that this phenomenon arises with the fetching of processed sensor data up to consciousness level [54, 55]. P300 differs from SSVEP since obtained waveform is a result of activities related to intra-processes of the brain, not directly related to the given stimuli. Also, it is possible to obtain P300 signal with various types of stimulators (visual, auditory, somatic). Generally, P300 based BCI studies uses oddball method. In this method, target stimulus is interspersed in routine stimulus (non target) and showed up non frequently and randomized. This non frequent target stimulus causes P300 waves to occur in the EEG signal.
(a) (b)
Figure 2.2: a) P300 speller system showing matrix of letters (From: Farwell and Donchin,1988, [3]). b) P300 signal (From: Vialatte et.al., 2010 [42]).
BCI speller designed by Farwell and Donchin in 1988 [3] was based on this oddball method. Since its original design in 1988, the speller became the most used BCI speller in the world [56]. Speller interface is given in Figure 2.2. In this speller, letters and numbers forming a matrix with 6 rows and 6 columns are shown to the user on the computer screen. At every 125 ms, a row or a column of this matrix lights up. In order to create the P300 waveform, the user should select a character from the matrix and wait for that character to be illuminated. The selected character should be highlighted several times. When the rows and columns are being highlighted randomly, the user tries to count the number of times that specific character blinked so that he/she can focus on the matrix. While this process continues, EEG signal is collected from user’s parietal cortex and average amplitude is calculated for each row and column separately. Finally, the amplitude for the column and row of the selected character will be higher
than that of other characters. Obtained cumulative P300 signal for selected character is shown in Figure 2.2.
As in SSVEP, no training procedure is needed in order to use a P300 BCI system. P300 wave is a natural reaction in all humans related to perceptual selectivity [7].
2.3 Slow Cortical Potentials (SCP)
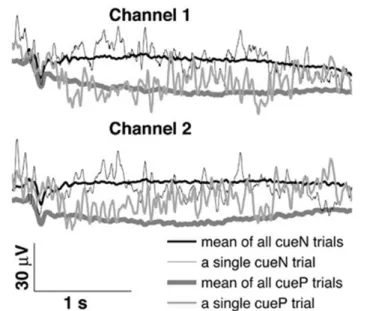
Slow cortical potentials (SCP) are negative or positive voltage changes observed in scalp EEG and last for 0.5 to 10 seconds with amplitude of nearly 50 µV. As a result of Birbaumer and other researchers in similar area, it was observed that, with the help of visual and auditory feedbacks, not only healthy individuals, but also severely physically disabled patients may learn to control their SCPs in any direction [57]. Therefore, the voluntary control makes use of SCPs as a brain computer interface [58–61]. Birbaumer developed a device called thought translation device (TTD) with the help of SCPs. TTD was a computer program which helps the user to control his/her SCPs by providing auditory and visual feedbacks to the user. TTD was tested in people with last-stage amyotrophic lateral sclerosis (ALS) patients and has shown capability for basic communication skills [62]. In Figure 2.3, an experiment about slow cortical potentials is given [63]. The user in the experiment is able to control mouse pointer to the given target (cueN or cueP). When the target is shown, SCP is observed in one second period. In this example, two electrodes were used.
Figure 2.3: Slow cortical potentials observed in an experiment including two types of tasks (cueN and cueP) (From: Mensh et.al. 2004 [63]).
2.4 Cortical Neuronal Activation Potentials
Since 1960s, it was possible to record the activation potentials of one single neuron during a physical activity of an animal by using metal micro-electrodes. Researchers had studied on the animals and tried to teach them controlling of firing of a single neuron. Some studies reports that monkeys was able to learn firing a single neuron on the motor cortex [64–67]. These studies gave hopes to develop neuro-prosthesises for physically handicapped individuals. However, placing of the recording electrode over the motor cortex is an invasive operation and contact of the placed electrode with the related neuron may be lost over time so that, this method was not widely accepted. In Figure 2.4, a representative image of intra-cortical electrode developed by Keneddy in 1989 is shown. Such an electrode was installed on monkeys and patients with ALS or brain stem injury and enabled researchers to receive neuronal signals stably over a period of one year [68, 69].
Figure 2.4: Cortical neuronal BCI. A cone shaped electrode records one single neurons activation. The users were able to control the firing rate of that
neuron in order to control a device (From: Wolpaw et.al. 2002 [7]).
2.5 Motor Imagery (MI)
A motor imagery based BCI translates subject’s motor intention into a command signal by analyzing motor imagery states such as imagination of left and right
hand movement. According to the Khorshidtalab et al. [70], motor imagery electroencephalogram signals are the only bio-signals that enable locked-in patients, who have lost control over every motor output, to communicate with and control their surroundings. The following sections will introduce the parts of the brain related with motor imagery and nature of motor imagery signals by giving example studies in the literature.
2.5.1 Motor cortex
Human brain may be inspected in four parts which are frontal, parietal, occipital and temporal areas. Motor cortex is a part of the brain which is responsible for the planning, controlling and execution of the voluntary movements and it is found on the cerebral cortex on the frontal area. A figure representing the motor cortex is given in Figure 2.5. Motor cortex is divided in following sub areas:
Lateral Premotor Area Supplementary Motor Area Primary Motor Cortex Primary Somatosensory Cortex Posterior parietal cortex Lateral View
Figure 2.5: Human Motor Cortex.
Primary motor cortex: Primary motor cortex is the main source of the neural impulses that pass down to the spinal cord and controls the execution of movement. However, some of the other motor areas in the brain also play a role in this function. The primary motor cortex contains cells with giant cell bodies known as "Betz cells". It is located on the area 4 of the precentral gyrus. Its location was confirmed in the
mid-20th century in brain operations performed by neurosurgeons such as Dr. Wilder Penfield, in Montreal. While performing operations to alleviate patients’ epileptic symptoms, Penfield stimulated various areas of the cortex to identify vital ones that should not be removed. In this process, he discovered that stimulations applied to the precentral gyrus triggered highly localized muscle contractions on the contralateral side of the body and that there was a somatotopic representation of the corresponding parts of the body in Area 4 in the primary motor cortex.
Premotor Cortex: The premotor cortex is an area of motor cortex lying within the frontal lobe of the brain just anterior to the primary motor cortex. It has been studied mainly in primates, including monkeys and humans. The functions of the premotor cortex are diverse and not fully understood. It projects directly to the spinal cord and therefore may play a role in the direct control of behavior, with a relative emphasis on the trunk muscles of the body. It may also play a role in planning movement and in the spatial guidance of movement by integrating sensory information. Also, it controls the muscles that are closest to the body’s main axis.
Supplemantary Motor Area: Penfield described the supplementary motor area (SMA), on the top or dorsal part of the cortex [71]. Each neuron in the SMA may influence many muscles, many body parts, and both sides of the body. The map of the body in SMA is therefore extensively overlapping [72]. Also, SMA projects directly to the spinal cord and may play some direct role in the control of movement. Roland [73] suggested that the SMA was especially active during the internally generated plan to make a sequence of movements. In the monkey brain, neurons in the SMA are active in association with specific learned sequences of movement [74]. Others have suggested that, because the SMA appears to control movement bilaterally, it may play a role in inter-manual coordination [75]. Also, it is suggested that, because of the direct projection of SMA to the spinal cord and because of its activity during simple movements, it may play a direct role in motor control rather than solely a high level role in planning sequences [76,77]. On the basis of the movements evoked during electrical stimulation, it has been suggested that the SMA may have evolved in primates as a specialist in the part of the motor repertoire involving climbing and other complex locomotion [78, 79].
Besides these areas, other brain regions outside the cerebral cortex are also of great importance to motor function, most notably the posterior parietal cortex, primary somatosensory cortex, cerebellum, basal ganglia, red nucleus as well as motor nuclei. The pioneer study of Penfield and Boldrey in 1937 revealed important information about spatial organization of motor cortex. They reported that, any muscle group in the body is presented at a specific area on the motor cortex [80]. The sizes of these areas are proportional with the usage skills of the corresponding limb rather than the limb’s real size. The popular figure namedhomunculusresizes the limbs proportional to their areas occupied on the motor cortex which is shown in Figure 2.6. They obtained the size and the location of these regions by stimulating each area at a surgery.
Figure 2.6: The Homunculus figure obtained by Wilder Penfield, while stimulating various areas on motor cortex .(From: Sage, 1971. [81]).
2.5.2 Imagination of motor movement
A BCI design based on motor imagery perceives motor intention of a subject from his/her brain and trans-codes it to a digital command for the computer system. In motor imagery experiments, it was observed that there were variations in measured power
at special frequencies which are called µ (8-12 Hz) band and β (18-26 Hz) bands. In the first BCI design based on motor imagery [4], EEG signal related to the right and left hand imaginations were classified by analyzing the power of µ andβ bands. Power decrease or increase may be considered to be due to a decrease or an increase in synchrony of the underlying neuronal populations, respectively. The former case is called event-related desynchronization or ERD [82, 83] and the latter event-related synchronization (ERS) [84]. Generally, ERD or ERS oscillations are observed with motor or mental activities or stimulations. These oscillations can be, e.g., due to modulating influences of neurochemical brain systems, changes in the strength of synaptic interactions, or changes of intrinsic membrane properties of the local neurons. The dynamics of brain oscillations associated with sensory and cognitive processing and motor behavior can form complex spatio-temporal patterns. For example, a synchronization of higher frequency components embedded in a desynchronization of lower frequency components can be found on a specific electrode location at the same moment of time. Simultaneous desynchronization and synchronization of 10-Hz components are possible on different scalp locations [26]. An example figure showing up ERD and ERS patterns is given in Figure 2.7 from the study of from Pfurtscheller et. al. (2001). In this figure, upper panel shows the band power obtained from C3 electrode at three different frequency bands (10-12 Hz, 14-18 Hz, 36-40 Hz) during right index filter lifting. Vertical line indicates the trigger of movement onset (t=0s). Note that, ERD starts 2.5s prior to the movement, peak gamma ERS shows up immediately prior to the movement onset and beta ERS appears within one second after the movement. The lower panel gives EEG time frame showing ERD and ERS signals for different electrodes regarding to upper tab.
Motor imagery can be thought as a mental preview of a movement without any physical output. It is widely accepted that, similar areas in brain are active during mental imagery or during execution of a movement. Therefore, they have the same functional relationship to the imagined or represented movement and the same causal role in the generation of this movement [85]. According to this concept, the imagery of a motor movement differs from execution of it only by being blocked at cortex -spinal level [86]. Recent functional brain imaging studies revealed similar activation patterns during mental imagery or physical execution of a movement by analyzing
C3 GammaTERS 36-40THz Post-movement BetaTERS 14-18THz MuTERD 10-12THz ERD/ER ST) ERD ERS TimeT(seconds)
Figure 2.7: An example figure showing ERD and ERS signals.
regional cerebral blood flow (rCBF). Roland [73] observed increased rCBF over supplementary motor area duing a sequenced finger movement experiment. Also, similar activation patterns were observed with imagination of various motor actions with positron emission tomography (PET) and functional magnetic resonance imagery (fMRI) [87, 88].
3. CLASSIFICATION OF MOTOR IMAGERY SIGNALS
This chapter describes basic concepts about motor imagery signal classification and addresses recent studies found in the literature. In this context, firstly, the problems generally encountered while dealing with the motor imagery signals will be briefly described. Then, a general framework regarding motor imagery signal classification will be presented and each processing step of the framework will be studied elaborately.
3.1 Properties of Motor Imagery Signals
According to the literature, it is possible to list the encountered difficulties that cause increasing misclassification rates while working with the motor imagery based brain computer interfaces.
3.1.1 Low spatial resolution
The spatial resolution is directly related with the number of electrodes placed over the head, increasing that gives higher resolution. However, this brings more computational burden and therefore, delayed response of brain computer interface. Besides, using more electrodes makes BCI an unpractical and uncomfortable design. There are some studies in the literature for optimizing the locations and number of placed electrodes to lower the computational load without decreasing the classification performance [89– 92].
A better set of EEG channels with less number of electrodes helps eliminating irrelevant signals with motor imagery or noise so that, increasing the BCI performance while offering a more comfortable BCI experience to the subject. Arvaneh et.al. [89] proposed "sparse common spatial patterns (SCSP)" method for optimizing the channel selection. In the proposed method, they aimed minimal set of electrodes with the constraint of classification performance.
The volume conduction effect defined as the transmission of electric or magnetic fields from an electric primary current source through biological tissue towards measurement sensors [93], causes any electrode to acquire EEG signal variations not only from where it is located, but also from all over inside the head. The literature suggests numerous number of solutions to this problem [89, 91, 92, 94–99]. These methods obtain underlying signal sources by extracting independent components from EEG data.
3.1.2 Variations between subjects and sessions
Imagination of the same movement greatly varies between subjects, even between two sessions at different time for the same subject. The variability of ERD and ERS signal characteristics in spatial, spectral and temporal domains weakens the generalizing capability of the classifier. The same classifier may give high performance for one subject while showing poor performance for another subject. This guides us to the importance of training. In the training period, not only the classifier adapts its weights for the given subjects but also, the subject learns to control his/her ERD and ERS signals properly. It was reported that, classifier performance greatly increases with the training period [95, 100]
3.1.3 A few number of classes
In a motor imagery study, generally the movement intentions of different limbs are considered as different classes since all limbs are represented spatially at different locations in the homunculus given in Figure 2.6. Therefore, it is possible to differentiate each class or limb by eliciting the specific spatial location of the generated activation patterns. This gives the opportunity to be able to design high performance motor imagery brain computer interfaces easily [95]. However, the problem is that the number of classes to be classified is limited with the number of limbs to be imagined. An alternative to increase the number of classes is considering imagery of different types of actions of the same limb for different classes such as several movements of the wrist. However, it will be even harder to achieve classifying with low error since the activation patterns will be generated at the same spatial location.
Another solution to increase the class number may be imagination of different movements simultaneously. Vuckovic and Sepulveda [101] obtained six different classes by combination of four different movement imaginations that are extension / flexion of the wrist and pronation (down) / supination (up) movements of the palm. They reported that the performance of the BCI system was about 80%.
3.1.4 Non-stationary EEG
Non-stationary nature of EEG is another factor in misclassified motor imagery signal. In the literature, there are some methods for reducing the non-stationaries for motor imagery classification. As an example, Samek and his friends proposed "stationary common spatial patterns (sCSP)" method [102] which focuses on stationary components in the EEG signal in order to increase the generalizing capability and classification performance of the classifier.
3.1.5 Inexperienced subjects
In a motor imagery study, generally the subjects are chosen from those who had never attained to a BCI experiment for providing improvement in the objectivity of the results. However, the subjects are inexperienced in the way of imaging the movements that is presented to him/her. They can not easily comprehend imaging a movement likefeelingit. For example, they just imagine a visual scene containing the requested movement. In this case, the BCI acquires EEG signals that are not related with the usual motor imagery activation patterns, which may mislead the training system. Therefore, preceding to the experiment, a training period is needed for proper imaging of a motor action. Feedbacks may be given to the training subject for faster learning. For example, they may receive auditory and/or visual alerts when they succeed to imagine properly [100] .
3.2 A General Framework for Classification of Motor Imagery Signals
A basic diagram regarding classification of a motor imagery EEG signal is presented in Figure 3.1. This framework consists of six processing blocks which are listed as i) motor imagery experiment design block, ii) signal acquisition block, iii) signal preprocessing block, iv) spatial filtering block, v) feature extraction block and vi)
classification block. In the following subsections, all processing blocks of the given framework will be described in details.
IMAGINEGLEF T HANDG MOVEM ENT... SignalGPre-procesing
ChannelGSelection FrequencyGselection ActiveGsegmentGselection
MotorGImageryGExperimentGDesign SignalGAcquisition Classifier FeatureGextraction SpatialGFiltering SignalGProcesing
Figure 3.1: A general flow diagram about motor imagery classification.
3.2.1 Motor imagery experiment design
Imaging of same motor movement varies fairly over different subjects in spatial and spectral domain. Therefore, varying spectral and spatial distributions of ERD and ERS signals make the classifiers generalizing ability to reduce. When using a feature set for a subject gives high classification performance, while the same classifier with the same feature set may fail to give high accuracy. Therefore, it was observed that subject training had been highly important in motor magery classification. Vuvckovic [95] and Hwang [100] reported considerable increased classification accuracy when studying with trained subjects in reference to untrained subjects.
In order to train a subjcet and the classifier with the subject’s training data, an experimental set up is needed. Generally, a visual set up is prepared and presented to the user on the computer screen. The experiment software cues the subject about the movement to be imagined at random intervals while recording brain signals at the background continuously. Not only the brain signal, but also the label (i.e. left hand movement , right hand movement, etc..) and the time index of the presented cue are stored for post processing. As an example, Figure 3.2 illustrates the motor imagery trial from the experiment described in Gouy et.al. [5] . The trial begins with a fixation cross for preparing the subject for the cue to be presented. Next, the cue that indicates the movement to be imagined is shown on the screen for nearly 1 seconds. After the cue, user imagines according to the given cue. However, timing of this period is unclear, it should be in an interval inside the motor imagery period. The trial ends with a break indication on the screen and the subject waits for the next trial. At the end of the motor imagery experiment, numerous trials are recorded so that a rich training set for the classifier is obtained.
Figure 3.2: A trial of a motor imagery experiment.
3.2.2 Motor imagery signal acquisition
In a BCI system, the activity of the brain is measured and then converted to the control commands for the controlled device. There are many techniques for measuring the brain activity such as functional magnetic resonance imaging (FMRI), Magnetoencephalography (MEG), Positron Emission Tomography (PET), Electrocorticogram or electroencephalography (EEG). Among them, EEG is the preferred way of acquiring brain signals because it has short time constants which means shorter reaction time and requires relatively simple and inexpensive equipment [103–105].
When placing the EEG electrodes over subject’s head, generally, standard 10-20 system is used. The 10–20 system or International 10–20 system is an internationally recognized method to describe and apply the location of scalp electrodes in the context of an EEG test or experiment. This system is based on the relationship between the location of an electrode and the underlying area of cerebral cortex. The "10" and "20" refer to the fact that the actual distances between adjacent electrodes are either 10% or 20% of the total front–back or right–left distance of the skull. Figure 3.3, displays standart 10-20 electrode locations with 10% division, based on the guide from American Electroencephalographic Society [106].
Nz CPz Fpz AFz Fz FCz Cz Pz POz Oz Iz Fp1 Fp2 AF3 AF4 AF7 AF8 F7 F5 F3 F1 F2 F4 F6 F8 F9 FT9 FT7 FC5 FC3 FC1 FC2 FC4 FC6 FC8 F10 FT10 A1 T9 T7 C5 C3 C1 C2 C4 C6 T8 T10 A2 TP10 P10 TP8 P8 PO8 O2 PO4 P2 P4 P6 CP2 CP4 CP6 TP9 TP7 CP5 CP3 CP1 P9 P7 P5 P3 P1 PO7 PO3 O1
Figure 3.3: EEG electrode locations acording to the international 10-20 standard. Each site has a letter to identify the lobe and a number to identify the hemisphere location. The letters F, T, C, P and O stand for frontal, temporal, central, parietal, and occipital lobes, respectively. (Note that there exists no central lobe; the "C" letter
is used only for identification purposes.) Even numbers (2,4,6,8) refer to electrode positions on the right hemisphere, whereas odd numbers (1,3,5,7) refer to those on the left hemisphere. A "z" (zero) refers to an electrode placed on the midline. In addition to these combinations, the letter codes A, Pg and Fp identify the earlobes, nasopharyngeal and frontal polar sites respectively.
The amplitude of the EEG is about 100µV when measured on the scalp, and about 1-2 mV when measured on the surface of the brain. The bandwidth of this signal is from under 1 Hz to about 50 Hz, as demonstrated in Figure 3.4 .
10 20 30 40 50 Frequency8(Hz) Relative8 Amplitude 0.58-848Hz 48-888Hz 88-8138Hz 138-8308Hz 7.58-812.58Hz
Figure 3.4: Frequency spectrum of EEG signal.
EEG signal spectrum is partitioned into special frequency bands called alpha (α), beta (β), delta (δ) and theta (θ) waves. The alpha waves have the frequency spectrum of 8-13 Hz and can be measured from the occipital region in an awake person when the eyes are closed. The frequency band of the beta waves is 13-30 Hz; these are detectable over the parietal and frontal lobes. The delta waves have the frequency range
of 0.5-4 Hz and are detectable in infants and sleeping adults. The theta waves have the frequency range of 4-8 Hz and are obtained from children and sleeping adults [107]. Also, mu waves (µ) , also known as sensorimotor rhythms, are synchronized patterns of electrical activity involving large numbers of neurons in the part of the brain that controls voluntary movement. These patterns as measured by electroencephalography (EEG), magnetoencephalography (MEG), or electrocorticography (ECoG), repeat at a frequency of 7.5–12.5 (and primarily 9–11) Hz, and are most prominent when the body is physically at rest [108]. Unlike the alpha wave, which occurs at a similar frequency over the resting visual cortex at the back of the scalp, the mu wave is found over the motor cortex.
3.2.3 EEG data preprocessing
In the preprocessing phase, acquired EEG signal is selected in terms of channels, frequency and time due to wipe out information unrelated with motor imagery. This phase transforms the EEG signal with the help of prior knowledge about motor imagery. Generally, preprocessing phase includes the following items:
3.2.3.1 Channel selection
It is known that, motor cortex is an area of the frontal lobe located in the dorsal precentral gyrus immediately anterior to the central sulcus which corresponds to the area around electrodes C5 through C6 according to the 10-20 electrode standard. Therefore, a motor imagery classification system should mainly use those electrodes. Also, it is a common practice to select a wide area that coarsely cover the motor cortex because of the volume conduction effect which is defined as the transmission of electric or magnetic fields from an electric primary current source through biological tissue towards measurement sensors [93]. For example, Samek et. al. had used a total of 68 EEG electrodes which roughly cover the motor cortex [102].
There are many methods in the literature that apply automatic channel selection methods prior to the classification. Kim et. al. [109] used a binary particle swarm optimization (BPSO) as an optimal channel selection method. Another work submitted by He et.al. [110] suggests genetic algorithm based optimal channel selection method for motor imagey classification. Indeed, channel selection is not a critical issue for


![Figure 3.7 : Volume conduction effect in scalp EEG. [119]](https://thumb-us.123doks.com/thumbv2/123dok_us/391804.2543558/58.892.192.651.103.580/figure-volume-conduction-effect-scalp-eeg.webp)