Evans, Lewis
and
Owda, Majdi
and
Crockett, Keeley
and
Vilas, Anna
(2018)Big Data Fusion Model for Heterogeneous Financial Market Data
(FinDF). In: Intelligent Systems Conference (IntelliSys) 2018, 06 September
2018 - 07 September 2018, London, UK.
Downloaded from:
http://e-space.mmu.ac.uk/619966/
Version:
Accepted Version
Publisher:
Springer
DOI:
https://doi.org/10.1007/978-3-030-01054-6_75
Please cite the published version
1 | P a g e
Big Data Fusion Model for Heterogeneous Financial
Market Data (FinDF)
Lewis Evans, Majdi Owda, Keeley Crockett
School of Computing, Mathematics & Digital TechnologyManchester Metropolitan University M41 5GD UK Manchester, UK
{l.evans, m.owda, k.crockett}@mmu.ac.uk
Ana Fernández Vilas
I&C Lab. AtlantTIC Research CentreUniversity of Vigo. 36310 Pontevedra, Spain [email protected]
Abstract— The dawn of big data has seen the volume, variety,
and velocity of data sources increase dramatically. Enormous amounts of structured, semi-structured and unstructured heterogeneous data can be garnered at a rapid rate, making analysis of such big data a herculean task. This has never been truer for data relating to financial stock markets, the biggest challenge being the 7 Vs of big data which relate to the collection, pre-processing, storage and real-time processing of such huge quantities of disparate data sources. Data fusion techniques have been adopted in a wide number of fields to cope with such vast amounts of heterogeneous data from multiple sources and fuse them together in order to produce a more comprehensive view of the data and its underlying relationships. Research into the fusing of heterogeneous financial data is scant within the literature, with existing work only taking into consideration the fusing of text-based financial documents. The lack of integration between financial stock market data, social media comments, financial discussion board posts and broker agencies means that the benefits of data fusion are not being realised to their full potential. This paper proposes a novel data fusion model, inspired by the data fusion model introduced by the Joint Directors of Laboratories, for the fusing of disparate data sources relating to financial stocks. Data with a diverse set of features from different data sources will supplement each other in order to obtain a Smart Data Layer, which will assist in scenarios such as irregularity detection and prediction of stock prices.
Keywords— Big Data, Data Fusion, Heterogeneous Financial Data
I. INTRODUCTION
The ineluctable growth of heterogeneous financial data sources relating to financial stocks poses a serious challenge to researchers and regulators who attempt to analyse stock market discussions and prices for a variety purposes such as detecting possible irregular behaviour [1][2]. With the advent of social media, financial discussion boards (FDBs), and traditional news media dissemination, investors have an almost endless amount of communication channels to make use of for executing well-informed investments [3]. The analysis of such communication is difficult to undertake, due to the many problems associated with big data within the financial market domain [1][4]. Big data is defined as “data sets with sizes beyond the ability of commonly used software tools to capture, curate, manage, and process data” [4]. There exists a myriad of studies on the Vs of big data, the first instance being the consideration of volume, velocity, and variety [5], since then there have been extensions to the Vs of big data, including the 4Vs[6], 5Vs[7], 7Vs[8], and more recently, a 42V approach to big data has been proposed [9]. For our study on financial stock markets, we adopt the 7Vs
conceptual model of big data (volume, variety, velocity, variability, veracity, value and visualisation), as these seven are clearly distinguishable in the field of financial stock markets [4]. The increasing number of Vs in source data, the more complex the fusion process will be in order to produce Smart Data.
Data fusion has been a well-established practice for managing heterogeneous data sources through the use of associating and combining data sources together [10][11]. Several models proposed for the fusion of data include the model proposed by the Joint Directors of Laboratories (JDL) [12] and the Dasarathy model [13]. These models, however, have been outdated due to their emphasis on specific domains and applications, often needing to be revised and adapted based on the specific fusion task [14].
Limited research has been undertaken on the fusion of financial data sources, in this paper we coin the term FinDF to refer to the fusing of financial data sources. Existing fusion techniques do not consider more than two data sources, and focus on Securities and Exchange Commission (SEC) filings (which are only available for stocks listed on US exchanges such as the NYSE or NASDAQ) along with other text-based document filings [15]. The existing challenges of FinDF lie in the fact that each of these financial data sources have a different origin, their contents will often be distributed over a variety of websites and vary dramatically in terms of their structure and intent. As existing research focuses primarily on integrating textual documents, there is an opportunity to improve upon existing methodologies by establishing data fusion techniques which take into account data sources such as social media comments, financial discussion board posts, broker agency ratings and stock market data.
This paper proposes a novel data fusion model to address the fusion of financial data from multiple source environments, providing a solution for the current
challenges of data association from multiple environments, namely how to fuse such data. The proposed model will approach the fusion task from two dimensions; (1) fusing the different data sources together based on time-slice windows and (2) the company in which the data corresponds to.
This paper is organised as follows: Section II looks at the related work on data fusion, including its use in various fields and how the JDL model has inspired existing fusion tasks. Section III introduces some of the financial data sources which are used by investors to discuss stocks and make investment decisions. Section IV explores the challenges of big data in relation to financial markets, and how the 7 Vs of big data are dominant within the field of financial markets.
2 | P a g e
Section V presents the proposed FinDF model for the fusing of financial data sources. Section VI explores the future work which could be performed as a result of this research, in addition to drawing a conclusion in relation to how the FinDF model addresses some of the challenges of big data within the financial market domain.
II. RELATED WORK A. Data Fusion
Several definitions exist within the literature for the term data fusion. The first definition being coined by Hall and Llinas [16]: “data fusion techniques combine data from multiple sensors, and related information from associated databases, to achieve improved accuracies and more specific inferences that could be achieved by the use of a single sensor alone”.
The terms data fusion and information fusion are often used synonymously; there is, however, a distinction which should be made. The term data fusion is used to refer to fusing raw data (data which is obtained directly from a source with no pre-processing or cleaning being carried out), whereas the term information fusion is used to refer to the fusion of data which is already processed in some way [17]. Regardless of the term used, data and information fusion techniques are used to enhance knowledge discovery [18].
There exist a considerable number of challenges associated with the fusion of data sources, many of these challenges stem from the disparity of how different data is structured [19]. The most notable challenges, outlined by [20], include:
1)Disparate Data
The input data which is provided to a data fusion model will most often be generated by a variety of sources such as humans (e.g. textual comments), APIs (e.g. time-stamped sequential data), scraping (e.g. textual content). Fusion of such heterogeneous data in order to construct a comprehensible and accurate view of the overall picture is a challenging task in itself.
2)Outliers and False data
Noise and impreciseness of data can be found in almost all sources of data. A data fusion algorithm should be able to take measures against outliers which are presented to it and take appropriate action accordingly as part of the fusion process.
3)Data Conflict
Data fusion algorithms must be able to treat conflicting data with great care, being careful not to simply discard it, but to provide a means of cross-checking the data across the different sources.
4)Imperfection of Data
Data will often be affected by some element of impreciseness, a data fusion model should be able to express such imperfections and make a decision such as whether or not to discard such data, or fuse the data and accept the risk of imperfect data fusion.
5)Out of Sequence Data
Data which is inputted into a data fusion model will often be organised in discrete pieces which feature a corresponding timestamp, detailing its time of origin. Undoubtedly, the different input sources may be out of sequence due to varying time-zones in which the data is collected from, including factors such as daylight-saving time.
6) Data Association
Associating multiple entities into groups is the most significant problem of the data fusion process. It can be seen as trying to establish hidden or secret relationships between entities which may not appear to be immediately apparent.
7) Data Collection
As is the case with many web 2.0 technologies, APIs are often provided for the unified collection of data. However, not all sources provide such a convenient way of collecting data, meaning techniques such as web scraping will need to be utilised for data collection.
B. Fields Utilising Data Fusion
Data fusion has been employed successfully in a wide range of domains in order to combine multiple data sources into a unified data output [21].
3 | P a g e
Table 1 Fields Utilising Data Fusion
At this low-level of the fusion model, data is aligned to objects in order to allow statistical estimation, and to permit common data processing [26][28]
lists several fields in which data fusion has been adopted to improve the accuracy of analysing multiple data sources.
The success of data fusion in these domains through the use of fusing different data relating to the same objects for better observations make it an attractive option for combining financial stock market data.
Although work has been undertaken which integrates market data with financial news and work which considers the fusion of documents, this work does not consider the fusion of such a wide variety of disparate data sources such as social media comments, discussion board posts or broker
agency ratings [22][23]. To our knowledge, there has been no work undertaken which considers the fusion of multiple disparate data sources relating to financial stock markets. C. Data Fusion Models
There have been a number of reviews of existing data fusion models and architectures in recent years [17][20]. Existing models include the Intelligence cycle model, Boyd control loop model, Dasarathy model, and the Thompoulos model [24]. Although there have been several proposals of data fusion models over the years, none have become more widely adopted as the JDL model [25], which will now be overviewed in detail.
1) JDL Model
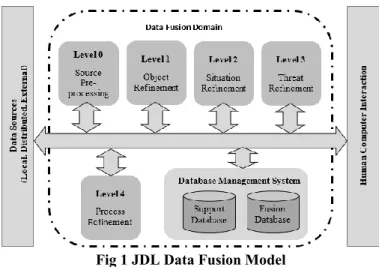
Initially proposed by the U.S Joint Directors of Laboratories (JDL) and the U.S Department of Defense (DoD) in 1985 [24, p. 111], the JDL model is considered the seminal model for data fusion tasks [26]. The JDL model (Fig 1) is comprised of five processing levels, a database management system (DBMS), human interaction, and a data bus which connects all of these components together [27].
a) Level 0 – Source Pre-processing
The lowest layer present in the JDL model involves reducing the volume of the data using data cleaning, addressing missing values, and maintaining useful information for the higher-level processes.
b)Level 1 – Object Refinement
Field Description Refs
Forensics - Network Intrusion Detection Systems (IDS)
Complementing evidence and artifacts from different layers of a computer or devices to create a complete picture of what events occurred during a reactive forensic investigation.
The proposed model (based on the JDL model) can successfully reduce false positive alarms generated by IDS and improve the detection of unknown threats.
[30] Military – Unmanned Aerial Vehicles (UAV)
Detection of threats based on multi-sensor multi-source data fusion. The proposed model (also based on the JDL) aimed to enhance the situation awareness of the UAV (human) operators by providing a model supporting the detection of threats based on different data sources fused together.
[31]
Navigation
Systems Beacons used for navigation systems and emergencies are highly susceptible to noise, frequency shifts and measurement errors.
The adoption of data fusion was able to reduce packet error rate from beacons and sensors from 70% to 4.5%. [32] Track monitoring from multiple in-service trains
Monitoring of a rail-track network to ensure safety of its users and to reduce maintenance costs by early detection of faults.
The proposed model, which fused position data from trains, and track data (vibrations), indicated that fusing data helped in the detection of track changes, resulting in early detection of track faults.
[33]
Geosciences –
Habitat Mapping
Data combined from multiple sources (hyperspectral, aerial photography, and bathymetry data) was utilised for the purposes of mapping and monitoring of the benthic habitat in the Florida Keys.
4 | P a g e
Table 1 Fields Utilising Data Fusion
At this low-level of the fusion model, data is aligned to objects in order to allow statistical estimation, and to permit common data processing [26][28]
.
a) Level 2 – Situation Refinement
This level deals with the relationships between objects and observed events, attempting to provide a contextual description between the relationships [27][29].
b)Level 3 – Threat Refinement
The fusion process of this level attempts to create data for future predictions. The output of which is prediction data which can be stored for further analysis or acted upon [21].
c)Level 4 – Process Refinement
The monitoring of system performance, including handling real time constraints is addressed at this level [29]. This level of the data fusion model does not perform any data processing operations, as it is more focused on identifying information required for data fusion improvement [35][36].
d)Support Database
The support database of the JDL model serves as a data repository in which raw data is stored to facilitate the fusion process. [37]
e)Fusion Database
At the conclusion of the data fusion process, fused data is stored within the fusion database, to be used for future analysis tasks.
2) JDL Model Revisions
The original JDL data fusion model was incepted to provide a process flow for sensor and data fusion [14]. As a result of the JDL model being over thirty years old, it has been revised over the years to address specific data fusion challenges. Despite the popularity of the JDL model, it has been subject to scrutiny due to being tuned primarily for military applications and being too restrictive [20]. Revisions to the JDL model in 1999 by [38], involved a redefined model which attempted to steer away from a model which, at the time, was tailored primarily for military applications, which was the case for many data fusion tasks at that period [39].This revision to the JDL model revolved primarily around redefining the Threat Refinement process; as the concept of “threats” does not exist to such an extent as it does in the military domain. Steinberg, Bowman, and White [38] redefined the Threat Refinement level as Impact Assessment, as impact is considered an umbrella-term which, unlike threat refinement, is not restricted to specific domains.
Further revisions and extensions to the JDL model were proposed in 2004 by [40]. Proposals in this paper involved extending the model to include the previous remarks on issues relating to quality control, reliability, and the consistency in data fusion processing.
III. FINANCIAL DATA SOURCES
Investors have a plethora of information sources when it comes to researching and discussing stock options. The data fusion model we propose will utilise sources from a variety
Field Description Refs
Forensics - Network Intrusion Detection Systems (IDS)
Complementing evidence and artifacts from different layers of a computer or devices to create a complete picture of what events occurred during a reactive forensic investigation.
The proposed model (based on the JDL model) can successfully reduce false positive alarms generated by IDS and improve the detection of unknown threats.
[30] Military – Unmanned Aerial Vehicles (UAV)
Detection of threats based on multi-sensor multi-source data fusion. The proposed model (also based on the JDL) aimed to enhance the situation awareness of the UAV (human) operators by providing a model supporting the detection of threats based on different data sources fused together.
[31]
Navigation
Systems Beacons used for navigation systems and emergencies are highly susceptible to noise, frequency shifts and measurement errors.
The adoption of data fusion was able to reduce packet error rate from beacons and sensors from 70% to 4.5%. [32] Track monitoring from multiple in-service trains
Monitoring of a rail-track network to ensure safety of its users and to reduce maintenance costs by early detection of faults.
The proposed model, which fused position data from trains, and track data (vibrations), indicated that fusing data helped in the detection of track changes, resulting in early detection of track faults.
[33]
Geosciences –
Habitat Mapping
Data combined from multiple sources (hyperspectral, aerial photography, and bathymetry data) was utilised for the purposes of mapping and monitoring of the benthic habitat in the Florida Keys.
[34]
5 | P a g e
of environments. In this section, we will detail the data sources which will be fused by the data fusion model. A. Financial Discussion Boards (FDBs)
During the early 2000s, the emergence of financial discussion boards such as Yahoo! Finance and Raging Bull provided two of the most prominent messaging boards on the internet [41]. FDBs provide an unprecedented opportunity for investors to invest, debate, and exchange information on stocks, often expressing their own individual opinion, and often having no prior social connections to other users [42]. FDBs are often specific to certain stock markets, Interactive Investor [43] and London South East, for example, provide a platform for investors to discuss stocks which float on the London Stock Exchange, offering a separate discussion board for each stock. Existing work undertaken by [44] has utilised this data source for the purpose of highlighting potential irregularities through the use of information extraction (IE). B. Social Media
Boasting over 313 million active users worldwide, Twitter provides for fast dissemination of information [45][46][47]. Twitter has been the subject of several experiments by researchers for its use in discussing financial stocks [48][49][50]. Twitter has recently doubled the character limit of tweets from 140 characters to 280 characters, allowing users to circulate even more information [51].
In 2012, Twitter unveiled a feature named cashtags, a feature initially unique to Stocktwits [52], which allowed for clickable hyperlinks to be embedded in tweets, similar to the behaviour of hashtags [49]. These cashtag entities are structured to mimic the TIDM (Tradable Instrument Display Mnemonic) of a company, prefixed with the $ symbol (e.g. $VOD for Vodafone).
One of the nuances of the cashtag feature involves a phenomenon which has not yet been explored within the literature, which we refer to as “cashtag collision” [49]. This occurs when two companies with identical TIDM identifiers (e.g. $TSCO) appear on multiple exchanges across the world, yet Twitter is unable to clearly distinguish between them, so the discussions of both are merged into a singular search feed. Other notable sources of information relating to financial stocks include the likes of Reddit, which have several subreddits for the purpose of discussing stock options for stocks all over the world.
C. Broker Agencies
Brokers are agents which trade on behalf of their clients, and often provide their clients and the rest of the financial market community with advice on investment decisions [53]. Companies such as London South East aggregate broker ratings from a wide collection of reputable broker agencies such as JP Morgan and Barclays [54].
D. News Corporations
Many investors still rely on information provided by news corporations which monitor the financial market world. The Financial Times, for example, is often regarded as a reputable source of financial market news within the UK due to the well-regarded journalists associated with it [55].
E. Stock Market Data
Researchers and investors often rely on timely intraday stock market data such as those provided by Google Finance and Yahoo Finance APIs, however, since mid-2017, the Google Finance and Yahoo Finance APIs are no longer active [56]. Financial stock market data can be obtained from the Time Series Data API hosted by AlphaVantage [57].
AlphaVantage offers free intraday and historic stock market data from 24 exchanges around the world, providing real-time stock market data from time intervals ranging from one minute to sixty minutes.
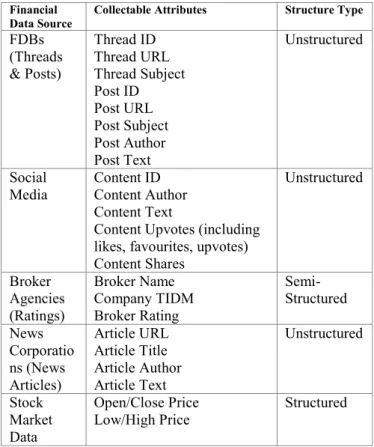
The core collectable attributes of these data sources, along with their structure type, are listed in Table 2. All of the financial data sources possess an attribute corresponding to the date and time the source was created, and have been omitted from the table for clarity. The time of each of these data sources is one of the two dimensions in which these sources will later be fused together, the other being the company name in which different pre-processing techniques will be required depending on the data source.
Table 2 Collectable Attributes of Financial Data Sources
IV. BIG DATA CHALLENGES IN RELATION TO FINANCIAL MARKET DATA
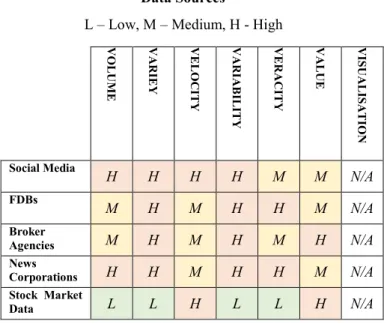
The 7 Vs of big data are abundant in the financial market domain, this section will now go into detail as to the prevalence of each of these Vs, which are summarised in Table 3.
A. Volume
The amount of data pertaining to financial stocks is vast in nature. Discussions relating to stocks is not just confined to financial discussion boards, but flows into other environments such as Twitter, Reddit, and mainstream
Financial Data Source
Collectable Attributes Structure Type
FDBs (Threads & Posts) Thread ID Thread URL Thread Subject Post ID Post URL Post Subject Post Author Post Text Unstructured Social
Media Content ID Content Author Content Text
Content Upvotes (including likes, favourites, upvotes) Content Shares Unstructured Broker Agencies (Ratings) Broker Name Company TIDM Broker Rating Semi-Structured News Corporatio ns (News Articles) Article URL Article Title Article Author Article Text Unstructured Stock Market Data Open/Close Price
6 | P a g e
media, making the volume of data to analyse a gargantuan task.
The popularity of Twitter alone for discussing stocks can result in thousands of tweets relating to certain stocks being generated every day. Events such as dividend announcements [58] can exacerbate this further, causing a surge of activity in the social media domain [59].
Table 3 Prevalence of the 7 Big Data Vs within Financial Data Sources
B. Variety
The variety of data sources intensifies the big data problem present in the financial world. Social media platforms, FDBs, broker agencies, news websites – all of these communication channels have a dramatically different structure which fall into one of the three recognised categories; structured, semi-structured and unstructured [60][61]. This is one the biggest challenges of the data fusion process – how can such differently structured forms of data be fused together without sacrificing the quality of said data sources?
C. Velocity
The speed in which financial data is transmitted is extraordinary in itself, minutely stock price data for multiple exchanges is available for free from sources such as AlphaVantage [57][62]. Real-time analysis of such high velocity data present within sources such as Twitter and live intraday stock data is not a trivial task [4].
Further exacerbating the velocity of financial data, emerging technologies such as High-Frequency Trading (HFT) involves the use of sophisticated computing algorithms which submit and cancel orders rapidly, giving the illusion of liquidity [63]. This can further exacerbate the velocity aspect of big data in financial markets.
D. Variability
The combination of unstructured, semi-structured and structured data within the financial market community is rife. Real-time data feeds of stock prices, articles published by the Regulatory News Service (RNS), social media, Corporate news websites and mainstream media provide just a taste of the huge variety of data sources which are readily available for investors to digest [64]
E. Veracity
Missing data, noise, abnormalities – all the characteristics of veracious data can easily be found within financial data sources. News articles published by news corporations are a prime example of this, different corporations structure their articles in varying layouts which make use of various metadata, with some news websites including tags to associate the article with a specific company or industry. The non-uniform nature of articles and their associated structure leads to data which cannot be compared directly.
F. Value
The most sought-after V in big data is its value [65]. This V is the main objective when collecting such vast amounts of data, finding relationships, whether they be explicit or hidden in order to unveil the true value of such data [66].
G. Visualisation
Visualisation of disparate data is incredibly difficult to accomplish due the large number of features present in big data sets [67]. It is often regarded as the end goal of big data, after the challenges such as veracity have been tackled.
V. PROPOSED DATA FUSION MODEL
Although many of the financial data sources do not possess a high amount of value for analysis value within isolation, when combined with other financial data sources they can provide valuable new insights into the behaviour and intent of investors.
Our proposed data fusion model Fig 2() draws upon the underlying principles of the JDL model, defining key levels which deal with specific tasks within the data fusion process. The proposed model will fuse together the different financial data sources (outlined in section III), which are collected using the techniques summarised in Table 4.
Table 4 Collection Techniques for Financial Data Sources
A. Level 1 – Feature Extraction
Not all of the data available from each of the financial data sources will have value as a result of being fused. The
V OLUM E V A R IE Y V E L OC IT Y V A R IA B IL IT Y V E R A C IT Y V A L U E V IS U A L IS A T ION Social Media H H H H M M N/A FDBs M H M H H M N/A Broker Agencies M H M H M H N/A News Corporations H H M H H M N/A Stock Market Data L L H L L H N/A Financial Data
Source Collection Technique Libraries / APIs
FDBs (Threads & Posts)
Web Scraping BeautifulSoup [68], Scrapy [69], Selenium [70]
Social Media APIs Twitter – Tweepy [71],
Reddit – PRAW [72] Broker
Agencies (Ratings)
Web Scraping BeautifulSoup, Scrapy, Selenium News
Corporations (News Articles)
Web Scraping BeautifulSoup, Scrapy, Selenium Stock
Market Data
APIs AlphaVantage [62] L – Low, M – Medium, H - High
7 | P a g e
first level will therefore select the most appropriate features from the data sources.
B. Level 2 – Source Pre-processing
Many revised JDL models will list source pre-processing but not attribute a level to such a crucial process; other data fusion models will simply label it as a pre-requisite – where the data is cleaned before it is even considered for fusion. The model we propose clearly defines a source pre-processing level which deals with the common pre-processing tasks; data cleaning, normalisation, transformation, missing values imputation, outliers and noise identifications [73].
C. Level 3 – Conflict Resolution / Company Identification As a result of all stock exchanges around the world referring to companies using different ticker/TIDM
symbols, such collisions which occur will attempt to be addressed before the fusion process can continue. An example of conflict resolution includes identifying and associating a company
A large part of this task involves identifying the company which is being referred to within the data source, this will be a common occurrence when analysing global tweets from Twitter analysing news articles which refer to companies by their name as opposed to their TIDM.
D. Level 4 – Time-Stamp Refinement
Timestamps are the determinant feature in which disparate data can be associated. Data which does not have a timestamp associated with it cannot easily be fused with other data sources [32]. This level will address inconsistent time-stamps across the different data sources, attempting to unify the data based on pre-existing time-stamps. Nuances such as daylight-saving time and time-zone differences across the different sources will also be conducted at this level. E. Level 5 – Document Consolidation / Fusing
After the data has gone through a vigorous cleaning process and the timestamps have been aligned across the data
sources, the fusion process can then continue with storing the fused data within the document-oriented fusion database. The fusing of this data is performed in accordance with pre-determined time-slice windows (for example, 15-minute intervals), and the company TIDM (ticker symbol).
F. Data Warehouse
The data warehouse houses the raw data, which has yet to be processed by the different layers of the fusion model. Our proposed fusion model uses a conventional RDBMS for data warehousing purposes, PostgreSQL [74].
G. Fusion Database
After the final fusion level has been undertaken, fused data is stored in a document-oriented fashion, allowing the fused data to be stored in a document-oriented NoSQL structure such as that supported by MongoDB [75].
VI. DISCUSSION
This paper has proposed a novel data fusion model for fusing together heterogeneous data from different financial data sources. The proposed model adapted the heavily-employed JDL data fusion model for the purposes of financial data fusion.
The proposed FinDF model attempts to address the challenges of working with big data within the confines of financial markets. Associating different data sources by time and company will be a challenging process when taking into consideration each of the 7 Vs of big data.
In terms of the original 3Vs (volume, variety and velocity), the fusion model will associate voluminous amounts of disparate data which is being generated at a rapid rate. Taking into consideration 2 of the other Vs (variability and veracity), these are present in the data sources in varying levels, web scraping techniques will allow us to collect data from a variety of websites, which will often be veracious in nature due to the different structure of discussion boards and other communicative websites. The last 2 Vs (value and Fig 2 Proposed Financial Data Fusion (FinDF) Model
8 | P a g e
visualisation) come after the fusion process have occurred. Although it can be argued that every data source has some inherent value in isolation, the outcome of the fusion process will allow the value to be truly apparent through the use of identifying hidden relationships between the different data sources.
Identifying the name of a company within the different data sources is also a substantial challenge which can be addressed through Natural Language Processing (NLP) techniques. The problems of cashtag collisions on Twitter could also mean that previous work undertaken could have been susceptible to incorrect analysis. HFT is also an area which requires special attention when it comes to the analysis of stock movements, such high velocity activity can make the analysis of stock market movements challenging to undertake.
The data fusion model presented in this paper will be used in the future as part of a larger multi-layered ecosystem for the monitoring of potentially irregular comments pertaining to financial stocks. This ecosystem will monitor a variety of discussion channels used by investors, in addition to news sources and utilise the data fusion model in order to amalgamate the different sources of stock information and stock prices.
To our knowledge, this is the first conceptualised model for the fusing of heterogeneous financial data sources.
REFERENCES
[1] M. D. Flood, H. V. Jagadish, and L. Raschid, “Big data challenges and opportunities in financial stability monitoring,” in Financial Stability Review 20, 2016.
[2] E. W. T. Ngai, A. Gunasekaran, S. F. Wamba, S. Akter, and R. Dubey, “Big data analytics in electronic markets,” Electron. Mark., vol. 27, no. 3, pp. 243–245, 2017.
[3] L. Alexander, S. R. Das, Z. Ives, H. V. Jagadish, and C. Monteleoni, “Research Challenges in Financial Data Modeling and Analysis,” 2017.
[4] J. J. J. M. Seddon and W. L. Currie, “A model for unpacking big data analytics in high-frequency trading,” J. Bus. Res., vol. 70, pp. 300–307, 2017.
[5] D. Laney, “Application Delivery Strategies.” 2001.
[6] C. L. P. Chen and C.-Y. Zhang, “Data-intensive applications, challenges, techniques and technologies: A survey on Big Data,” Inf. Sci. (Ny)., vol. 275, pp. 314–347, 2014.
[7] G. Bello-Orgaz, J. J. Jung, and D. Camacho, “Social big data: Recent achievements and new challenges,” Inf. Fusion, vol. 28, pp. 45–59, 2016.
[8] I. Emmanuel and C. Stanier, “Defining Big Data,” in Proceedings of the International Conference on Big Data and Advanced Wireless Technologies - BDAW ’16, 2016, pp. 1–6.
[9] Tom Shafer, “The 42 V’s of Big Data and Data Science,” 2017. [Online]. Available: https://www.kdnuggets.com/2017/04/42-vs-big-data-data-science.html. [Accessed: 03-Nov-2017].
[10] J. Bleiholder and F. Naumann, “Data fusion,” ACM Comput. Surv., vol. 41, no. 1, pp. 1–41, 2008.
[11] M. M. Alyannezhadi, A. A. Pouyan, and V. Abolghasemi, “An efficient algorithm for multisensory data fusion under uncertainty condition,” J. Electr. Syst. Inf. Technol., vol. 4, no. 1, pp. 269–278, 2017.
[12] M. Välja, M. Korman, R. Lagerström, U. Franke, and M. Ekstedt, “Automated Architecture Modeling for Enterprise Technology Management Using Principles from Data Fusion : A Security Analysis Case,” in Proceedings of PICMET ’16: Technology Management for Social Innovation, 2016, pp. 14–22.
[13] V. Borges, “Survey of context information fusion for ubiquitous Internet-of-Things (IoT) systems,” Open Comput. Sci., vol. 6, no. 1, pp. 64–78, 2016.
[14] E. Blasch et al., “Revisiting the JDL model for information exploitation,” Proc. 16th Int. Conf. Inf. Fusion, FUSION 2013, pp. 129–136, 2013.
[15] D. Burdick et al., “Extracting, Linking and Integrating Data from
Public Sources: A Financial Case Study.,” IEEE Data Eng. …, pp. 1–8, 2015.
[16] D. L. Hall and J. Llinas, “An introduction to multisensor data fusion,” Proc. IEEE, vol. 85, no. 1, pp. 6–23, 1997.
[17] F. Castanedo, “A review of data fusion techniques,” ScientificWorldJournal, vol. 2013, 2013.
[18] E. Acar, M. A. Rasmussen, F. Savorani, T. Næs, and R. Bro, “Understanding data fusion within the framework of coupled matrix and tensor factorizations,” Chemom. Intell. Lab. Syst., vol. 129, pp. 53–63, 2013.
[19] K. Golmohammadi, O. R. Zaiane, S. Golmohammadi, K. Golmohammadi, and O. R. Zaiane, “Time series contextual anomaly detection for detecting market manipulation in stock market,” 2015.
[20] B. Khaleghi, A. Khamis, F. O. Karray, and S. N. Razavi, “Multisensor data fusion: A review of the state-of-the-art,” Inf. Fusion, vol. 14, no. 1, pp. 28–44, 2013.
[21] L. C. Andersen, “Data-driven Approach to Information Sharing using Data Fusion and Machine Learning,” Norwegian University of Science and Technology, 2016.
[22] T. Geva and J. Zahavi, “Predicting Intraday Stock Returns by Integrating Market Data and Financial News Reports Predicting Intraday Stock Returns by Integrating Market Data and Financial News Reports,” in Mediterranean Conference on Information Systems, 2010.
[23] T. Geva and J. Zahavi, “Empirical evaluation of an automated intraday stock recommendation system incorporating both market data and textual news,” Decis. Support Syst., vol. 57, pp. 212–223, 2014.
[24] A. D. Mora, A. J. Falcão, L. Miranda, R. A. Ribeiro, and J. M. Fonseca, Multisensor Data Fusion. 2016.
[25] M. Bevilacqua, A. Tsourdos, A. Starr, and I. Durazo-Cardenas, “Data Fusion Strategy for Precise Vehicle Location for Intelligent Self-Aware Maintenance Systems,” in 2015 6th International Conference on Intelligent Systems, Modelling and Simulation, 2015.
[26] D. Mcdaniel, “An Information Fusion Framework for Data Integration,” in Information Fusion Application to Data Integration, 2001, no. 858.
[27] A. Abdelgawad and M. Bayoumi, “Data Fusion in WSN,” in Resource-Aware Data Fusion Algorithms for Wireless Sensor Networks, vol. 118, 2012.
[28] L. Snidaro, J. García, and J. Llinas, “Context-based Information Fusion: A survey and discussion,” Inf. Fusion, vol. 25, pp. 16–31, 2015.
[29] B. Chandrasekaran, S. Gangadhar, and J. M. Conrad, “A survey of multisensor fusion techniques, architectures and methodologies,” in Conference Proceedings - IEEE SOUTHEASTCON, 2017. [30] C. V Hallstensen, “Multisensor Fusion for Intrusion Detection and
Situational Awareness,” Norwegian University of Science and Technology, 2017.
[31] P. Bouvry et al., “Using Heterogeneous Multilevel Swarms of UAVs and High-Level Data Fusion to Support Situation Management in Surveillance Scenarios,” in International Conference on Multisensor Fusion and Integration for Intelligent Systems, 2016, pp. 424–429.
[32] A. Traub-Ens, J. Bordoy, J. Wendeberg, L. M. Reindl, and C. Schindelhauer, “Data Fusion of Time Stamps and Transmitted Data for Unsynchronized Beacons,” IEEE Sens. J., vol. 15, no. 10, pp. 5946–5953, 2015.
[33] G. Lederman, S. Chen, J. H. Garrett, J. Kovačević, H. Y. Noh, and J. Bielak, “A data fusion approach for track monitoring from multiple in-service trains,” Mech. Syst. Signal Process., vol. 95, pp. 363–379, 2017.
[34] C. Zhang, “Applying data fusion techniques for benthic habitat mapping and monitoring in a coral reef ecosystem,” ISPRS J. Photogramm. Remote Sens., vol. 104, pp. 213–223, 2015. [35] J. R. (Jitendra R. . Raol, Multi-sensor data fusion with MATLAB.
CRC Press, 2010.
[36] W. Elmenreich, “An Introduction to Sensor Fusion,” 2002. [37] M. A. Solano and G. Jernigan, “Enterprise data architecture
principles for High-Level Multi-Int fusion: A pragmatic guide for implementing a heterogeneous data exploitation framework,” in Information Fusion (FUSION), 2012, pp. 867–874.
[38] A. N. Steinberg, C. L. Bowman, and F. E. White, “Revisions to the JDL data fusion model,” Proc. SPIE, vol. 3719, no. 1, pp. 430– 441, 1999.
9 | P a g e
Exploitation of Remote Sensing Images,” Fusion Earth Data, Int. Conf., no. January, pp. 17–23, 1998.
[40] J. Llinas, C. Bowman, G. Rogova, and A. Steinberg, “Revisiting the JDL data fusion model II,” Sp. Nav. Warf. Syst. Command, vol. 1, no. 7, pp. 1–14, 2004.
[41] Antweiler, Werner, Frank, and M. Z., “Is All That Talk Just Noise? The Information Content of Internet Stock Message Boards,” J. Finance, vol. 59, no. 3, pp. 1259–1294, 2004.
[42] H. M. Chen, “Group Polarization in Virtual Communities : The Case of Stock Message Boards,” Sch. Libr. Inf. Sci., no. 1994, pp. 185–195, 2013.
[43] F. Sun, A. Belatreche, S. Coleman, T. M. Mcginnity, and Y. Li, “Pre-processing Online Financial Text for Sentiment Classification: A Natural Language Processing Approach,” in Computational Intelligence for Financial Engineering & Economics (CIFEr), 2014.
[44] M. Owda, K. Crockett, and Pie Lee, “Financial Discussion Boards Irregularities Detection System (FDBs-IDS) using Information Extraction,” in Intelligent Systems, 2017, no. September, pp. 8–12. [45] M. Mirbabaie, S. Stieglitz, and M. Ruiz Eiro, “#IronyOff – Understanding the Usage of Irony on Twitter during a Corporate Crisis.,” Proc. Pacific Asia Conf. Inf. Syst. 2017, no. July, 2017. [46] M. Zappavigna, The discourse of Twitter and social media.
Continuum International Pub. Group, 2012.
[47] L. Cazzoli, R. Sharma, M. Treccani, and F. Lillo, “A Large Scale Study to Understand the Relation between Twitter and Financial Market,” in 2016 Third European Network Intelligence Conference (ENIC), 2016, pp. 98–105.
[48] A. Tafti, R. Zotti, and W. Jank, “Real-time diffusion of information on twitter and the financial markets,” PLoS One, vol. 11, no. 8, pp. 1–16, 2016.
[49] A. F. Vilas, L. Evans, M. Owda, R. P. D. Redondo, and K. Crockett, “Experiment for analysing the impact of financial events on Twitter,” in Algorithms and Architectures for Parallel Processing, 2017.
[50] H. Kwuan, “Twitter Cashtags and Sentiment Analysis in Predicting Stock Price Movements,” 2017.
[51] A. Rosen, “Tweeting Made Easier,” 2017. [Online]. Available: https://blog.twitter.com/official/en_us/topics/product/2017/tweeti ngmadeeasier.html. [Accessed: 08-Nov-2017].
[52] Q. Li, S. Shah, A. Nourbakhsh, R. Fang, and X. Liu, “funSentiment at SemEval-2017 Task 5: Fine-Grained Sentiment Anal- ysis on Financial Microblogs Using Word Vectors Built from StockTwits and Twitter,” pp. 852–856, 2017.
[53] L. Harris, Trading and Exchanges: Market Microstructure for Practitioners, vol. 60, no. 4. Oxford University Press, 2002. [54] London South East, “Broker Ratings,” 2017. [Online]. Available:
http://www.lse.co.uk/broker-tips.asp. [Accessed: 28-Oct-2017]. [55] P. Manning, “Financial journalism, news sources and the banking
crisis,” Journalism, vol. 14, no. 2, pp. 173–189, 2013.
[56] G. Avalon, M. Becich, V. Cao, I. Jeon, S. Misra, and L. Puzon, “Multi-factor Statistical Arbitrage Model,” 2017.
[57] A. Elliot, C. H. Hsu, and J. Slodoba, “Time Series Prediction : Predicting Stock Price,” no. 2, 2017.
[58] D. H. Boylan, “The innovative use of Twitter technology by bank leadership to enhance shareholder value,” Purdue University, 2016.
[59] W. Wei, Y. Mao, and B. Wang, “Twitter volume spikes and stock options pricing,” Comput. Commun., vol. 73, pp. 271–281, 2016. [60] K. Golmohammadi and O. R. Zaiane, “Data Mining Applications
for Fraud Detection in Securities Market,” Eur. Intell. Secur. Informatics Conf., pp. 107–114, 2012.
[61] S. Sagiroglu and D. Sinanc, “Big data: A review,” 2013 Int. Conf. Collab. Technol. Syst., pp. 42–47, 2013.
[62] A. Vantage, “Alpha Vantage API Documentation,” 2017.
[Online]. Available:
https://www.alphavantage.co/documentation/. [Accessed: 25-Oct-2017].
[63] M. A. Goldstein, P. Kumar, and F. C. Graves, “Computerized and high-frequency trading,” Financ. Rev., vol. 49, no. 2, pp. 177–202, 2014.
[64] S. S. Shenoy and C. K. Hebbar, “Stock Market Reforms – A Comparative study between Indian Stock Exchanges & Select Exchanges Abroad,” Int. J. Sci. Res. Technol., vol. 1, no. 1, pp. 38– 45, 2015.
[65] T. H. Duong, H. Q. Nguyen, and G. S. Jo, “Smart Data: Where the Big Data Meets the Semantics,” Comput. Intell. Neurosci., vol. 2, 2017.
[66] M. M. Fouad, N. E. Oweis, T. Gaber, M. Ahmed, and V. Snasel, “Data Mining and Fusion Techniques for WSNs as a Source of the Big Data,” Procedia Comput. Sci., vol. 65, no. Iccmit, pp. 778– 786, 2015.
[67] K. Grolinger et al., “Challenges for MapReduce in Big Data,” in Electrical and Computer Engineering Publications, 2014. [68] Leonard Richardson, “Beautiful Soup,” 2017. [Online]. Available:
https://www.crummy.com/software/BeautifulSoup/. [Accessed: 17-Nov-2017].
[69] Scrapy.com, “Scrapy | A Fast and Powerful Scraping and Web Crawling Framework,” 2017. [Online]. Available: https://scrapy.org/. [Accessed: 17-Nov-2017].
[70] “Selenium - Web Browser Automation,” 2017. [Online]. Available: http://www.seleniumhq.org/. [Accessed: 17-Nov-2017].
[71] Tweepy.com, “Tweepy | An easy-to-use Python library for accessing the Twitter API,” 2017. [Online]. Available: http://www.tweepy.org/. [Accessed: 17-Nov-2017].
[72] Bryce Boe, “PRAW: The Python Reddit API Wrapper,” 2017. [Online]. Available: https://praw.readthedocs.io/en/latest/. [Accessed: 20-Nov-2017].
[73] S. García, S. Ramírez-Gallego, J. Luengo, J. M. Benítez, and F. Herrera, “Big Data Analytics Big data preprocessing: methods and prospects,” Big Data Anal., vol. 1, no. 9, 2016.
[74] S. Chen and Songting, “Cheetah: a high performance, custom data warehouse on top of MapReduce,” Proc. VLDB Endow., vol. 3, no. 1–2, pp. 1459–1468, Sep. 2010.
[75] A. Boicea, F. Radulescu, and L. I. Agapin, “MongoDB vs Oracle - Database comparison,” Proc. - 3rd Int. Conf. Emerg. Intell. Data Web Technol. EIDWT 2012, no. September 2012, pp. 330–335, 2012.