Analysing Comparative Soft Biometrics from Crowdsourced
Annotations
Daniel Martinho-Corbishley, Mark S. Nixon, John N. Carter
School of Electronics and Computer Science, University of Southampton, UK
{dmc, msn, jnc}@ecs.soton.ac.uk
Abstract:Soft biometrics enable human description and identification from low quality surveil-lance footage. This paper premises the design, collection and analysis of a novel crowdsourced dataset of comparative soft biometric body annotations, obtained from a richly diverse set of hu-man annotators. We annotate 100 subject images to provide a coherent, in-depth appraisal of the collected annotations and inferred relative labels. The dataset includes gender as a comparative trait and we find that comparative labels characteristically contain additional discriminative infor-mation over traditional categorical annotations. Using our pragmatic dataset, we perform semantic recognition by inferring relative biometric signatures using a RankSVM algorithm. This demon-strates a practical scenario, reproducing responses from a video surveillance operator searching for an individual. The approach can reliably return the correct match in the the top 7% of results with 10 comparisons, or top 13% of results using just 5 sets of subject comparisons.
1. Introduction
Biometrics are distinguishing and identifying human features, providing information with which to perform automatic human recognition [17]. However, using traditional biometrics to perform pedestrian identification from video surveillance footage is still a largely unsolved topic. Retriev-ing identity cues from a limited number of low quality images proves challengRetriev-ing when applied in unconstrained environments at-a-distance. Due to these constraints, commonhardbiometrics like face, fingerprint or gait are often partially hidden or unobservable.
Soft biometrics are a new form of biometric that fill in these information gaps, as they rely only on human perception and description to systematically label subjects [30, 5]. They have been shown to be objective, salient, reliable and robust to changes in distance [39, 36]. The power of soft biometrics lies in their ability to bridge the semantic gap between high-level human description and low-level biometric features generated from images [36]. This opens up a considerable number of opportunities, such as Content Based Image Retrieval (CBIR) and human accessible search queries based only on verbal descriptions. Such methods would alleviate the enormous difficulties of conventional monitoring systems, when forensic investigations require human operators to comb vast archives of recorded material.
This paper investigates the potential of comparative soft biometrics for human description. Specifically, usingglobalandbodysoft biometric traits, discernible in low quality CCTV footage through crowdsourced annotations. Crowdsourcing enables the collection of data from globally diverse annotators and simulates a typical video surveillance scenario, by reproducing a varied range of responses. From these annotations, precise relative subject signatures are inferred using a
RankSVM algorithm, to facilitate accurate semantic recognition.
We describe 100 subject images captured in a synthetic environment [38], similar to [37, 36, 39, 6]. This enables a coherent appraisal of the value in crowdsourcing such novel annotations and a comparison of recognition performance to [37, 36] who use similar image sets. We show the effectiveness of the crowdsourcing task and suitability of the soft biometric traits by analysing the distributions of collected annotations and stability of inferred relative measurements. From this we discern the degree of subjectivity, confusion and discrepancy of each soft biometric trait when viewed in an exemplary scenario. Furthermore, to ascertain their correspondence to tradi-tional methods, comparative annotation characteristics are differentiated against categorical anno-tations collected by Samangooei et al. [37]. Lastly, a semantic recognition experiment evaluates the discriminative properties of the inferred relative soft biometrics labels and is contrasted to two previous studies in categorical [37] and comparative [36] soft biometric annotation.
By combining several forms of analysis, we present a comprehensive understanding of compar-ative soft biometrics and their application potential for subject identification. As a result, this study can guide future work in automatically predicting comparative and relative labels using computer vision and machine learning techniques.
Our main contributions are as follows:
• Providing a comprehensive, public dataset1 of 59400 unique crowdsourced comparative hu-man annotations detailing 100 subjects through 12 global soft biometric traits.
• Providing insight into a crowdsourcing methodology and lexicon design that collected gen-uine human responses to form high quality annotations.
• Analysing the comparative annotation distributions and uncertainties, inferred relative mea-surement stabilities and saliences, and differentiation to categorical annotations.
• Demonstrating semantic recognition in a surveillance scenario, modelling the search queries of a surveillance operative using only a limited number of comparative judgments.
The paper is organised as follows: Section 2 explores related literature. Section 3 describes the image dataset used for annotation. Section 4 details the crowdsourcing task design and analyses the response distributions. Section 5 explains and analyses the ranking inference process. Sec-tion 6 investigates the correspondence between inferred relative labels and categorical annotaSec-tions. Section 7 describes and analyses the relative semantic recognition experiment. Finally, Section 8 reiterates our findings.
2. Related work
2.1. Soft biometrics
Soft biometrics aims to enable subject identification from physiological semantic attributes and spans a number of disciplines, including; traditional biometric identification [37, 36], forensic investigation [24, 40], human psychology [19, 22] and pedestrian re-identification [41, 2, 46].
Two recent surveys explore the field in detail, reviewing techniques for demographic estimation from face, body, clothing and other modalities such as gait, fingerprint and iris [30, 5]. Nixon et al. discuss the evolution of soft biometrics from the original Bertillonage, to the search for
discriminative measures and their estimation from surveillance imagery. The survey defines the area as“the estimation or use of personal characteristics describable by humans that can be used to aid or effect person recognition” [30]. Dantcheva et al. introduce a taxonomy for organising soft biometrics attributes and highlight the benefits of soft biometrics as a human understandable interpretation for video surveillance, providing robustness to low quality images and consent-free acquisition [5].
A large number of previous studies focus on biometric fusion techniques to perform identi-fication, by combiningancillary soft biometric information with traditionalhard biometricslike gait [1, 37, 36], face [39, 32] or fingerprints [15, 16]. However, subjects must first be enrolled into the system in order to match a known hard biometric, which is often unobservable or occluded in real-world CCTV images, presenting a serious limitation for practical application.
Reliance on soft biometrics means subjects need not be pre-enrolled in a system, as identifica-tion is performed through human descripidentifica-tion alone. This is a compelling premise for our work; to investigate the power of standalone soft biometrics in performing identification, showing they pro-vide more than just subsidiary information. We focus on describingglobalandbodytraits due to their permanence, view-point invariance, visibility at-a-distance [39] and enhanced measurement discriminability [23] over the face. Furthermore, Kuehn discovers global and body features were mentioned over 70% of the time in eyewitness testimony [19] and MacLeod et al. identifies the 13 most reliable whole body descriptors [24].
2.2. Comparative measurements
Soft biometrics originally described subjects in anabsolutesemantic space, usingcategorical la-bels[37, 6, 35]. More recent works move towards the use of comparative measurements, able to predictrelativeattribute strengths of faces and natural scenes [31] and texture [26].
Reid et al. presents a psychologically grounded justification for using comparative soft bio-metric descriptors from the body and performs accurate retrieval of subjects using the Elo rating system [36]. The study reveals that comparative labels are more objective than absolute measures, that are also known to be unreliably estimated in eyewitness testimonies [27, 11, 42]. Importantly, Reid demonstrates how continuous relative measurements can be inferred using a limited number of subject-to-subject comparisons. We further this work, by analysing soft trait label distributions, the affect of varying numbers of comparisons on inferred measurements and their correspondence to categorical labels. Jaha et al. also augments these body annotations with soft clothing biomet-rics, enhancing recognition performance [14].
2.3. Pedestrian re-identification
Another area to receive much attention is pedestrian re-identification; matching individuals across multi-camera networks. Earlier approaches deal with low-level, appearance-based matching meth-ods in the visual space [43, 10, 34]. Layne et al. first introduces semantic attribute-based re-identification [20] and An et al. improves upon traditional re-re-identification with soft biometric based reranking [2].
There has since been a growing trend to solve re-identification using human describable at-tributes. Most studies use binary or multi-class mid-level and high-level semantic attributes when annotating large-scale datasets [45, 7], some of which discuss zero-shot identification [31, 21]. Vezzani et al. also illustrate how measuring a biometric profile enables both re-identification and biometric recognition [40], while Wang et al. argue for using semantic attributes for identification
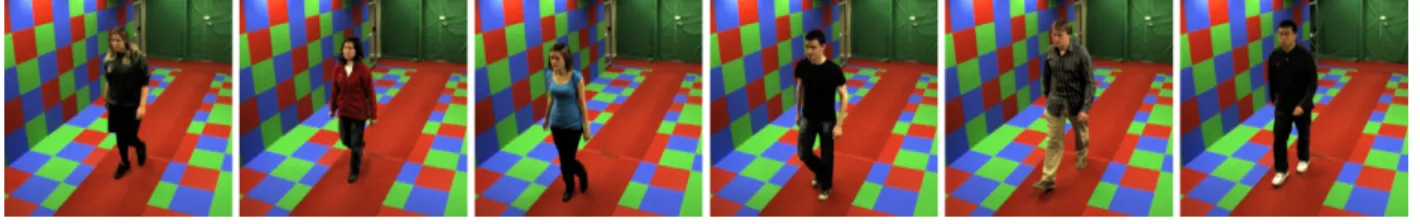
Fig. 1. Example subject images for comparative annotation.
due to their viewpoint independence, robustness and capacity for human interpretation [41]. Further approaches extract global and body soft biometrics from multi-camera environments [28], depth images [25], or most recently, by applying state-of-the-art Convolutional Neural Net-works to still images [46, 33]. Combining several soft biometrics modalities, especially cloth-ing, has proven important in improving subject recognition rates [3, 14] and can be estimated for surveillance tracking and search [9, 44].
2.4. Summary
It has also been shown that traits likegender[29, 4, 12],heightandcolour[8] and demographics likeageandrace[13] can be automatically estimated successfully from body images. In summary, the question is notif, buthowsuch semantic information can be discerned and utilised. By better understanding the discriminative characteristics of comparative labelling we can inform future work in soft biometric estimation, subject identification and pedestrian re-identification.
3. Multi-biometric tunnel dataset
For the crowdsourcing annotation task, we extract a gender balanced dataset consisting of 50 female and 50 male subjects. Images are aligned to a similar position along the tunnel, via a single forward-facing camera and cropped to equal size, as seen in Figure 1. The dataset is captured in an idealised environment and records up to 12 camera viewpoints at the same time, allowing future extensions of this work to investigate view-invariant approaches to automatic soft biometric retrieval and semantic re-identification.
By starting with a smaller dataset containing relatively low quality, but discernible images, we are able to coherently appraise our novel approach, while mitigating more severe occlusion issues due to pose and illumination. The chosen dataset also allows direct comparison to [37, 36] who collected annotations from a similar sized image set, captured in a synthetic environment.
This study is primarily concerned in the detailed analysis of crowdsourced comparative soft biometrics. Very large-scale image sets, such as PETA [7], contain approximately 100 times more subjects. Although this is an important direction for future work, it would present a number of challenges, such as; how to efficiently collect very large-scale comparative annotations and how to interpret severely obscured, lower quality images. As these questions are outside of this initial study’s scope, they are left open to future investigation.
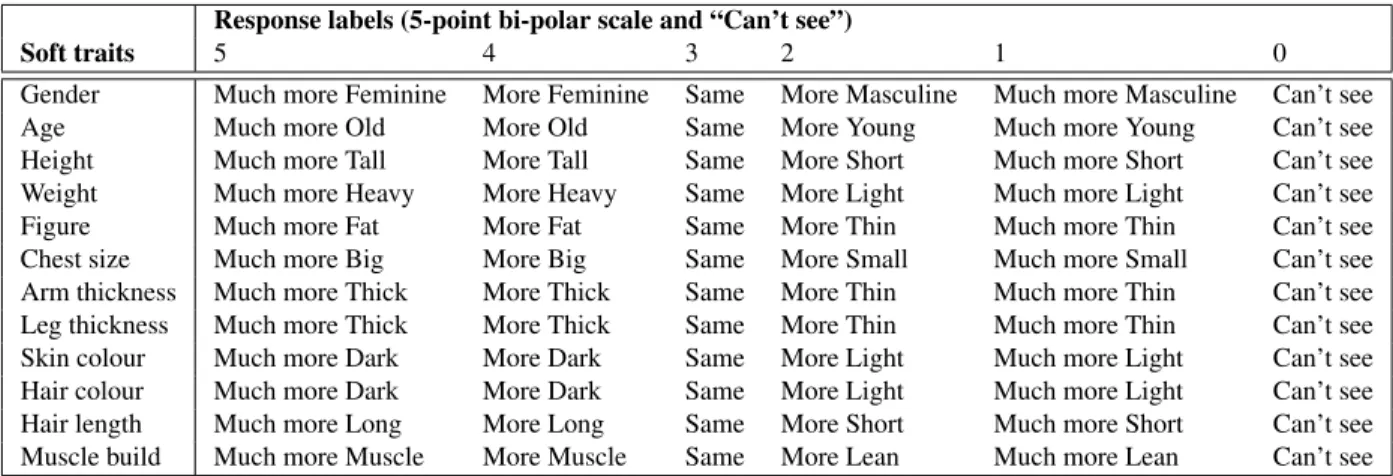
Table 1 Lexicon of soft traits and possible response labels.
Response labels (5-point bi-polar scale and “Can’t see”)
Soft traits 5 4 3 2 1 0
Gender Much more Feminine More Feminine Same More Masculine Much more Masculine Can’t see Age Much more Old More Old Same More Young Much more Young Can’t see Height Much more Tall More Tall Same More Short Much more Short Can’t see Weight Much more Heavy More Heavy Same More Light Much more Light Can’t see Figure Much more Fat More Fat Same More Thin Much more Thin Can’t see Chest size Much more Big More Big Same More Small Much more Small Can’t see Arm thickness Much more Thick More Thick Same More Thin Much more Thin Can’t see Leg thickness Much more Thick More Thick Same More Thin Much more Thin Can’t see Skin colour Much more Dark More Dark Same More Light Much more Light Can’t see Hair colour Much more Dark More Dark Same More Light Much more Light Can’t see Hair length Much more Long More Long Same More Short Much more Short Can’t see Muscle build Much more Muscle More Muscle Same More Lean Much more Lean Can’t see
4. Crowdsourcing task
In this section we detail the design decisions made in building a crowdsourcing task that led to the large collection of high quality comparative annotations. We used the CrowdFlower2platform to build and run the crowdsourced annotation task. The platform provides comprehensive data analysis and quality control tools, allowing customers to accept a range of responses while rejecting non-genuine answers. It also connects to global pools of contributors, therefore unambiguous and decisive questions must be presented.
We would ideally like to improve upon the crowdsourcing work of [13], who spent a significant sum of money collecting a large number of human intelligence tasks (HITs), only to gain few valid responses. Additionally, the goal is to collect geographically unconstrained data to better model average human perception and description of others, compared to more isolated annotation tasks like [36].
4.1. Trait and label derivation
Dantcheva et al. defines soft biometrics as “physical, behavioural or adhered human character-istics, classifiable in predefined human compliant categories” [5]. However, human descriptions of visual attributes are inherently unreliable, especially when dealing with absolute or continuous demographic value estimations from a diverse group of people such as with crowdsourcing [13]. Several studies have concluded that estimates of absolute body measurments are often very inac-curate [42], subject to anchoring and cross-race effects [11] and avoid extreme judgments [27]. In this section we explain our labelling method and lexicon selection, resulting in more objective annotation questions and avoiding the limitations of absolute label estimation.
MacLeod et al. set out the first system to record body attributes, founded on psychological observations of perception and memory [24]. The study deduces the 13 most reliably interpreted body ‘scales’, measured on a 5-point scale. These 13 body traits have in turn been assessed for categorical annotation variance [37], stability and discriminative power at-a-distance [39] and im-putation accuracy [35].
By collectively reviewing the most significant, prevalent and stable traits from [24, 35, 37, 39], the final soft biometric trait lexicon of 2 global and 10 bodysoft traitsis deduced, seen in Table 1. Ethnicity was excluded as a global soft trait, as Lucas et al. argue against separating by ethnicity,
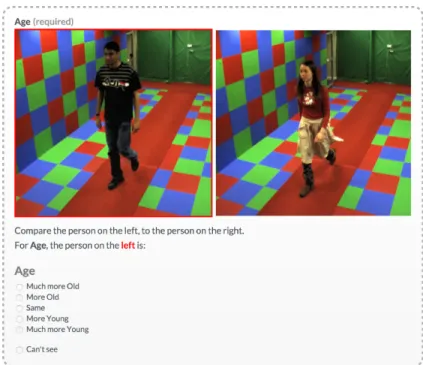
Fig. 2. Screenshot of one annotation task question.
stating that it is often misinterpreted when describing low quality images [23]. Although distinctive in some cases, there is also no obvious way to represent ethnicity through a single set of binary polar labels. Additionally, trait and label nomenclature was simplified, to preserve the question and response objectivity with a global crowdsourcing audience.
Finally, it is important to note that genderandskin colour are also collected as a comparative traits. Reid et al. was influenced by police witness evidence forms, opting to instead describe these traits through traditional binary and multi-class labels [36]. However, this can lead to near ubiquitous labelling if the dataset is unbalanced, or annotation suffers from the ‘cross race effect’ [30]. Comparative annotation aims to mitigate these effects, by objectively describing differences between pairs of subjects, rather than subjectively categorising their similarities. As far as we know, this is the first time gender has been measured in this way on such a scale, being most commonly described in a binary fashion.
4.2. Question and response design
Each annotation question is essentially a psychometric procedure, whereby the respondent is shown two stimuli images and asked to “compare the person of the left, to the person on the right”, for the 12 traits defined in our new lexicon. In total 12× 1002
unique annotations were asked, comparing each subject to every other subject for each trait. A 5-point bi-polar Likert-type scale was used for all annotations as in [36, 37, 24], following a consistent format: “Much moreA”, “MoreA”, “Same”, “MoreB”, “Much moreB”, Table 1. The 5-point Likert-type scale is commonly used in psychometric studies and was chosen to balance response granularity and annotation speed. Reid et al. collected an optional ‘certainty’ rating for each annotation [36], but this is time con-suming and would be ignored by crowdsourcing respondents who are looking to be paid. Instead, an additional “Can’t see” option was provided as an acceptable response for hard to distinguish questions. This is a very important option, as it reduces the chance of collecting feigned and
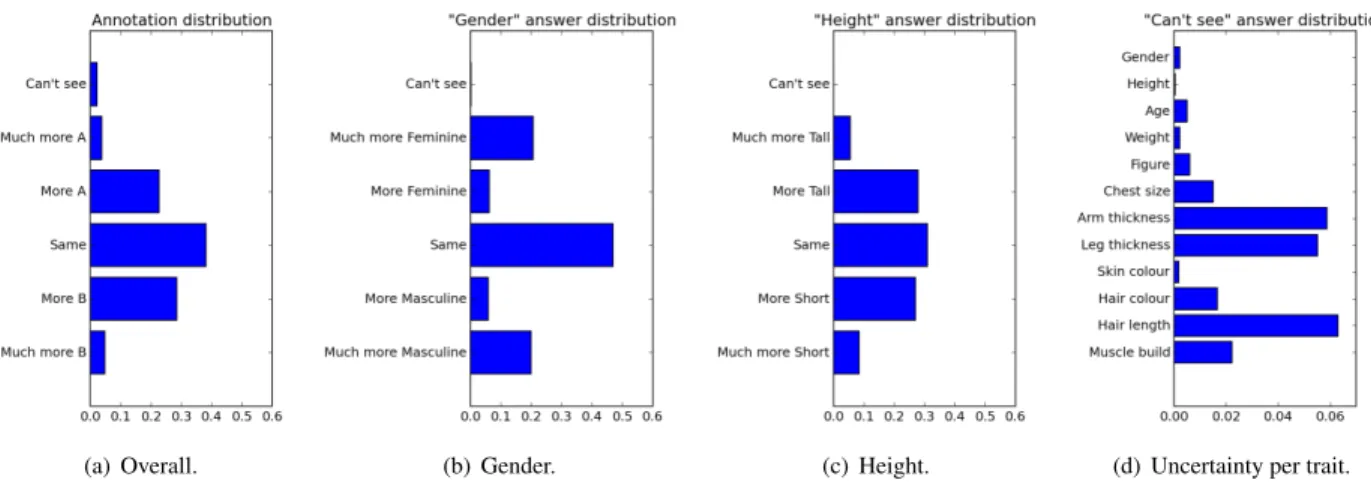
(a) Overall. (b) Gender. (c) Height. (d) Uncertainty per trait.
Fig. 3. Crowdsourcing annotation task response distribution examples. inaccurate responses.
Respondents were allowed to answer up to 20 pages, each with 10 annotations. The crowd-sourcing platform has the ability to pre-define test questions, to measure respondents’ accuracy and minimise the number of spurious responses. The first page consisted totally of test questions, which must be passed in order to proceed and be paid. Subsequent pages contained 1 test question and 9 unique annotations, therefore continuously monitoring respondents’ reliability.
Several subsets of questions were trialled, to measure the acceptability of the predefined test questions. As a result, the following considerations were made:
• To make test questions fair, they were sampled from more obvious comparisons and only the most fundamentally incorrect responses were rejected. However, respondents must score at least 80% to proceed.
• “Can’t see” was marked as an acceptable response for all annotations, but capped at a maxi-mum response rate of 20% per respondent.
• Respondents were rejected if their response distribution varied largely from the average re-sponse distribution formed during the initial trials.
• In addition to a large number of introductory examples, each question included text and high-lighting, reiterating the task question to “compare the person on theleft, to the person on the right”.
• The response form was formatted using vertically aligned radio buttons, enabling quick and instinctive responses to incentivise respondents further. Initial answers were left blank to avoid anchoring [36]. Figure 2 illustrates final question layout and accompanying text.
4.3. Crowdsourced annotation analysis
The annotation task concluded with 59400 unique annotations collected from 892 trusted respon-dents (124 untrusted responrespon-dents were flagged, and 4383 responses rejected). Including trail runs, the final task cost only $303. Clear instructional text and objective test questions meant our task was more economic compared to Han et al.’s study, that spent $3000 on 112,519 HITs [13]. Fur-thermore, 179 respondents rated our task favourably, giving it an average of 4.4 out of 5.
Figure 3 details a select overview of annotation distributions gathered from the task. Figure 3(a) shows the overall label distribution, while Figure 3(b) and 3(c) exemplify two very different re-sponse distributions forgender and height respectively. We see in the majority of cases that re-spondents foundgenderto be distinctly separable, but differentiated more subtle differences with height.
Although “Can’t see” was always an acceptable response, only 2.4% of answers were marked as such, Figure 3(a). Figure 3(d) compares the distribution of these “Can’t see” responses, forming a measure of uncertainty for each trait. As expected arm thickness and leg thickness were very uncertain, being the least distinctive traits chosen from previous work [36, 37]. Interestingly,hair lengthwas the most uncertain, due to one subject wearing a head scarf, and many others with long hair obscured by their body, due to the camera angle.
This also tells us that the different distribution characteristics for traits like genderandheight are not due to respondent uncertainty. Furthermore, genderand skin colour are two of the least uncertain traits, demonstrating that they are in fact suited to being collected comparatively, contra-dicting the assumptions of MacLeod and Reid [24, 36].
5. Semantic ranking inference
To interpret the annotated pairwise comparisons, we wish to infer the semanticstrength for each soft biometric trait associated with every subject. Strengths, or scores, are measuredrelatively, meaning we can thenranksubjects by score, forming an ordered list for each trait.
5.1. Ranking function formulation
To infer the rankings, we define aranking functiongiven a set of pairwise constraints. For each trait t ∈ T, we say Ot is a set of ordered images(i, j) ∈ Ot, such that imagei possesses more of one polar quality for traittthan imagej andStis a set of similar image pairs(i, j) ∈ St, such that bothiandj posses similar qualities for traitt. To reduce the effects of discrepancies between annotation techniques, “Much more” and “More” responses were combined for each polar label.
Our goal is to find T trait target vectors r, such that for ordered images (i, j) ∈ Ot, ri > rj and for similar images(i, j)∈St, |ri−rj|= 0. Although this is an NP hard problem, a popular method for approximating the solution is to use Joachims’ RankSVM [18], later extended by Parikh to support similarity constraints [31]. As with soft-margin SVMs, we introduce a slack variable ξij, which is the ranking error between imagesiandj. Following the concise formulation of [26], we wish to: minimize r 1 2||r|| 2+CX ξij2 subject to ri−rj ≥1−ξij, (i, j)∈Ot, |ri−rj| ≤ξij, (i, j)∈St, ξij ≥0, (1)
whereC is the primary RankSVM parameter, trading off between maximising the margin and satisfying the pairwise relative constraints [31]. As this is fundamentally an SVM formulation, it can later be extended to learn rankings from any given feature space, e.g. automatically generated image features.
5.2. Inferred score and rank analysis
(a) Normalised relative scores against ranks for each trait. (b) Kendall’s tau correlation between trait ranks.
Fig. 4. Inferred scores and ranks using all available comparisons (n= 50).
By applying the RankSVM algorithm, we find a target vector r for each trait. This vector represents therelative scoresfor all subjects of traitt, and can also be used to linearly rank subjects. Figure 4(a) contrasts the normalised relative scores against their ordered rankings, illustrating the different characteristics of each soft trait’s inferred values (semantically ranked usingC = 1).
Gender comparisons produce a highly binary distribution between ‘feminine’ and ‘masculine’ polarities. However, the gender response is not a perfect step function, and there are several sub-jects whose gender is not as pronounced as others (Figure 4(a), ranks 48-52). Hair colour also exhibits a number of similar low scores, representing subjects with dark shades of hair, whereas lighter shades are more easily distinguished. In contrast, traits likeheightdisplay an almost linear correlation between score and rank, as even subtle differences are clearly observed.
Kendall’s τ coefficient is used to measure correlations between traits in Figure 4(b). Similarly to [1], there is a correlation cluster between build characteristics e.g. weight, figure, arm andleg thickness and muscle build. A strong correlation pair was found between skin colour and hair colour, as darker skinned subjects tend to have darker hair. Gender, height andhair length also poses strong correlations, whileagevaries most independently.
5.3. Soft trait stability
In order to discern the stability and consistency of the inferred measurements, we vary the number of comparisons, n, used in the ranking inference process. Annotations are sampled at random, maintaining n comparisons per subject trait, reporting an average of 50 iterations per n. This provides insight into the underlying subjectivity, confusion and discrepancy for each soft trait.
Figure 5 depicts a measure of inferred rank stability for each trait, applying Kendall’sτ across all iterations ofn. We findgenderto be the most stable at lowernvalues, whilechest sizeandskin colourare the least stable overall. Only slight improvements to stability coefficients are provided byn > 3comparisons, suggesting a suitable ordering is found byn= 4.
Fig. 5. Kendall’staucorrelation of traits ranks, varying number of comparisons,n.
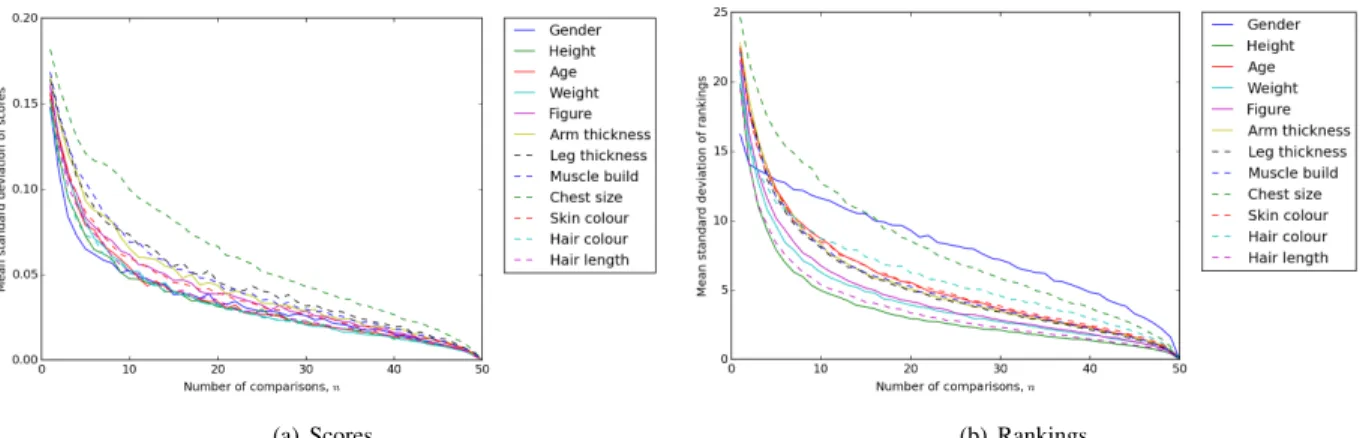
(a) Scores. (b) Rankings.
Fig. 6. Mean standard deviation of traits, varying number of comparisons,n.
genderproduces the most consistent soft trait scores at lowern, closely followed byheight, Fig-ure 6(a). However, the same is not true for rank, wheregender is the least consistent, butheight remains the most stable measure, Figure 6(b).
Although this appears to directly contradict the findings in Figure 5, rank variance is not nec-essarily related to overall rank discordance. For example, the binary separation ofgenderin Fig-ure 4(a) is maintained at lown, due to similar relative scores, resulting in overall rank concordance, portrayed in Figure 5 and 6(a). However, within each binary region, subject ranks vary widely, due to lack of distinction within the perceived ‘feminine’ and ‘masculine’ groups, increasing the stan-dard deviation reported in Figure 6(b). Traits likehair colouralso follow a similar pattern.
From this analysis we can discern that highly distinctive and separable traits like gender and hair colourproduce stronger overall rank correlations and more consistent inferred scores, at the expense of confusing subject ranks with similar trait qualities. The analysis also indicates that height, gender, hair lengthand weight are overall more salient subject descriptions, whilechest sizeis the least salient.
6. Relative & absolute measurement correspondence
In this section we compare the correspondence of our comparative annotations, to Samangooei’s categorical multi-biometric tunnel dataset annotations [37]. We do this in two ways, comparing both the equivalent subjectlabelsand inferredrankings.
6.1. Annotation interpretation methodology
We start by defining the methodology for interpreting the two sets of annotations and then define two measures of correspondence between labels and ranks.
Comparative annotations,R, are mapped to relative integers 1-5 as in Table 1, for each subject pair(i, j) ∈ n, Ri,j ∈ {5,4,3,2,1}. “Can’t see” responses are ignored for these measurements. Categorical annotations,A, are mapped to absolute integers for each label class, with correspond-ing semantic orders, e.g. “Female” to 1 and “Male” to 2 forgender, “Very Short” to 1 and “Very Tall” to 5 forheight.
Label correspondence measures the how similar the two sets of annotations are when comparing the semantics of each pair of labels, counted per subject pair as follows:
label correspondencei,j =
1 Ri,j <3andAi < Aj 1 Ri,j >3andAi > Aj 1 Ri,j = 3andAi =Aj 0 otherwise
The overall label correspondence is averaged over all|n|annotations per trait: overall label correspondence= 1
|n|
X
(i,j)∈n
label correspondencei,j
Next we compare the inferred comparative ranks,r, to derived categorical ranks,a. Subjects are ordered based on the absolute value assigned to each trait category inA. A subjects’ position in this order defines their categorical rank,a. Rank correspondence for each subjecti ∈ N is therefore expressed as follows:
rank correspondencei =
(
1 ri < ai
0 otherwise
Finally, the overall rank correspondence is averaged over all|N|subjects per trait: overall rank correspondence= 1
|N|
X
i∈N
rank correspondencei
6.2. Label and rank correspondence analysis
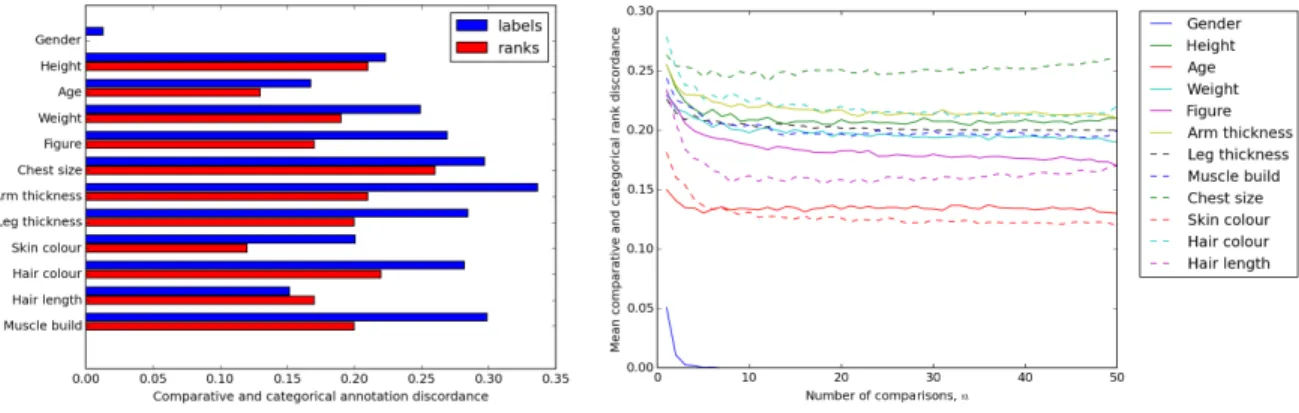
From the final inferred relative ranks (n = 50), we display the correspondence between compar-ative and categorical labels and ranks in Figure 7(a). With the exception of gender, traits vary between 12% and 34%. Gender, being extremely easy to discern and categorise shows perfect correspondence for rank. The discordance ofgenderlabels is much lower than expected, suggest-ing annotators avoided describsuggest-ing two subjects of the same gender as ‘more feminine / masculine’ even though this would be a valid response. Perhaps surprisingly, labels are overall more discor-dant than ranks, indicating that comparative annotations contradict pairs of categorical annotations more than the final ranks, possibly as they offer more precision in description.
We also inspect the correspondence of comparative and categorical ranks while varyingn, Fig-ure 7(b). Genderrequires only 3 comparisons per subject to rank them in perfect correspondence to the level of detail offered by the inferred categorical ranks. For the remaining traits, rank dis-cordance remains consistent when n > 5. This includes the least uncertain traits (Section 4.3)
(a) Label and rank discordance. (b) Mean rank discordance, while varying number of comparisonsn.
Fig. 7. Comparative and categorical annotation discordance.
and most stable and salient traits (Section 5.3). Therefore, we can imply that differences in final rankings are due to comparative annotations containing additional discriminative information over categorical annotations.
7. Performing semantic recognition
This section demonstrates how it is possible to perform recognition using only soft biometrics, from pre-interpreted relative scores. Biometric recognition is the process of identifying an un-known observation (theprobeorsuspect), by matching it to a set of known subjects (thegallery). This is ideally suited for forensic investigation or performing CBIR to automatically identify an individual in a video surveillance network.
7.1. Semantic recognition methodology
We aim to recognise a previously unknown suspect description from a gallery of the 100 known subjects. By varying the number of comparisons supplied to generate the suspect’s signature, we can simulate an eye witness testimony that compares the suspect to n known subjects. The recognition methodology is inspired by [36].
The experiment chooses the probe subject from the annotated dataset and removes n sets of randomly sampled comparisons between the probe and n other subjects. The removed compar-isons are used to form the a new suspect query, inserted into the dataset. Biometric signatures are generated for each gallery subject and suspect, represented as a vector of T target values for subjecti,xi ={ri}, using the RankSVM technique described in Section 5.
To perform recognition, a Euclidean distance Nearest Neighbour operator is applied between the probe signature and the gallery subject signatures. The outcome is classed as successful if the closest match to the suspect is the original probe subject (rank-1 recognition accuracy).
7.2. Semantic recognition performance analysis
For each subject and set ofncomparisons, 50 iterations are run. Results are recorded using signa-tures built from both relative normalised scores and ranking positions of each trait.
A direct comparison to Reid et al. is made, who performed recognition with annotations gath-ered from a smaller image dataset of 80 subjects, using 7 additional traits (4 comparative, 3
categor-(a) Rank-1 recognition accuracy, for n ∈
[1,50], compared to [36].
(b) CMC forn∈(1,5,10). (c) CMC forn= 10, comparing this study to [36] and absolute labels from [37].
Fig. 8. Semantic recognition performances.
ical). Therefore, the annotation workload for 12 sets of comparisons is equivalent to 19 sets from our lexicon. The study collected 558 annotations from 57 annotators, with the remaining compar-isons synthetically inferred [36]. We also compare our results to Samangeooei et al.’s original 23 soft traits categorical labels, collected on the multi-biometric tunnel dataset [37].
Our goal is to emulate a realistic response environment by using crowdsourced data. Therefore, we treat all annotations as equal, including “Can’t see” responses, and we do not synthetically infer labels. For this reason, we find expectantly lower recognition accuracies, compared to [36], at lower n values when performing rank-1 recognition, Figure 8(a). Rank-1 recognition rates also climb more slowly when increasingn, suggesting our data is slightly more inconsistent when labelling extra subjects. Even so, our ranking process can still attain a maximum recognition rate of 93%, compared to Reid et al.’s 95% [36]. Score based signatures surpassed rank based signatures at higher values, attributed to traits likegenderandhair colour, that have regions of similar relative scores, Figure 4(a). Therefore, relative scores describe the possessed quality of a trait better than ranking positions, which diverge between gallery and probe queries asnincreases.
A second experiment assessed recognition accuracy while varying the acceptance rank. This reproduces a surveillance scenario, in which the operator can rapidly eliminate irrelevant subjects, leaving only the most relevant matches to manual intervention.
With only n = 1comparison the system obtains 75% accuracy at rank 10, while withn = 10
comparisons it achieves 100% recognition accuracy at rank 7. In these cases, rank based signatures outperform score based signatures, as increasing the acceptance rank improves cases where correct matches have small rank differences but proportionally larger score differences. These promising results show that with onlyn= 5sets of comparisons, a surveillance operator would be guaranteed to find the correct identity in the top 13% of results.
Figure 8(c) illustrates our approach against [36] at n = 10and the original absolute labelling scheme of [37]. At n = 10 our approach’s recognition rates clearly surpass [37] and actually converges faster than [36], even when using far fewer soft traits and including “Can’t see” and discrepant annotations collected via crowdsourcing.
8. Conclusions
We demonstrate how soft biometrics can provide a solution to identifying pedestrians from video surveillance footage and how this could mitigate the limitations of conventional monitoring
sys-tems. By applying a RankSVM algorithm to interpret human comparisons, we build precise, rela-tive soft biometric signatures. With this technique and a lean lexicon of soft traits, our experiments perform recognition almost as well as, and in some cases better than [36], using more representa-tive, real-world crowdsourced annotations.
The publicly available dataset opens up opportunities to further explore the semantic annotation data, not only to evaluate its intrinsic properties for identification purposes, but to also better un-derstand the variations in human responses collected from a highly diverse population. The dataset selection also raises two open questions for future investigation; how to efficiently collect very large-scale comparative annotations and how to interpret severely obscured, lower quality images. We establish which soft traits are most suited to comparative description and investigated the stability and salience characteristics of inferred measurements. Finally, we show that comparative annotations contain more discriminative information than categorical labels. This knowledge will influence the training and validation algorithms applied to these novel ground-truth labels, empow-ering future studies in automatically generating soft biometric descriptions for subject identifica-tion from surveillance footage.
9. References
[1] D. Adjeroh, D. Cao, M. Piccirilli, and A. Ross. Predictability and correlation in human metrology. InWIFS, pages 1–6. IEEE, 2010.
[2] L. An, X. Chen, M. Kafai, S. Yang, and B. Bhanu. Improving person re-identification by soft biometrics based reranking. InICDSC, pages 1–6. IEEE, 2013.
[3] O.A. Arigbabu, S.M. Syed Ahmad, W.A.W. Adnan, and S. Yussof. Integration of multiple soft biometrics for human identification. Pattern Recognition Letters, 68:278–287, 2015. [4] L. Cao, M. Dikmen, Y. Fu, and T. S. Huang. Gender recognition from body. InACMMM,
pages 725–728. ACM, 2008.
[5] A. Dantcheva, P. Elia, and A. Ross. What else does your biometric data reveal? a survey on soft biometrics. 2015.
[6] A. Dantcheva, C. Velardo, A. D’angelo, and J. Dugelay. Bag of soft biometrics for person identification. MTAS, 51(2):739–777, 2011.
[7] Y. Deng, P. Luo, C. Loy, and X. Tang. Pedestrian attribute recognition at far distance. In ACMMM, pages 789–792. ACM, 2014.
[8] S. Denman, C. Fookes, A. Bialkowski, and S. Sridharan. Soft-biometrics: unconstrained authentication in a surveillance environment. InDICTA, pages 196–203. IEEE, 2009.
[9] S. Denman, M. Halstead, C. Fookes, and S. Sridharan. Searching for people using semantic soft biometric descriptions. Pattern Recognition Letters, 68:306–315, 2015.
[10] M. Farenzena, L. Bazzani, A. Perina, V. Murino, and M. Cristani. Person re-identification by symmetry-driven accumulation of local features. InCVPR, pages 2360–2367. IEEE, 2010. [11] R.H. Flin and J.W. Shepherd. Tall stories: Eyewitnesses’ ability to estimate height and weight
[12] G. Guo, G. Mu, and Y. Fu. Gender from body: A biologically-inspired approach with mani-fold learning. InACCV, pages 236–245. Springer, 2010.
[13] H. Han, C. Otto, X. Liu, and A. Jain. Demographic estimation from face images: Human vs. machine performance. TPAMI, PP(99):1–1, 2014.
[14] E.S. Jaha and M.S. Nixon. Viewpoint invariant subject retrieval via soft clothing biometrics. InICB, pages 73–78. IEEE, 2015.
[15] A. K. Jain, S. C. Dass, and K. Nandakumar. Can soft biometric traits assist user recognition? InDefense and Security, pages 561–572. SPIE, 2004.
[16] A. K. Jain, K. Nandakumar, X. Lu, and U. Park. Integrating faces, fingerprints, and soft biometric traits for user recognition. In Biometric Authentication, pages 259–269. Springer, 2004.
[17] A. K. Jain, A. Ross, and S. Prabhakar. An introduction to biometric recognition. CSVT, 14(1):4–20, 2004.
[18] T. Joachims. Optimizing search engines using clickthrough data. In SIGKDD, pages 133– 142. ACM, 2002.
[19] L.L. Kuehn. Looking down a gun barrel: Person perception and violent crime. Perceptual and Motor Skills, 39(3):1159–1164, 1974.
[20] R. Layne, T. M. Hospedales, S. Gong, and Q. Mary. Person re-identification by attributes. In BMVC, volume 2, page 8, 2012.
[21] R. Layne, Timothy M. Hospedales, and S. Gong. Attributes-based re-identification. InPerson Re-Identification, pages 93–117. Springer, 2014.
[22] E.F. Loftus and J.C. Palmer. Eyewitness testimony. Springer, 1996.
[23] T. Lucas and M. Henneberg. Comparing the face to the body, which is better for identifica-tion? International Journal of Legal Medicine, pages 1–8, 2015.
[24] M. D. MacLeod, J. N. Frowley, and J. W. Shepherd. Whole body information: Its relevance to eyewitnesses. Adult eyewitness testimony: Current trends and developments, pages 125–143, 1994.
[25] M. Madadi, S. Escalera, J. Gonz`alez, F. X. Roca, and F. Lumbreras. Multi-part body segmen-tation based on depth maps for soft biometry analysis.Pattern Recognition Letters, 56:14–21, 2015.
[26] T. Matthews, M. S. Nixon, and M. Niranjan. Enriching texture analysis with semantic data. InCVPR, pages 1248–1255. IEEE, 2013.
[27] C.A. Meissner, S.L. Sporer, and J.W. Schooler. Person descriptions as eyewitness evidence. 2007.
[28] D. Moctezuma, C. Conde, I.M. De Diego, and E. Cabello. Soft-biometrics evaluation for people re-identification in uncontrolled multi-camera environments. EURASIP Journal on Image and Video Processing, 2015(1):1–20, 2015.
[29] C.B. Ng, Y.H. Tay, and B. Goi. Recognizing human gender in computer vision: a survey. In PRICAI, pages 335–346. Springer, 2012.
[30] M.S. Nixon, P. L. Correia, K. Nasrollahi, T. B. Moeslund, A. Hadid, and M. Tistarelli. On soft biometrics. Pattern Recognition Letters, 2015.
[31] D. Parikh and K. Grauman. Relative attributes. InICCV, pages 503–510. IEEE, 2011. [32] U. Park and A. K. Jain. Face matching and retrieval using soft biometrics. WIFS, 5(3):406–
415, 2010.
[33] H.A. Perlin and H.S L. Extracting human attributes using a convolutional neural network approach. Pattern Recognition Letters, 2015.
[34] B. Prosser, W. Zheng, S. Gong, T. Xiang, and Q. Mary. Person re-identification by support vector ranking. InBMVC, volume 2, page 6, 2010.
[35] D. Reid, S. Samangooei, C. Chen, M. Nixon, and A. Ross. Soft biometrics for surveillance: an overview. MTAS, pages 327–352, 2013.
[36] D. A Reid, M. S. Nixon, and S. V. Stevenage. Soft biometrics; human identification using comparative descriptions. PAMI, 36(6):1216–1228, 2014.
[37] S. Samangooei, B. Guo, and M. S. Nixon. The use of semantic human description as a soft biometric. InBTAS, pages 1–7. IEEE, 2008.
[38] R. D. Seely, S. Samangooei, M. Lee, J. N. Carter, and M. S. Nixon. The university of southampton multi-biometric tunnel and introducing a novel 3d gait dataset. InBTAS, pages 1–6. IEEE, 2008.
[39] P. Tome, J. Fierrez, R. Vera-Rodriguez, and M. S. Nixon. Soft biometrics and their application in person recognition at a distance. WIFS, 9(3):464–475, 2014.
[40] R. Vezzani, D. Baltieri, and R. Cucchiara. People reidentification in surveillance and foren-sics: A survey. CSUR, 46(2):29, 2013.
[41] X. Wang and R. Zhao. Person re-identification: System design and evaluation overview. In Person Re-Identification, pages 351–370. Springer, 2014.
[42] J.C. Yuille and J.L. Cutshall. A case study of eyewitness memory of a crime. Journal of Applied Psychology, 71(2):291, 1986.
[43] W. Zheng, S. Gong, and T. Xiang. Person re-identification by probabilistic relative distance comparison. InCVPR, pages 649–656. IEEE, 2011.
[44] Zhi Zhou, Yue Wang, and Eam Khwang Teoh. A framework for semantic people description in multi-camera surveillance systems. Image and Vision Computing, 2016.
[45] J. Zhu, S. Liao, Z. Lei, D. Yi, and S.Z. Li. Pedestrian attribute classification in surveillance: Database and evaluation. InICCVW, pages 331–338. IEEE, 2013.
[46] J. Zhu, S. Liao, D. Yi, Z. Lei, and S.Z. Li. Multi-label cnn based pedestrian attribute learning for soft biometrics. InICB, pages 535–540. IEEE, 2015.