The moderating effects of external
uncertainties on the relation between social
capital and performance in buyer-supplier
relationships
Open University, the Netherlands Faculty of Management Science
Thesis for the Master of Science in management (B9431B)
Author: Patrique Mertschuweit Student number: 837056654
1st supervisor: Dr. C.J. Gelderman 2nd supervisor: Drs. J.M. van Luik
Acknowledgements
The last four and a half years have brought me a lot, not only in terms of experience and knowledge in the field of management science but also on, persistency and looking at things from a different perspective. Despite all this personal growth, it has not always been a picnic to get to the finish line. The journey of my Master of Science has been so utterly intense, that the accomplishment of the final goal of this journey almost felt like a black-hole. And although the voyage itself, and not the goal of the journey, has been the most interesting part of the process, I am proud to recon that the end actually marks the start of yet another magnificent trip I have ahead of me. Very special thanks and deep appreciations go out to my supervisor Dr. Kees Gelderman, without whose expertise, motivation and encouragement I never would have made it to the finish line. I have been extremely lucky to have a supervisor who cared so much about me, my work, and who responded to my questions and queries so promptly. Thanks to Max van Luik as well, who, together with Kees Gelderman had to put up with me for the longest, most difficult and most intense period of time. Many thanks go out to all the great teachers, professors, doctors and everybody else from the Open University who constantly motivated me to carry on. I would like to acknowledge my employer Philips Healthcare for the facilitation of my research. But; what I have realized more than anything is that this unequalled experience never would have been possible without the unconditional support of the beloved people I am blessed to have around me. Words cannot express how grateful I am that my biggest support and love of my life, my wife Monique and my children Floor, Anne & Tom, who missed-out quite some quality time with their husband and dad, supported me unreservedly throughout this entire extraordinary journey. Infinite thanks for that. And then of course big respect to my parents, who in their wildest dreams, never could have imagined their son, after quite a rough ride during his previous school “career”, to get his Master degree. And last but not least thanks to all my friends and family who supported me throughout the entire journey. Respect and have a great trip!
Patrique Mertschuweit Roermond, July 2014
Summary
Problem statement
Collaboration between companies has become more and more important within today’s business. To determine the nature of these co-operations and the different levels within organizations, the Social Capital Theory (SCT) has become an
important instrument (Carey, Lawson, & Krause, 2011). Social capital has become crucial in building effective supply chain relationships, since it contributes to the mutual benefits within buyer-supplier relationships (McGrath & Sparks, 2005). Research has supported the expected positive effect of social capital on company performance. However, most studies have focused on the direct effects, while organizational theories suggest including external uncertainties that shape the interactions among individual, organizational structure and performance.
Organizations could benefit from the knowledge in which way eventual moderating external uncertainties could influence the effect of social capital on Buyer-Supplier Relationships (BSR) as relational behaviors would become more predictable. Therefore, we have investigated the following problem statement:
“What is the moderating effect of external uncertainties on the relationship between social capital and performance in buyer-supplier relationships?”
Krause, Handfield, and Tyler (2007) made a distinction between operational performance (costs, quality, flexibility and lead-times) and strategic performance (long-term issues like competitiveness, product development and new markets). Nahapiet and Ghoshal (1998) divided social capital into three dimensions: cognitive social capital (shared meaning and understanding), relational social capital (trust, friendship, respect and mutuality) and structural social capital (frequency of interaction and contact). Land, Engelen, and Brettel (2012) captured external uncertainty into technological and demand uncertainty. In this study we have used these subdivisions and refinements for developing and testing hypotheses.
Research method
A questionnaire has been developed in which the research variables were operationalized. The questionnaire was pre-tested and finalized during a sample survey under a selected number of professionals and managers within the Philips Healthcare EMEA organization. The final questionnaire was online administered to 290 companies, randomly picked from the HUBWOO-list. This cross industry survey resulted in 88 useable responses and an effective response rate of 30.3%.
Results
Factor analysis indicated that the strategic performance construct actually was made up off two different constructs: a construct that refers to understanding customers
products. Hypotheses were tested by means of linear regression analysis, for both the direct effects of the social capital (cognitive, relational and structural social capital) as well as the moderating effects (technological and demand uncertainty) on the three performance constructs.
- In contrast to the theoretical expectations, we did not find any significant impact of social capital on operational performance.
For strategic performance, we did find significant effects of cognitive, relational and structural social capital on the strategic performance construct that captures the understanding of customers and markets. The data did not show a direct effect on the other strategic performance construct.
- The analyses included the testing of moderating effects of technological and demand uncertainty on performance. However, we did not find any moderating effects from the external uncertainties on the relationship between social capital and performance.
- What we did find was a direct effect of technological uncertainty on the strategic performance of companies in developing new markets and/or new products.
Apparently, technological uncertainties could lead to a higher strategic performance in the area of product development, and entering new markets.
Recommendations
Managers could benefit from the findings. Together with their suppliers they can put a bigger focus on the anticipation of changing technologies so that they could benefit from the arising of new markets and/or new products resulting from these changes. Also, managers should be aware that focussing on, and investing in the anticipation and understanding of their customers’ needs and future demands become more beneficial to them. When relational behaviours would become more predictable it will be easier to anticipate any change in need (future) customer needs, leading to
possible future improvements in strategic performance.
Like any study, our research is bound to some limitations. As our research model contains two, and at a later stage three variables it should be preferred to use an analytical technique suitable for Structural Equation Models (SEM) like PLS or AMOS. As we did not find any moderating effect from technological- or demand uncertainties, it would be recommended that further research could make an effort to look for other moderating variables and their impact on buyer-supplier relationships. Extra focus on the sample size and composition would also be recommended for future research. Both our sample size and composition deviated considerably from previous researches. Finally, to get more insights in the actual relations between buyers and suppliers it would be useful to do research on a dyadic level.
Table of contents
Summary ... 2
1. Introduction ... 7
1.1 Social capital in buyer-supplier relations ... 7
1.1.2 Performance ... 8
1.2 Problem statement ... 9
1.3 Research method ... 10
2 Literature review ... 12
2.1 Introduction ... 12
2.2 Performance in buyer-supplier relations ... 12
2.3 Social capital theory ... 13
2.3.1 Cognitive social capital ... 14
2.3.2 Relational social capital ... 15
2.3.3 Structural social capital ... 16
2.4 External uncertainties ... 18
2.5 Conceptual model ... 19
3 Methodology and research design ... 20
3.1 Research methodology ... 20 3.2 Data collection ... 20 3.3 Measurement model ... 22 3.4 Data analyses ... 24 4 Results ... 26 4.1 Response... 26 4.2 Descriptives ... 27
4.3 Validity of the Constructs ... 29
4.4 Operational performance ... 32
4.5 Performance on new products/markets ... 34
4.6 Performance on customer understanding ... 36
5 Conclusions, discussion and recommendations ... 39
5.1 Conclusions ... 39
5.2 Discussion ... 40
5.3 Recommendations for practitioners ... 42
References ... 44
Abbreviations: ... 47
Appendix I Operalization of the research variables ... 47
Appendix II Hypotheses ... 48
Appendix III Survey questions ... 49
1.
Introduction
This chapter provides the background, rationale and design of this research. It starts with an introduction to the subject social capital, followed by the problem statement and the research method.
1.1 Social capital in buyer-supplier relations
The term 'social capital' was in occasional use from about 1890, but only became widely used in the late 1990’s. In the first half of the 19th century, Alexis de
Tocqueville had observations about American life that seemed to outline and define social capital. He observed that Americans were prone to meeting at as many
gatherings as possible to discuss all possible issues of state, economics, or the world that could be witnessed. The high levels of transparency caused greater participation from the people and thus allowed for democracy to work better. The French writers also highlighted that the level of social participation (social capital) in American society was directly linked to the equality of conditions (Ferragina, 2010; Lawson, Tyler, & Cousins, 2008). In that sense, social capital is the expected collective or economic benefits derived from the preferential treatment and co-operation between individuals and groups. Although different social sciences emphasize different
aspects of social capital, they tend to share the core idea "that social networks create value" (Granovetter, 1973).
Co-operation between companies on all levels has become more and more important within today’s businesses. To determine the nature of these co-operations between organizations and the different levels within these organizations, the Social Capital Theory (SCT) has become an important instrument (Carey et al., 2011). Besides the fact that in the last decades, social capital has become crucial in building effective supply chain relationships, it has also become highly important in the explanation and research on how social capital may contribute to mutual benefits for both parties within BSRs (McGrath & Sparks, 2005). An increasing number of researches in the field of Supply Chain Management (SCM) have been studying the effects of social capital on performance. Scientists like Cousins, Handfield, and Lawson (2006) investigated the effect of relational capital specifically on buyer performance. Other research has been done on the effects of relational- and structural social capital on performance
(Lawson et al., 2008). Krause et al. (2007) investigated the effects of structural and cognitive capital for the explanation of company performance in terms of quality, delivery and flexibility. Besides all the research which has been done on the positive effects of social capital in the co-operation between companies and the possible performance increase, there has also some investigation been done on the more negative issues resulting from the various forms of social capital in BSRs. Villena, Revilla, and Choib (2011) studied the “dark side” of social capital in BSRs. They concluded that social capital may also have a down side in BSRs and could lead to a
The literature on supply chain management (SCM) is unequivocal regarding the value of collaborative BSRs. SCM researchers have studied how building social capital creates value for firms participating in collaborative BSRs (Krause et al., 2007; Lawson et al., 2008).
It is also suggested by them that the development of (a strong) social capital in BSRs enables both parties to bring their mutual resources to a higher level. Social capital may in that sense contribute to an important value increase of the relationship. A well-developed social capital will improve co-operation between the parties due to the fact that they share the same values when it comes to trust, vision and social
behavior. As a consequence, social capital will limit the likelihood of conflicts within the BSR. As previously stated, most SCM research emphasized the positive
outcomes of the effect social capital has on BSRs and only little research has been done so far when it comes down to the possible negative effects of social capital on BSRs. Villena et al. (2011) were one of the few researchers who suggested that further consideration needs to be given to the possible risks and down sides
associated with social capital within these relationships. According to their findings, in extreme cases, it can reduce the buyer’s ability to objectively make effective
decisions.
1.1.2
Performance
As companies increasingly focus on their core competencies and outsource a greater percentage of work, their success becomes ever more dependent on the
performance of strategic suppliers.
It is common knowledge that the process of value creation is not only a key issue within the company itself, but also complies with other parties and stakeholders involved in their supply chain. Customer and suppliers / manufacturers have become an integral part of the supply chain value creation (J. Stevens, 1989; Tan, Kannan, & Handfield, 1998). Joint efforts of all the parties involved will lead to outstanding performance within the chain. In order to reach this stage of outstanding
performance, all parties involved will, jointly, have to develop processes that focus on co-operation, integration and coordination between all layers and functionalities within the supply chain (Sanders, 2008). As Nahapiet and Ghoshal (1998) already stated in their research, co-operation between all chain-members will eventually lead to an increase in efficiency and improvement of performance for all parties. On the one hand there are the achievements of operational improvements in terms of costs, quality, lead-time, and the like. On the other hand are the accomplishment of more strategic outcomes such as the development of new products and markets. (Villena et al., 2011).
Efficiency is a measure of how well resources are utilized. Venkatraman and
Ramanujam (1986) focused on organizational effectiveness, and classified business performance measures as either financial or operational (non-financial). Operational
measures of performance can be classified in two streams: key competitive success factors (e.g., quality, delivery, price, service, and flexibility) and internal indicators, such as defects, schedule realization and cost. In the current study, the supplier’s performance is an operational measure of key competitive success factors, namely product quality, delivery performance, price, responsiveness to change requests, service support, and overall performance. The supplier’s performance directly influences the buying firm and is, therefore, a critical criterion for the buying firm. BSR is based on both transaction–cost theory and social exchange theory. From the supplier’s perspective, it is anticipated that BSR will have a positive impact on
performance (Prahinski & Benton, 2004).
1.2 Problem statement
Extensive research has been done on the positive, and fewer on the negative, effect of social capital on the relation between buyers and suppliers. Most researchers state that building social capital creates value for participating firms (Krause et al., 2007; Lawson et al., 2008). A few other researchers like Villena et al. (2011) concluded that social capital might not only have a positive contribution to the BSR. According to them there is a fair possibility that social capital could lead to a reduction in objectivity as parties become more opportunistic, and as a consequence decisions could
become more ad hoc and less effective. In both conclusions, either positive or negative, most of the research has been focusing on a direct cause and effect between social capital and BSRs. In organizational research theories, it is however also suggested that external uncertainties shape the interactions among individual, organizational structure and performance (Lu & Chyan, 2004). Land et al. (2012) captured external uncertainty in two dimensions:
Technological uncertainty
Demand uncertainty
The differentiation in technological and demand uncertainty is common in several literature streams, including those of strategic management and new product development (Sicotte & Bourgault, 2008; Song & Weiss, 2001). Technological uncertainty refer to the instability, complexity, and unpredictability of a relevant technology and its future development (Bstieler, 2005). Hughes and Perrons (2011) also concluded that the mix of weak and strong ties depends on the nature and complexity of the product. More complex products require more information exchange, more closely aligned operations and inter-firm co-operation, thereby increasing the strength of these ties. Demand uncertainty refers to the difficulty of predicting customer behavior and preferences and the composition of the potential customer group. It also refers to the speed of changes in demand in an industry. Given that the market successes of new product development of products with characteristics that meet customer needs and preferences is better than those of the competition (Augusto & Coelho, 2009). As the body of SCM literature continues to
of collaborative BSRs with other studies that consider the risks of such BSRs. The direct effects of social capital on performance have been investigated extensively. However, up to now, not much focus has been put on the potential moderating factors which could influence the effect of social capital on the performance within BSRs (Villena et al., 2011).
From the perspective of organizational research theories it appears that external uncertainty could be a moderating factor in the effect of social capital on BSRs. In order to even better predict and anticipate on the effect of social capital on BSRs it would be of great importance to know whether social capital is not only directly
influencing BSRs but might also depend on certain moderating factors. Organizations could benefit from the knowledge in which way eventual moderating external
uncertainties could influence the effect of social capital on BSRs as relational behaviors would become more predictable.
The following problem statement is defined, resulting from the above described: “What is the moderating effect of external uncertainties, technological uncertainties
and demand uncertainties on the relationships between social capital and buyer-supplier performance?”
1.3 Research method
In this study we will start with a literature review to investigate the influence of social capital on buyer-supplier relations. Using the virtual library from the Open University and the Internet-browsers www.picarta.nl, www.sciencedirect.com and
www.scholar.google.com. We used the advanced search and filter options to search for articles with keywords like “social capital”, “buyer-supplier relations” and
“moderating influence”. For the start of our research we made a choice from the available literature based on the relevance of the available articles like (Roden & Lawson, 2014), (Inemek & Matthyssens, 2013), (Aminoff & Tanskanen, 2013), (Oosterhuis, Molleman, & Van der Vaart, 2012) and (Villena et al., 2011). Based on this literature study, hypotheses on the moderating effect of external uncertainties (being: technological & demand uncertainties) will be derived.
The research methodology is as follows. A literature review is used in two ways, firstly to provide insight into the existing knowledge in the area of social capital and BSRs, and secondly to develop a conceptual model with a number of hypotheses, and a data model representing the research variables. Through a questionnaire, formulating related questions and response scales, each research variable is operationalized. In addition, the questionnaire is pre-tested and finalized during a sample survey under a selected number of professionals and managers within the Philips Healthcare EMEA organization. Subsequently a cross industry field survey has been done globally. By putting the questionnaire in a web tool accompanied by an introductory email with the web-link tool, the survey has been sent, to 290
suppliers which both have long term as well as shorter relations with the purchasing organizations and with whom there is contact on a regular basis. The suppliers are both globally and/or locally organized within the network. (The suppliers involved are suppliers, which are so called preferred suppliers, appearing in the HUBWOO1-list. These suppliers are important suppliers for the global organizations as they are supposed to add value to their supplier network). The results from the web-survey are processed using SPSS Statistics following a predefined plan for statistical processing. Based on the outcome of the statistical analysis the hypotheses are supported or not. As a last step the survey results are interpreted against the central research question, based on which research conclusions and recommendations for further research are formulated. By using the literature study in combination with the survey request (data triangulation), a solid and reliable base for our research will be conducted.
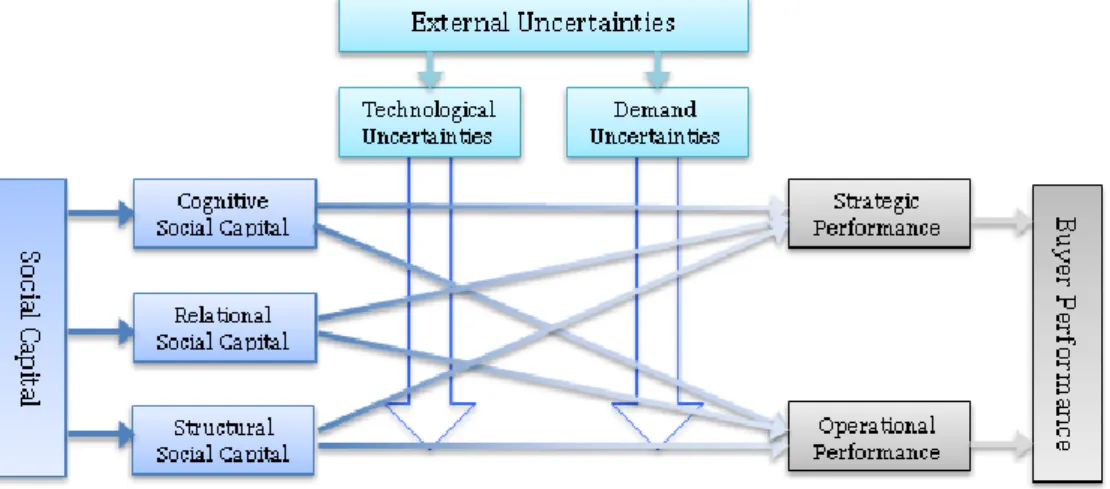
Based upon the aforementioned we came to the following overall conceptual model:
Figure 1, overall conceptual model
1
Hubwoo is a global provider of electronic purchasing solutions on-demand and consulting services for medium and large enterprises. The company operates the world's largest business-to-business community with more than 100 companies and involved over 13,000 connected suppliers. Hubwoo's trading hub annually processes 5 million transactions with a value of 10 billion Euros.
2
Literature review
2.1 Introduction
This Literature review is used in two ways, firstly to provide insight into the existing knowledge in the area of social capital and the effect on BSRs, possibly moderated by external factors, and secondly to develop a conceptual model with a number of hypotheses, a corresponding data model, and a survey questionnaire. In the survey-questionnaire, each research variable is operationalized by formulating related questions and response scales (i.e. constructs). In the next paragraphs an in depth overview is given on the relevant literature relating to the conceptual model.
2.2
Performance in buyer-supplier relations
From various SCM researches it has become clear that value creation incorporates all the parties involved in that specific chain and does not limit itself to processes of the company itself. Suppliers, manufacturers and customers play a crucial role in the creation of value within the chain (J. Stevens, 1989; Tan et al., 1998). Good co-operation between al the shackles will lead to a synergy, which in its turn will lead to operational excellence within the chain. To make operational excellence possible, all the parties involved will have to invest in processes which are focused on teamwork, integration of mutual processes and cross sectional coordination (Sanders, 2008). Villena et al. (2011) focused in their research on how the buying organizations are building social capital within the BSR in order to increase the supplier performance. Often, buying organizations take the lead in the building of social capital in relations based on trust, shared vision, norms and values and start sharing knowledge and information with their suppliers. One of the most well-known examples is the Toyota Company which was one of the pioneers when it comes down to the cross functional and multi-level exchanging and sharing of knowledge between their own personnel and their suppliers’. In general the highest level of performance improvement and the development of social capital takes place in settings where personnel form both suppliers and purchasing companies continuously interact in mutual experiments. Furthermore these joint “experiments” will lead to an increase in creativity and efficiency for both parties (Nahapiet & Ghoshal, 1998).
The operational performance emphasizes the gains in terms of costs, quality, flexibility and lead-times, whereas strategic performance focuses on added value in terms of product development and new markets. In most classical SCM studies, research has been done on the consequences of social capital on performance in operational terms of costs, quality, flexibility and lead- times (Cousins et al., 2006; Lawson et al., 2008). However, in more recent studies the focus shifts from the classical operational terms to the strategic gains like product development and the creation and finding of new markets (Sanders, 2008). Finally Krause et al. (2007) made a clear distinction between operational and strategic performance. They concluded that operational performance could be measured by direct profits in the
area of costs, quality, flexibility and lead-times. Strategic performance reached beyond these gains and mainly focuses on long-term issues like competitiveness, product development and new markets.
2.3 Social capital theory
Coleman (1990) described social capital in his research as an important output which was generated due to the fact that companies make resources available purely due to fact that they are having social relationships with each other. Nahapiet and Ghoshal (1998) divided social capital into three separate, but interdependent dimensions, being: cognitive-, relational-, and structural social capital.
The cognitive dimension represents shared meaning and understanding between actors.
The relational dimension is referring to trust, friendship, respect, and mutuality established by regular interactions between actors.
The structural dimension refers to the frequency of interaction, the frequency of contact between the various departments in both organization and the number of contacts between various levels within both organizations. Sociologists like Marc Granovetter (1973) & Coleman (1990) concluded in their researches that social capital is the outcome of the input and interaction of social relationships between parties. It is also suggested that shared meanings, such as shared values and goals, develop through an ongoing and self-reinforcing process of participation in sense making processes, as the parties construct a shared
understanding according to American organizational theorist Karl Edward Weick. In their three dimension-theory Nahapiet and Ghoshal (1998) argued that the structural dimension is related to social capital resulting from the structural configuration, diversity, centrality and boundary-spanning roles of network
participants. The cognitive dimension of social capital refers to similarity between both parties in organizational culture, business philosophy, goals and vision. Finally, Nahapiet and Ghoshal (1998) suggested that the relational dimension refers to
personal relationships that develop through a history of interactions, i.e., the extent to which trust; obligation and mutuality exists between the parties.
Using SCT as a lens through which to understand the complex nature of social exchange relationships (SER) (Carey et al., 2011; Krause et al., 2007; Lawson et al., 2008). Roden and Lawson (2014) examined the effect of buyer and supplier
adaptations on the social canvas of strategic buyer supplier relationships, also using the three dimensions of SCT: structural capital; cognitive capital; and, relational capital. SCT recognizes that relationships between actors in the supply chain are composed of people, and that the interactions between individuals shape the relationship and its effectiveness (Ketchen & Hult, 2007). In their research they
adaptations, which are unique to the relationship, as opposed to exogenous environmental factors over which managers have little to no influence.
The impact of social capital on performance has been studied at multiple levels using different measures. Some researchers have focused on relational ties in the
structural capital dimension (Burt, 2000), while others have considered the strength of those ties in the relational capital dimension (Granovetter, 1973). Some
researchers have considered both and examined the impact of managers’ structural and relational capital on their performance. Structural capital played a stronger role in explaining execution-oriented managerial tasks while relational capital played a stronger role in explaining innovation-oriented tasks, and encouraged future research to consider the effects of both on a variety of performance measures. However, empirical social capital research has seldom considered the impact of cognitive capital, in terms of shared values and goals, on company performance.
The three different dimensions of social capital, cognitive, relational and structural, are discussed separately in the next paragraphs.
2.3.1
Cognitive social capital
According to Nahapiet and Ghoshal (1998), cognitive social capital refers to similarity between both parties in organizational culture, business philosophy, goals and vision. Shared culture and similarity in goals are described as the most important
dimensions of cognitive capital. Shared culture in that sense is referring to the significance of behavioural norms and values in determining these relationships. Shared goals determine to which degree parties have a shared understanding and strive for mutual outcomes and tasks (Inkpen & Tsang, 2005). Parties with similar cultures facilitate individual actions and constrain undesirable behavior in favor of the collective interests (Coleman, 1990). The fact that rules, values and norms, which refer to behaviour, are adapted as being the mutual standard, contribute to
standardized activities within a social relationship (Gulati, Nohria, & Zaheer, 2000). Because of this standardized set of rules, values and norms, a more consistent joint interest will occur. This will also reduce the risk of opportunistic behaviour from either one of the parties. In its turn this will lead to a higher commitment and lower costs. Finally, the synergy of joint goals and interests will strengthen each other’s efforts (Jap & Anderson, 2003). Committed parties have a deeper understanding of why the relationship exists and how they can contribute to the attainment of compatible goals. Shared goals cannot only reduce the risks of any disagreements (Jap, 1999), but can also improve the shared gains of their “investments” for both parties involved. This clearly shows the joint benefits of the synergy, which will take place, within this social relationship. Both participants in the social relation will benefit from this social relation (Tsai & Ghoshal, 1998). There is however also the risk that a lack of common
similarities in the area of culture and goals could lead to more disagreements and conflicts which will finally lead to a decrease of performance (Inkpen & Tsang, 2005). Furthermore, this lack of similarities could also undermine the development and
implementation of new innovations, as parties would spend the majority of their time on solving their relational issues. One can conclude that cultural similarities and joint goals lead to a shared vision which will lead in its turn to a better mutual
understanding of the common behavioural norms, values and rules within the social relationship. Social relations determine whether there is any common ground to come to some kind of mutual agreement with regards to the business goals and strategies. Co-operating parties which seek to improve their competiveness will have to come to a consensus in their organizational cultures to maximise their benefits coming from their social relationship (Villena et al., 2011).
Hypothesis 1a. Cognitive social capital has a positive impact on strategic
performance.
Hypothesis 1b. Cognitive social capital has a positive impact on operational
performance.
2.3.2
Relational social capital
The main framework of relational social capital contains factors like having close interpersonal interactions between parties, trust, friendship, mutual respect and interaction between actors. All of these factors have been developed in an on-going series of interactions between parties (Granovetter, 1973; Nahapiet & Ghoshal, 1998). These repeated interactions within the BSR lead to an increase in trust and confirm the shared norms and values within this relation. This also clearly
emphasizes the difference between relational capital, where the focus is on building and strengthening relationships, and cognitive social capital where the main issue is the alignment of cultures within the BSR. As the focus is on strengthening
relationships, trust becomes one of the key factors of relational social capital (Coleman, 1990; Inkpen & Tsang, 2005). Trust will lead to a more open
communication and more transparency. On a high level of trust, actors in the BSR become less concerned about each other’s opportunistic behaviours. The risk however is that due to the high level of trust actors will slowly move toward more risky business actions, based upon this high level of trust. This also is one of the main concerns in the outcomes of the Villena et al. (2011) research. Besides trust, also friendship, respect and reciprocity within the social relation are being developed through continuous interactions (Kale & Singh, 2009). Creating a proven image of being a trustworthy partner towards the other actor is crucial in the relation. Both parties should be able to rely on the fact that the other party will never abuse ones position in certain situations, even when they do have the opportunity. In that sense, parties tend to become very committed to their relationships. Parties will stick to their mutual norms and values and continue building a team with shared goals and
interests in which there is no room for self-centricity. In that way, relational capital is steering towards a joint effort and a collective behavior. This is where the mutual benefits of the relation gains power and becomes more and more interesting for both
reluctance to share certain information in the social relationship (Villena et al., 2011). It can be concluded that the development of personal relationships between higher managements and decision makers is the main focus within the area of relational social capital. This kind of relationships contribute to the building of trust, respect, friendship and the awareness of mutual goals and benefits which will lead to cost reductions and improve the co-operation within this relationship. In highly developed social relationships mutual behaviors can be influenced beyond the agreed
boundaries. (Bendoly & Swink, 2007; Granovetter, 1973).
Hypothesis 2a. Relational social capital has a positive impact on strategic performance.
Hypothesis 2b.Relational social capital has positive impact on operational performance.
2.3.3
Structural social capital
In order to reach the mutual benefits within the BSR, building structural social capital is a crucial issue (Krause et al., 2007; Lawson et al., 2008). Frequent interaction between multiple hierarchical and departmental levels, for both buyers and suppliers, will lead to benefits in the area of getting more and reliable information (Koka & Prescott, 2008). A buying company that encourages frequent interactions between its own personnel and those of its suppliers automatically promotes the sharing of
information. This eventually will lead to faster problem solving and harmonized processes (Dyer & Nobeoka, 2003). It is essential that the higher management level supports these frequent interactions. This will lead to an opener and more
transparent exchange of information and the institutionalization of shared strategies and mutual benefits. At the top management level, the promotion of frequent
interactions creates close ties that encourage the exchange of sensitive information and the formulation of common strategies that lead to strategic (mutual) benefits like product development and the creation of new markets. A very positive side-effect of the continuous cross functional interactions between different hierarchical company levels is that it will lead to unique competitive opportunities for both parties (Lawson et al., 2008). Nahapiet and Ghoshal (1998) concluded in their research that within the context of the framework combination and exchange, the structural dimension of social capital influences the development of intellectual capital primarily through the ways in which its various facets affect access to parties for exchanging knowledge and participating in knowing activities. While recognizing that these structural facets may also be systematically associated with other conditions for the exchange and combination of knowledge, one concluded that these associations are primarily derived indirectly, through the ways in which structure influences the development of the relational and cognitive dimension of social capital. In that sense, affective BSRs influence individuals’ motivation to engage in social interaction and thereby exchange knowledge. However, as interactions within a BSR intensify, there may come a
Information exchanged may become redundant and, if there is too much information, it may make timely decision making progressively more difficult. Also, when two parties are in constant contact with each other, they will be less triggered to find new and / or better partners. Their current relation has become that strong that they will not be feeling the need to build new relationships, which could have contributed even more to their goals. Instead they reside in the current situation in their BSR which could lead to the loss of focus (Villena et al., 2011). Too much interaction may even reduce the buyer’s ability to engage in activities that are also critical to improving its own performance (McFadyen & M.A., 2004). Furthermore, Grover, Lim, and Ayyagari (2006) state that information sharing beyond the processing capacity of the buyer’s managers might cause stress and confusion between what is and what is not critical for the relationship, thus lowering effective decision-making. They also suggest that too much information creates a cognitive burden to decision makers who
characteristically have a limited capacity to process information.
It is therefore important that parties should be aware of the fact that not all the interactions within their relations produce the same amount of relevant information with the same impotency or relevance for the making of any decision. One should also be aware that the continuous building of the relation is not a purpose by itself. It can best be seen as an investment, where the input should lead to a gain in some kind of way. Therefore, one would expect that buyer performance initially improves as structural social capital increases. As stated before, structural capital helps in the gathering of information to come to joined activities, take care of fast problem solving, and work towards shared goals and strategies. The risk is that at a certain time
parties could reach a level of structural capital after which there will hardly be any gains for either one anymore. In some cases the opposite may become the case in which overkill of structural capital could lead to negative results instead of positive. Too much information can cause the decision making process to become very difficult and the cost of maintaining such a high level of relationship may out cost the benefits (Villena et al., 2011).
Roden and Lawson (2014) state that parties are constantly trying to adapt to each other. The commitment of specific adaptations by both buyer and supplier than creates a safeguard, which may reduce the need for other forms of governance. The degree of making adaptions from both actors in the BSR is based on the
performance gains of both parties within this relation.
Hypothesis 3a.Structural social capital has a positive impact on strategic performance.
Hypothesis 3b.Structural social capital has a positive impact on operational performance.
2.4
External uncertainties
Organizational theory suggests that external uncertainty shapes the interactions among individuals, organizational structure, and performance (Lu & Chyan, 2004). Land et al. (2012) captured external uncertainty in two dimensions, technological uncertainty and demand uncertainty, a differentiation common in several literature streams, including those of strategic management (Oriani & Sobrero, 2008) and New Product Development (NPD) (Sicotte & Bourgault, 2008).
Technological uncertainty refers to the instability, complexity, and
unpredictability of a relevant technology and its future development (Bstieler, 2005).
Demand uncertainty refers to the difficulty of predicting customer behavior and preferences and the composition of the potential customer group (Jaworski & Kohli, 1993).
The moderating impact of technological uncertainty is based on the belief that it is relevant to an organization's product development—that is, to the preferences and demands of its customers. This being said, demand uncertainty is introduced into the model to refer to the unpredictability of customer preference and the speed of
changes in demand in an industry (Jeong, Pae, & Zhou, 2006). Given that the market success of NPD revolves mainly around the development of products with
characteristics that meet customer needs and preferences better than those of the competition, technological uncertainty takes full effect only if it translates into market demand uncertainty as well. That is, only if the customers shift their preferences as a result of technological change (Jaworski & Kohli, 1993). On the other hand, in
environments characterized by high technological uncertainty but low demand
uncertainty, customers tend to be less influenced by the technological developments available to them or expect them to happen at a steady pace such that the mere existence of technological uncertainty does not affect the relevance of the
relationship between structural social capital and organizational learning. However, when both technological uncertainty and demand uncertainty are present, the resulting relevant uncertainty can be mitigated by structural network ties that could result in a moderating effect on the relationship between structural social capital and learning (Land et al., 2012). Related to the previously described social capital theory the following hypotheses have been conducted:
Hypothesis 4a. Technological uncertainty has a moderating effect on the relationship between cognitive social capital and strategic performance.
Hypothesis 4b. Technological uncertainty has a moderating effect on the relationship between cognitive social capital and operational performance.
Hypothesis 4c. Demand uncertainty has a moderating effect on the relationship between cognitive social capital and strategic performance.
Hypothesis 4d. Demand uncertainty has a moderating effect on the relationship between cognitive social capital and operational performance.
Hypothesis 5a. Technological uncertainty has a moderating effect on the relationship between relational social capital and strategic performance.
Hypothesis 5b. Technological uncertainty has a moderating effect on the relationship between relational social capital and operational performance.
Hypothesis 5c. Demand uncertainty has a moderating effect on the relationship between relational social capital and strategic performance.
Hypothesis 5d. Demand uncertainty has a moderating effect on the relationship between relational social capital and operational performance.
Hypothesis 6a. Technological uncertainty has a moderating effect on the relationship between structural social capital and strategic performance.
Hypothesis 6b. Technological uncertainty has a moderating effect on the relationship between structural social capital and operational performance.
Hypothesis 6c. Demand uncertainty has a moderating effect on the relationship between structural social capital and strategic performance.
Hypothesis 6d. Demand uncertainty has a moderating effect on the relationship between structural social capital and operational performance.
2.5
Conceptual model
3
Methodology and research design
3.1
Research methodology
A survey research was chosen as the research methodology for this research, in order to get a better understanding on the phenomena and effect of social capital on performance. Furthermore we also searched to get more insights in the moderating effect of the external uncertainties, technological and demand uncertainties, on afore mentioned relations. In order to test the formulated hypothesis, this research made use of an online questionnaire, which was formulated from various resources. For this study we have been using existing questioning scales from the literature being a 5-point Likert scale where 1 = completely disagree and 5 = completely agree. The key-variables were divided into three categories:
Independent variables
Dependent variables
Moderating variables
Independent variables in this research are the social capital variants, being: cognitive, relational and structural social capital. The dependent variables are strategic and operational buyer performance and the moderating variables are technological and demand uncertainties.
The sampling frame consisted of manufacturers / suppliers, which are so called preferred suppliers, which to a significant extend appear in the HUBWOO-list. These suppliers are important suppliers for the global organizations as they are supposed to add value to their supplier network. The suppliers from this list are suppliers which both have long term as well as shorter relations with the purchasing organizations and with whom there is contact on a regular basis. Furthermore these suppliers are active in nearly every industry or product range, both locally as well as global. Questionnaires have been sent out to the manufacturers / suppliers by means of an email introducing our research together with a web-link to the online survey.
Depending on the company size, the surveys were sent to the responsible account manager, manager, director or owner within the company. Suppliers were randomly picked from the HUBWOO-list. In total 290 surveys were sent out to various
manufacturers / suppliers worldwide. In order to achieve a high response rate, of at least 25%, a “personal” letter accompanied the lists to the recipient. After one week, non-respondents received a personal kind reminder with the request to complete the survey within the next 5 days.
3.2
Data collection
Prior to the final version of the questionnaire used for our research, a draft version was made up which was reviewed by two independent managers within the company
Philips Healthcare on any deficiencies. After that the questionnaires were emailed as described to the 290 randomly chosen companies.
The questionnaire is divided into four main sections:
The basic section, containing general questions about the manufacturers / suppliers such as respondent’s position, type of industry and the company size in terms of employees and sales.
Independent variables, being social capital
Dependent variables, being buyer performance
Moderating variables, being external uncertainties
Enabling us to even further ensure the reliability of our research results, we included the following control variables:
Company size
Industry membership
The company size was measured through both the net sales per year in Euros and the number of employees working for the company. In previous research it appeared that larger organizations tend to be more focussed on performance improvement (Tsai & Ghoshal, 1998). Previous research also has shown that companies in industries, like for instance the automotive and pharmaceutical industry, are more interested in establishig relations built on social capital with other members in their supply chain, as knowledge has become more important to these companies than it is in other sectors (Yli-Renko, H., & Sapienza, 2001). The other thing is that the development of social capital requires higher investments in some industries compared to others which could make the establishment of social capital less interesting for these companies (Rowley, Behrens, & Krackhardt, 2000). Finally, to ensure the validity of our data, we measured the number of years the respondents have been working with their current employer. The number of working years for the company reflects the respondents’ knowledge and competence (Land et al., 2012); Villena et al. (2011).
The key independent variables (cognitive, relational and structural social capital) were measured with a five-point Likert scale, ranging from 1 = completely disagree to 5 = completely agree). For the measurement of cognitive social capital we included four items in our five-point Likert scale, being similarity between both parties in
organizational culture, business philosophy, goals and vision (Jap & Anderson, 2003; Kale & Singh, 2009). For relational social capital we measured five items in a five-point Likert scale, being close interpersonal interactions between parties, trust, friendship, mutual respect and interaction between actors (Kale & Singh, 2009). Finally, for exploring the importance of structural social capital we measured three items, frequency of interaction, the frequency of contact between the various departments in both organizations and the number of contacts between various levels within both organizations (Inkpen & Tsang, 2005; Tsai & Ghoshal, 1998) on a
The dependent variables, strategic and operational performance, were also measured on a five-point Likert scale. Operational performance was measured by five items influencing operational performance according to Sanders (2008). These items are costs, quality, flexibility, lead-time and improvement of processes. Also, five items on a five-point Likert scale measure strategic performance. This set of items comprehends product development, the entrance of new markets, and the
development of new technologies, gaining knowledge of customers and developing a better understanding of the markets.
Moderating variables, technological and demand uncertainties were measured on a five-point Likert scale. The moderating impact of technological uncertainty is based on the belief that it is relevant to an organization's product development (Jeong et al., 2006). Four items measured the external variable, technological uncertainty. These items were; the rapid changing technology in the industry, the opportunities these changes provide in the industry, the number of new products which have arisen from new technological breakthroughs and the number of technical developments within the industry (Bstieler, 2005). Finally, demand uncertainty was measured on a five-point Likert scale through three items; the possibility to accurately evaluate
customers’ needs, the forecastability of the demand, the predictability of the customers’ future demands (Jaworski & Kohli, 1993). Demand uncertainty is
introduced into the model to refer to the unpredictability of customer preference and the speed of changes in demand in an industry (Jeong et al., 2006).
3.3
Measurement model
Based on the theory, our literature review and the conceptual model in chapter 2 we created the foundation of this research. From a theoretical perspective we looked at the relations between a number of variables and the effect of these variables on buyer-supplier performance. We also looked at possible moderating variables on these relations. With the help of the theoretical perspective from chapter 2 we started to investigate the possible explanations to our research question:
“What is the moderating effect of external uncertainties, technological uncertainties and demand uncertainties on the relationships between social capital and
buyer-supplier performance?” Buyer-supplier performance is herewith defined as:
The mutual benefits that operationally manifest in direct gains like cycle time, cost, quality, delivery and flexibility, and strategic benefits which can potentially increase long-term competitiveness and benefit from exploring new opportunities to create value by for instance product- and market-development (Krause et al., 2007). In the operational part of this research an online survey was held amongst 290 randomly chosen companies, of which a significant number came from the
HUBWOO-list, from which we tried to find out what the influence of social capital on buyer-supplier performance is and if external uncertainties have a moderating
influence on these relations. The key-variables we investigated in our research have been operationalized in the following measurement model:
Variable Dimension Items Source
Independent
Cognitive social capital
Organizational culture Your company and your customers share the same organizational culture in terms of norms and values.
(Jap & Anderson, 2003; Kale, Singh, & Perlmutter, 2000; Sarkar, Echambadi, Cavusgil, & Aulakh, 2001) Business Philosophy Your company and your customers share the same business
philosophy.
Goals Your company and your customers share the same goals. Vision Your company and your customers share the same vision.
Relational social capital
Interpersonal interactions
The relationship between your company and your clients is characterized by interpersonal interactions.
(Kale et al., 2000) Trust The relationship between your company and your clients is
characterized by trust.
Friendship The relationship between your company and your clients is characterized by friendship.
Mutual respect The relationship between your company and your clients is characterized by mutual respect.
Structural social capital
Frequency of interaction
Together with your customers, your company promotes the frequency of interaction between both parties
(Inkpen & Tsang, 2005; Levin, Cross, & Abrams, 2003; Tsai & Ghoshal, 1998) Frequency of contact
between the various departments in both organizations
Together with your customers, your company promotes the frequency of contact between the various departments in both organizations.
The number of contacts between various levels of both organizations
Together with your customers, your company promotes the number of contacts between the various levels within both organizations.
Dependent
Operational performance
Cost reduction The relationship your company has with its customers has lead to cost reductions for your firm.
(He & Wong, 2004; Im & Rai, 2008; Sanders, 2008)
Flexibility The relationship your company has with its clients has lead to more flexible processes.
Lead-time The relationship your company has with its clients has lead to lead-time reductions.
Improvement of processes
The relationship your company has with its clients has lead to improvements in processes.
Strategic performance
Product development The relationship your company has with its clients has lead to more product development.
(He & Wong, 2004; Im & Rai, 2008; Sanders, 2008)
Entrance of new markets
The relationship your company has with its clients has lead to the entrance of new markets.
Development of new technologies
The relationship your company has with its clients has lead to the development of new technologies.
Customer knowledge The relationship your company has with its clients has lead to better customer knowledge.
Market understanding The relationship your company has with its clients has lead to a better market understanding.
Variable Dimension Items Source Moderating
Technology uncertainty
Changing technology The technology in your market is changing rapidly.
(Bstieler, 2005) Opportunities of
change
Technology changes bring new opportunities in your industry.
New products arisen from new technologies
Technological breakthroughs have lead to new products in your industry.
The number of technological developments
There have been a large number of technological developments in your industry.
Demand uncertainty
Evaluating customers’ needs
It is easy for your company to identify your customers’ needs.
(Jaworski & Kohli, 1993)
Demand forecast It is easy for your company to forecast your customers’ demands.
Predict future demands
Changes in customer’s demands are easily predictable for your company.
Control
Control Variable
Company Size (employees)
What is the size of your company in number of employees? 10-50 51-100 101-200 201-500 501-1000 >1000 SABI-Database (Borrowed from (Villena et al., 2011) Company sizes (sales)
What is the size of your company in million Euros sales per year? 0-19.99 20-39.99 40-99.99 100-499.99 >500 Industry sector
In which industry sector is your company mainly active? Food & Beverage
Chemical & Pharmaceutical Automotive Textile Paper Electronic Metal Other Respondent Respondents
Competency For how many years have you been working for your current employer? … years
Scale derived from the Standard Industrial Classification Profile
What is your position within your company? Owner
Executive
Manager or Professional Engineer
Operational (sales) position Strategic (sales) position Other
Table 1, measurement model
3.4
Data analyses
For our research in which we wanted to get more insights on the moderating effect of external uncertainties, technological and demand uncertainties, on the relationships between social capital and buyer-supplier performance, we used a survey to gather data on this issue. The survey was held under 290 different, randomly choses suppliers / manufactures.
Our conceptual model primarily attempts to explain the relationship between the nominal variables social capital and performance. Also we wanted to test the
moderating effect of the variable external uncertainties on the relation between social capital and performance. Furthermore the measurement model aims to validate reliability and validity of the proposed model. This will ensure that the measures of construct in our research are reliable before any conclusions are drawn (Dunn, Seeker, & Waller, 1994). Subsequently we tested the internal consistency reliability by means of firstly calculating the standard deviation. If all items indeed measure the same concept, than the averages of these items should not deviate very much from each other. Next we measured Cronbach’s Alpha (Cronbach, 1951) which provides an estimate for the reliability based on the indicator intercorrelations. A higher level of Cronbach’s Alpha indicates a higher level of reliability of the scale. Cronbach’s Alpha is scaled between 0 and 1 for the degree of consistency, which means the extent to which the items are measuring the same. If α = 0, than there is no consistency, and when α = 1, the items measure exactly the same. The statistical standard of α = 0,8. Finally we did a correlation analyses, showing the linear consistency of the data. If the items do indeed measure the same, they should have a positive coherence. After the assessment of the validity and reliability of our research model, we evaluated the structural model. We used the statistical programme SPSS to make regression analyses in which we wanted to test if there is a significant relation between social capital and performance. Subsequently we tested if there is a
moderating effect of the dichotomous variable external uncertainties in which we will test if there is significance in the relation. If the relation is not significant than there is no relation and the measure of the relation will be 0. Therefore h2 = 0 or r2 = 0 (Koop, 2009).
4
Results
The main purpose of this research was to investigate the possible explanations of what the moderating effect of external uncertainties, technological uncertainties and demand uncertainties, on the relationships between social capital and buyer-supplier performance are. Whereas we defined BSRs as the mutual benefits that
operationally manifest in direct gains like cycle time, cost, quality, delivery and flexibility, and strategic benefits which can potentially increase long-term
competitiveness and benefit from exploring new opportunities to create value by for instance product- and market-development (Krause et al., 2007). The reasons and purposes of this research were discussed with the manager regional commodity team EMEA of Philips Healthcare. After that, he gave permission to make use of the supplier list and we sent out our survey. The surveys have been sent by email, using a web-based survey tool (Survey Monkey® ), accompanied by a short introduction mail to our research.
4.1
Response
In total 290 questionnaires were sent to people, working in companies and other organisations in various European countries. One and a half week after the initial sent out of the survey, a reminder was sent to the non-respondents. After a total period of 3 weeks we closed the survey. From the 290 questionnaires, 99 were returned of which 88(n) were completed and usable responses. From the 290 surveys we emailed, 11 bounced due to the fact that the email addresses were no longer valid. 3 respondents opted out and explained in a separate email that they did not consider this researcher to suit their current position within their organization and therefore declined from participating. Therefore, the effective response rate was 88/(290-11-3)=276, or 31,88% which is a relatively high response rate. Furthermore 52 respondents indicated that they would like to receive a copy of the final findings of our research. In table 2 we made a summary of the survey response rate.
Table 2, survey response rate
After doing some further in depth research on the non-respondents we found several reasons for not returning the survey. The main reasons were:
No time / I put it on my “to do list” but forgot about it.
Company policy, not to participate in external surveys.
Not applicable for me.
I thought the survey mail was Spam.
We also noticed that a part of the respondents did not complete the survey, or even skipped the part with the general questions about their company and their own position. Most probably this was their (or their company’s) way to guarantee their anonymity in this survey, as not all companies were willing to share their figures on sales and number of employees.
4.2
Descriptives
We included several control variables in our research to further ensure the reliability of our research. From the SABI database (Villena et al., 2011), we took variables with regards to the company size and core business of the organizations with the remark that the variables may vary due to the nature of the company’s core-business. The first variable we used was company size. We measured the company size both by the number of employees currently working within the organization as well as the last year’s (2013) sales in millions of Euros of the organization. According to Tsai and Ghoshal (1998), larger organizations usually have more resources and therefore tend to benefit more from performance improvements.
Table 3, sales per year Table 4, no. of employees
From our respondents, 48% worked in companies with an annual sale of more than 25 million Euros and 42% worked in companies with more than 500 employees and can therefore be considered as large companies (definition European Union). Roughly one quarter of the respondents worked in small companies with annual sales of less than 5 million Euro or less than 50 employees. The other quarter has been working in medium sized companies with varying sales from 5 – 25 million Euros and the number of employees being between 50 and 500.
Secondly we used the control variable of the industrial membership of the
organization. Earlier research shows that industries like for instance the automotive and pharmaceutical sectors have bigger interest in the establishment of social capital due to the fact that gaining knowledge is of high importance to them (Yli-Renko et al., 2001). Social capital can also be considered as ambidextrous, as some companies benefit more from exploitational activities while others find their gains in explorational co-operations (Rowley et al., 2000).
Table 5, core business
The industrial membership control variables came from the SABI-database (SABI, 2014) and were clustered in 8 groups. However, after carefully reviewing the analyses of the responds on this general question, we questioned whether the answer-choices of question no. 32 from our survey, which originated from the SABI-database (and we borrowed from Villena et al. (2011)) were the most appropriate choices. 12 respondents (12,25%) skipped this question and more than 70% of the respondents confirmed that their company’s core business is another than the choices given. Therefore a different grouping or perhaps even an open question might have been more suitable here.
We also measured the profile of our sample group, which reflects the diversity of the respondents in terms of company size and core business of the relevant
organizations. Our respondents mostly consisted of managers or professionals (31%), followed by operational (sales) employees 20,7% and company owners (20,7%). A minority of the respondents worked as an executive (5,7%), an engineer (5,7%) or in a strategic (sales) position. Finally 17,2% of the respondents worked in another position than the aforementioned categories. As the management and professionals mainly conduct activities and make decisions regarding the
investments in SC, the majority of our respondents fit nicely within this category.
Table 6, position with the organization
Finally, to strengthen the validity of our data, we measured the number of years the respondents have been working with their current employer. The number of working years for the company reflects the respondents’ knowledge and competence (Land et
al., 2012; Villena et al., 2011). In our study the average number of working years for their current employer was just 8 years which is in line with the Dutch average of 8,3 years (CBS, 2014) and which justifies sufficient knowledge and competence from the respondents to fill in our questionnaire.
Table 7, number of working years
4.3
Validity of the Constructs
This chapter examines the results of the valid responses to our survey. We started with scale analyses of the items on Operational Performance (OP), which resulted in a Cronbach’s Alpha of 0,647 and Strategic Performance (SP) with a Cronbach’s Alpha of 0,740 that are both acceptable.
Table 8a, scale analyses OP Table 8b, scale analyses SP
Next we did a factor analyses on the 9 items of Operational Performance (OP) and Strategic Performance (SP).
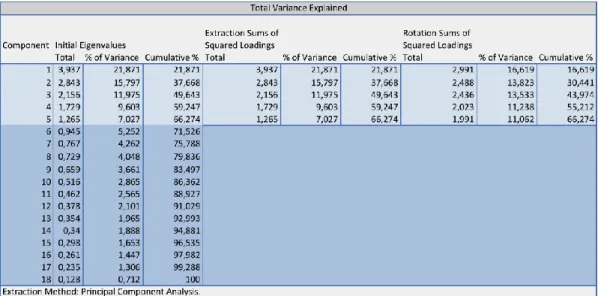
Table 9, Factor analyses on Performance
It turned out that there are actually 3 variables/constructs as they have a higher “initial own value” than 1, meaning that they explain more than a single item by itself and therefore do suggest a correlation between the items:
OP for the items 1, 2 and 3 (factor 3 in the Rotated Factor Matrix; item 4 was removed as it was not loading well on the other 3 items.
SP for the items 1,2 and 3 (factor 2)
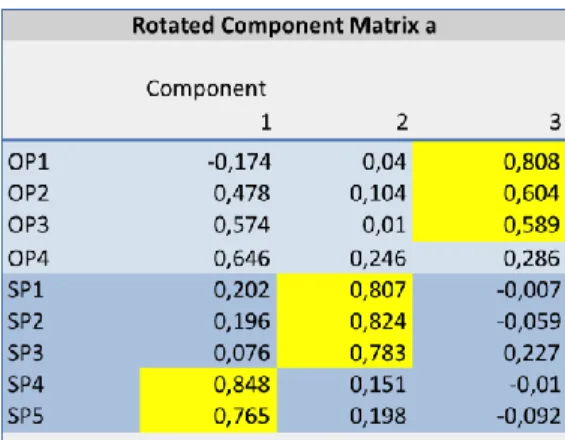
Table 10 shows the factor loadings in the rotated Component Matrixa, marked in yellow, for the items OP, SP and SP. J. P. Stevens (1992) suggests using a cut-off of 0.4, irrespective of sample size, for interpretative purposes. When the items have different frequency distributions, Tabachnick and Fidell (2007) follow Comrey and Lee (1992) in suggesting using more stringent cut-offs going from 0,32 (poor), 0,45 (fair), 0,55 (good), 0,63 (very good) or 0,71 (excellent). All our factor loadings are between 0,589 and 0,848 and can therefore be considered as good – excellent.
Table 10, rotated factor mix on Performance
A new scale analyses, however showed us that we also had to eliminate OP3. Finally a construct OP remained with items 1 and 2 and a Cronbach’s Alpha of 0,699.
Table 11, Second scale analyses on OP
For SP123 the Cronbach’s Alpha comes to 7,59 and for SP45 the Cronbach’s Alpha is 0,746.
OP12 mainly refers to gains in cost reduction and more flexibility,
SP123 mainly refers to the development of new markets and/or products, SP45 mainly refers to customer understanding.
In our further analysis we base our assumptions on afore mentioned 3 instead of 2 constructs. For these three constructs we than calculated the mean-constructs. The same analyses have been done for the independent variables, being: Cognitive Social Capital (CSC), Relational Social Capital (RSC) and Structural Social Capital (SSC). And the moderating factors Technical Uncertainty (TU) and Demand
Table 12, Factor analyses on the independent and moderating variables
After the factor analyses we came to the following 3 independent variable constructs:
CSC for the items 1,2,3 and 4 (factor 3 in the rotated factor mix)
RSC for the items 1,2,3 and 4 (factor 5 in the rotated factor mix)
SSC for the items 1,2 and 3 (factor 2 in the rotated factor mix)
For the moderating variable constructs we found the following 2 constructs for the same reason as the aforementioned:
TU for the items 1,2,3 and 4 (factor 1 in the rotated factor mix)
DU for the items 1,2 and 3 (factor 4 in the rotated factor mix)
Table 13 shows the factor loadings in the rotated Component Matrixa, marked in yellow, for the items CSC, RSC, SSC and DU.All our factor loadings are between 0,602 and 0,866 and can therefore be considered as good – excellent according to the standard of Comrey and Lee (1992) as all factor loadings should be above 0,45.
Also for these five constructs we calculated the mean-constructs.
For the independent and moderating variables the Cronbach’s Alpha’s were as follows:
Table 14, Cronbach’s Alpha’s for the independent and moderating variables
The Cronbach’s Alpha’s of all items were higher than 0,6 (ranging from 0,658 to 0,874). Cronbach’s Alpha levels higher than 0,7 are a valid indication for internal consistency among the items of the scale (Field, 2012; Koop, 2009). Alpha levels as low as 0,60 are acceptable for new scales (Dunn et al., 1994). Other research like Vickery, Jayaram, Droge, and Calantone (2003) came to a more general scale of Cronbach’s Alpha performance, in which an alph