DOI 10.1007/s10723-013-9260-9
Managing and Optimizing Bioinformatics Workflows
for Data Analysis in Clouds
Vincent C. Emeakaroha·Michael Maurer· Patrick Stern·Paweł P. Łabaj·Ivona Brandic· David P. Kreil
Received: 14 May 2012 / Accepted: 24 May 2013 © Springer Science+Business Media Dordrecht 2013 Abstract The rapid advancements in recent years of high-throughput technologies in the life sci-ences are facilitating the generation and storage of huge amount of data in different databases. Despite significant developments in computing capacity and performance, an analysis of these large-scale data in a search for biomedical rele-vant patterns remains a challenging task. Scien-tific workflow applications are deemed to support data-mining in more complex scenarios that in-clude many data sources and computational tools,
V. C. Emeakaroha (
B
)·M. Maurer· P. Stern·I. BrandicInformation Systems Institute,
Vienna University of Technology, Vienna, Austria e-mail: [email protected] M. Maurer e-mail: [email protected] P. Stern e-mail: [email protected] I. Brandic e-mail: [email protected] P. P. Łabaj·D. P. Kreil Chair of Bioinformatics,
Boku University Vienna, Vienna, Austria P. P. Łabaj
e-mail: [email protected] D. P. Kreil
e-mail: [email protected]
as commonly found in bioinformatics. A scien-tific workflow application is a holistic unit that defines, executes, and manages scientific appli-cations using different software tools. Existing workflow applications are process- or data- rather than resource-oriented. Thus, they lack efficient computational resource management capabilities, such as those provided by Cloud computing environ-ments. Insufficient computational resources disrupt the execution of workflow applications, wasting time and money. To address this issue, advanced resource monitoring and management strategies are required to determine the resource consump-tion behaviours of workflow applicaconsump-tions to en-able a dynamical allocation and deallocation of resources. In this paper, we present a novel Cloud management infrastructure consisting of resource level-, application level monitoring techniques, and a knowledge management strategy to manage computational resources for supporting workflow application executions in order to guarantee their performance goals and their successful comple-tion. We present the design description of these techniques, demonstrate how they can be applied to scientific workflow applications, and present detailed evaluation results as a proof of concept. Keywords Workflow execution·Resource level monitoring·Application level monitoring· Workflow management·Knowledge database· Cloud computing
1 Introduction
Scientific workflow applications have become an empowering tool for large-scale data analysis in bioinformatics [37, 38], providing the necessary abstractions that enable effective usage of compu-tational and data resources. The workflows strive to manage the operation complexities to free researchers to focus on guiding the data analy-sis, interpretation of results, and taking decisions whenever human inputs are required [22].
Considering the fast development of high-throughput technologies, which generate huge amounts of data, scientific workflow applications can be instrumental in achieving automation and breaking down extended complexity in the life sciences [42]. The execution of workflow appli-cations can be computationally intensive and re-quires reliable resource availability. Moreover, scientific workflow applications should be highly flexible to accommodate dynamic change of input data and parameter modifications, even during execution. Because, in scientific workflows, pre-liminary results can indicate suboptimal parame-ter choice. In such situations, one may want to adapt these parameters immediately. Thus, in the field of Bioinformatics, analyses are often semi-interactive. A typical example is the significance threshold for continuing into the second step of an analysis. This may have to be set liberally in case few results are expected. If during execution surprisingly many results meet the threshold, one may want to revise it for greater stringency. Typ-ical scenarios that require a response to changed input data include the update of an external data-base or the upgrade of a tool used to preprocess input data. In such situations, when the workflow is not already close to completion, it may be a better use of resources to restart with the revised input data.
The efficient management of such flexible work-flow applications seeking to guarantee the avail-ability of resources and the achievement of their performance goals is a challenging task. Often, resource availability decides the successful execu-tion of a complex and expensive workflow appli-cation. Therefore, there is a need for advanced techniques to monitor, at runtime, the resource consumption and application behaviours and to
inform about resource shortages, so that the management system can take adequate resource allocation decisions to support the successful com-pletion of each workflow application process.
Traditionally, a workflow application can be executed using local and distributed compute resources. Such resources are basically limited and, normally, cannot be dynamically reallocated. Considering that workflow applications are re-source intensive and can take hours if not days to complete, provisioning them in an environment with fixed resources leads to poor performance and possible execution failures due to the lack of a flexible allocation of extra resources. The Cloud is proving to be a valuable complement to the compute resources traditionally used in bioinformatics research laboratories [32]. Cloud computing technology promises on-demand and flexible resource provisioning that can be realized autonomically [3,20]. The execution of workflow applications in a Cloud environment allows for easier management and guaranteeing of their per-formance goals.
In this paper, we present a novel Cloud management infrastructure consisting of resource level-, application level monitoring techniques, and a knowledge management strategy, which al-locates and de-alal-locates resources based on the monitored information in order to support the execution of workflow applications in Cloud envi-ronments. The monitoring techniques are respon-sible for monitoring the execution of workflow applications in the Cloud to determine their per-formance and their resource consumption behav-iours including supervising the status of avail-able resources. The knowledge management uses the monitored information to make decisions on how to allocate resources to the computational nodes in order to ensure the successful comple-tion of the workflow applicacomple-tions. The main con-tributions of this paper are: (i) the introduction of Cloud management techniques applicable to workflow applications; (ii) the improvement of scientific workflow application execution to sup-port achieving their performance goals and to facilitate their successful completions; and (iii) the evaluation of our approach. The contributions are demonstrated using TopHat [43], a typical scien-tific workflow application from the field of
bioin-formatics that exemplifies the challenges in the complex analysis of large data sets from modern high-throughput technologies. The focus of this work is on supporting the execution of workflow applications and not on designing a workflow system. This paper is organized as follows: Section 2
presents some general descriptions of workflow applications, including the current state-of-the-art. There, we introduce in detail, the challenges to be addressed in this paper. In Section 3, we describe the Cloud management infrastructure, which is composed of resource-, application mon-itoring techniques, and a knowledge management strategy. Section 4 presents a concrete exam-ple of applying the Cloud techniques to support workflow application execution and Section5 dis-cusses the evaluation of our approach to present a proof of concept. We consider related work in Section6while Section7concludes the paper and discusses our future work directions.
2 Workflow Applications
In most working environments, there are pro-cedures that are repeated over and over again. These procedures usually consist of sub-tasks that represent encapsulated units of work, which form a dependency network. Thus, a workflow can be defined as a composite task that comprises coor-dinated human and machine executed sub-tasks [22]. In computer aided scientific work, a scientific workflow application is a holistic unit that defines, executes, and manages sub-task processes with the help of software artifacts [16].
2.1 Background
Bioinformatics is the research discipline in which scientists, with the use of computational methods, seek to gain insights from data gathered in the life sciences [22]. An objective example is the discov-ery of interesting patterns in data obtained from laboratory experiments and/or from earlier results stored in databases that can be online or in storage sites spread around the world. Bioinformatics is both applying established computational tools to new data, as well as new tools to well charac-terized data sets, seeking to improve on earlier methods. Thus, in bioinformatics, like in many
modern research disciplines, scientific workflow applications empower advanced and more com-plex analysis. Management systems have been de-veloped to facilitate the execution of workflow applications that use data and services from dis-tributed sources [2,6,14,17].
As a result of the proliferation of new high-throughput technologies in the life sciences that generate massive amounts of data, the retrieval, storage, and analysis of data face great technical challenges [35,39]. In particular, often, bioinfor-matics tools, many of which are available only through web-based interfaces, are not suited for the analysis of newly generated large-scale data sets due to their computational intensiveness [4,
34]. In general, existing workflow application management systems cannot handle the massive amounts of data and execute workflow applica-tions on these efficiently either [26]. New analysis software, workflow applications, monitoring, and management approaches are required that can take advantage of more powerful infrastructure such as data centers or Cloud environments.
In this paper, we consider Next Generation Sequencing (NGS), a recently introduced high-throughput technology for the identification of nucleotide molecules like RNA or DNA in bio-medical samples. The output of the sequencing process is a list of billions of character sequences called ‘reads’, each typically holds up to 35–200 letters that represent the individual DNA bases determined. Lately, this technology has also been used to identify and count the abundances of RNA molecules that reflect new gene activity. We use the approach, called RNA-Seq, as a typical example of a scientific workflow application in the field of bioinformatics.
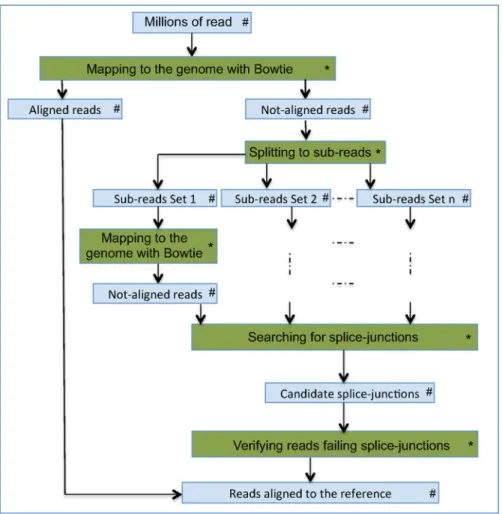
At first, in the analysis of RNA-Seq data, the obtained sequences are aligned to the reference genome. The aligner presented here, TopHat [43], consists of many sub-tasks, some of them have to be executed sequentially, whereas others can run in parallel (Fig.1). These sub-tasks can have dif-ferent resource-demand characteristics: needing extensive computational power, demanding high I/O access, or requiring extensive memory size.
In Fig. 1, the nodes marked with ∗ represent simplified sub-tasks of the workflow application, whereas the nodes marked with # represent the
Fig. 1 Overview of the TopHat aligning approach: color online
data transfered between the sub-tasks. The first sub-task aligns input reads to the given genome using the Bowtie program [24]. Unaligned reads are then divided into shorter sub-sequences that are further aligned to the reference genome in the next sub-task. If sub-sequences coming from the same read were aligned successfully to the genome, that may indicate that this read was straddling a ‘gap’ in the gene, falling on a so-called splice-junction. After verification of candi-date reads falling on splice junctions, these and the reads that were aligned in the first sub-task are combined to create an output with a comprehen-sive list of localized alignments.
2.2 Problem Description
In the course of a comprehensive study of some of the largest available RNA-Seq data sets [23], it has been noticed that even with modern dedicated
servers (having large memory size and high CPU capacities) the analysis of such large data sets can be challenging and requires prior knowledge about the resource-demand characteristics of the workflow application to execute.
In such studies, the analysis of one data set can easily take days. The analysis time is related to both the size of the input data set and the com-plexity of the studied organism. Like many such tools, TopHat creates large temporary files (in GBs per data set), and these accumulate during execution. With fixed resources, it can therefore easily occur that in the middle of an analysis run, there is unexpectedly no more space on the disks, especially when several instances have been executed in parallel. Thus, without appropriate prior knowledge about resource demands across execution time, the instances of TopHat running in parallel may trigger a crash and lead to the loss of several days of calculation time.
For higher efficiency in such analysis, we en-visage the necessity of appropriate strategies to monitor the resource consumption behaviours of workflow applications and to apply knowledge databases to manage and allocate resources ap-propriately. In the next section, we describe the management tools that can be used to this end.
3 Cloud Management Infrastructure
Cloud computing facilitates the implementation of scalable on-demand computing infrastructures combining concepts from virtualization, Grid, and distributed systems [3,33,36]. Cloud resources are provisioned based on Service Level Agreements (SLAs), which are contracts specified and signed between Cloud providers and their customers detailing the terms of the agreement, including non-functional requirements, such as Quality of Service (QoS) and penalties in case of violations [5, 11, 21]. Clouds open the door for a funda-mental change in how workflow applications are designed and deployed in bioinformatics research laboratories [15]. Its on-demand resource avail-ability and seemingly infinite scalavail-ability can aug-ment traditional in-house compute and storage
devices. In this section, we present monitoring techniques and a knowledge management strat-egy that provide state-of-the-art techniques for resource and application management in Cloud environments.
3.1 Resource Level Monitoring
Monitoring techniques are the basis for efficient resource and SLA management in Clouds. Nor-mally, SLA parameters such as availability,
throughput, and response time represent the
per-formance goals of applications. However, in Clouds, applications are provisioned with the in-frastructure resources, which are characterized by low-level resource metrics such as, uptime,
down-time, CPU, memory, and storage. Thus, there is
a gap between the SLA parameters and the low-level resource metrics.
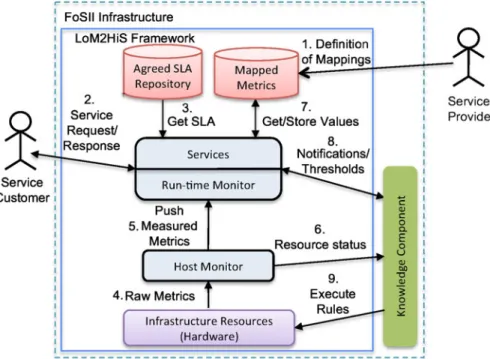
In order to bridge this gap and guarantee the SLAs of applications, a Low-level resource Met-rics to High-level SLA (LoM2HiS) monitoring and mapping framework was designed [7]. The LoM2HiS framework monitors Cloud infrastruc-ture resource metrics to determine their status while applications are being provisioned in a Cloud environment. Figure2depicts an overview
Fig. 2 LoM2HiS framework overview:
of the LoM2HiS framework. This framework aims to address two issues:
– monitoring of low-level resource metrics – mapping of the monitored metrics into SLA
parameters so as to monitor the application SLA at runtime.
It consist of two core components namely, the
Host monitor and the Run-time monitor, as shown
in Fig. 2. The Run-time monitor is designed to monitor services (applications) based on the ne-gotiated and agreed SLA objectives.
As depicted in Fig. 2, after agreeing on SLA terms, the service provider creates mapping rules for the LoM2HiS mappings (step 1 in Fig.2) using Domain Specific Languages (DSLs), which are small languages that can be tailored to a specific problem domain. Once the customer requests the provisioning of an agreed service (step 2), the Run-time monitor loads the service SLA from the agreed SLA repository (step 3). Service provi-sioning is based on infrastructure resources, which represent hosts and network resources in a com-putational environment. The Gmond monitoring agents from the Ganglia project [27] is used to measure the resource metrics, and the Host moni-tor accesses the measured metrics for processing (step 4). The Host monitor extracts the metric-value pairs from the raw metrics and transmits them periodically to both the run-time monitor (step 5) and the knowledge component (step 6) using a novel communication mechanism.
Upon reception of the measured metrics, the Run-time monitor maps the low-level metrics based on predefined mapping rules to form the equivalence of the agreed SLA objectives. These mapping rules are predefined depending on ap-plications types, raw metrics, and parameters in-volved. The definition of the mapping rules may include different complexity levels, e.g.,1:n or n: m. An example rule is presented in (1). It shows how to map the SLA parameter Availability from the low-level metrics uptime and downtime:
Availab ility= 1− downtime uptime+downtime ∗100. (1)
The resulting mapping is stored in the mapped metric repository (step 7), which also contains the predefined mapping rules. The Run-time monitor uses the mapped values to monitor the status of the deployed service applications at runtime. In case future SLA violation threats are detected, it notifies the knowledge component for preven-tive actions (step 8) and the knowledge compo-nent’s decision is executed on the infrastructure resources (step 9). The concept of detecting future SLA violation threats is designed by defining a more restrictive threshold than the SLA violation threshold that is known as threat threshold. Thus, calculated SLA values are compared against the predefined threat thresholds in order to inform the knowledge management to react before real SLA violations can occur.
In designing LoM2HiS, the separation of the Host monitor and the Run-time monitor makes it possible to deploy these two components on different hosts. This decision is focused towards increasing the scalability of the framework and on facilitating its usage in distributed and parallel environments. To this end, a scalable communica-tion mechanism is designed for exchanging mes-sages between the two components. The commu-nication mechanism exploits the capabilities of the Java Messaging Service (JMS) API [19], which is a Java message oriented middleware for sending messages between two or more clients. In order to use JMS, there is a need for a JMS provider that is capable of managing a large number of sessions and queues. We use the well established open source Apache ActiveMQ [1] for this purpose.
We have successfully utilized the LoM2HiS framework for resource monitoring and detecting SLA violations in private Cloud environments and in related areas [8, 40]. We have also evaluated it using different application types [10]. However, the LoM2HiS framework is focused on monitor-ing at the resource level in Clouds. The Run-time component is only capable of monitoring the ex-ecution of single threaded applications on Cloud infrastracture. Thus, it is not capable of moni-toring multi-threaded applications that are being executed with different processes. To address this issue, especially for workflow applications, we in-troduce application level monitoring in the next section.
3.2 Application Level Monitoring
In this section, we complement the resource monitoring framework presented in the previ-ous section with an application level monitoring architecture, which is capable of monitoring multi-threaded applications and the processes execut-ing their sub-tasks. The goals of this architecture are to achieve more insight information of the workflow execution and to realize fine-grained management of workflow applications. Further-more, we implement the ability of monitoring the temporary storage created by the TopHat workflow application while executing.
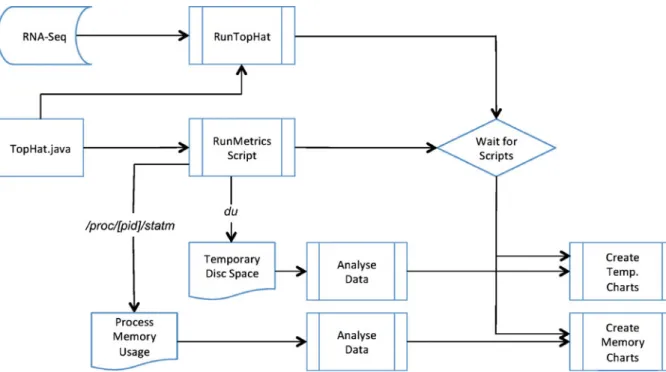
In order to realize this goal of monitoring the processes executing the TopHat application and its sub-tasks, we used the Linux inbuilt programs such as top and du to determine the resource usage of the processes associated with TopHat application. The du Linux program is capable of checking the disk usage of files and directories. Thus, we apply it to supervise the directory and sub-directories from where the TopHat workflow application is started in order to obtain informa-tion about the size of the temporal storage utilized
by the application at runtime. The memory usage of each process executing a task associated with TopHat is derived by analyzing the log files located in the /proc directory especially the statm log file with our implemented Java routine to achieve the usage information. Figure 3presents an overview of the application monitoring architecture.
The monitoring architecture design includes scripts to automatically start the TopHat work-flow application and call the inbuilt Linux pro-grams to monitor the execution of the application. The monitoring takes place at specified interval of time, which is defined based on the application type and its resource consumption behaviours. The application monitoring architecture stops its operation automatically once the workflow appli-cation completes its execution or there is a failure of the execution. We implemented Java routines to analyze and extract the monitored information values, which are sent to the knowledge manage-ment for processing. Furthermore, our architec-ture is capable of plotting the monitored infor-mation with the help of JFreeChart API [18] to visualize the results.
3.3 Knowledge Management Strategy
In the previous sections, we discussed the resource and application monitoring techniques in Cloud environments. In this section we present a knowl-edge management strategy that utilizes the moni-tored information to provide proactive actions for resource management in Clouds.
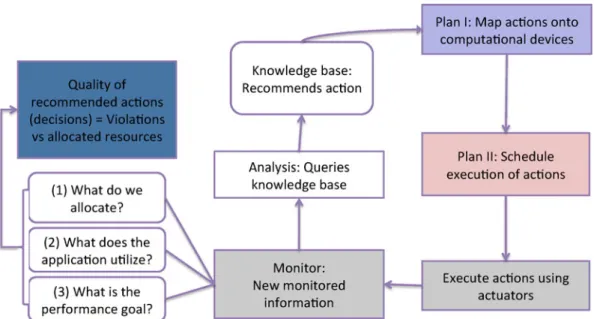
The term knowledge management (KM) in our context, means intelligent usage of measured data, obtained by monitoring, for the decision making process to satisfy application performance goal defined in SLA agreements while optimizing the computational resource usage. Apart from the monitoring phase (as shown in Fig.4), the knowl-edge management consist of three other phases namely analysis, plan, and execute. The core of the KM is a knowledge database that interacts with these phases in the management process.
Figure 4 presents an overview of the knowl-edge management. The monitoring phase delivers the monitored information, which includes details about the actual resource allocation status, the uti-lization of the resources by the workflow applica-tions, the performance status of the applicaapplica-tions, and the applications’ performance goals defined in
the SLA. The analysis phase processes the moni-tored data. It provides an interface for receiving the monitored information from the monitoring phase. It analyzes the received information to de-termine the exact resource SLA threat thresholds that are violated, and then decides on the exact reactive action to carry out in order to prevent future SLA violations. The plan phase plans the execution of the recommended actions and sort to prevent oscillation effects (i.e., allocating and deallocating the same resource interchangeably) in the operations. This phase is divided into two parts: plan I and plan II. Plan I is responsible for mapping actions onto physical and virtual machines in the Cloud environments and man-aging those machines [31]. Plan II is in charge of planning the order and timing of the actions. The execute phase is the final one. It executes the recommended actions on the computational devices with the help of software actuators.
We have successfully applied different tech-niques such as Case-Based Reasoning, rule-based, etc for knowledge management in Cloud environ-ments [28–30]. In the next section, we show how the monitoring and rule-based techniques are ap-plied to support workflow application execution.
4 Optimizing Workflow Execution
In this section, we apply the Cloud management techniques described in Section3to optimize the RNA-Seq scientific data analysis process. The ob-jective is to address the resource availability prob-lems affecting workflow application executions while analyzing bioinformatic data as outlined in Section2.2.
4.1 Workflow Execution Monitoring
Scientific workflow applications are resource in-tensive and can take considerable amount of time to complete. The successful completion of data analysis using workflow applications in the life sciences is paramount to the scientist. To facili-tate this objective, we apply the resource - and
application monitoring techniques to monitor the workflow application executions in order to su-pervise the computational resource status and the state of the processes executing the application sub-tasks.
Normally, workflow applications are composed of other applications (sub-tasks) linked together to achieve a common goal (as shown in Fig.1). A workflow application can be executed in a distrib-uted system using multiple computational nodes in which case, some parts of the application might execute on a different node. Thus, the successful completion of a workflow application depends on the completion of its composed parts executed by different processes.
To demonstrate our approach, we apply the Cloud management infrastructure techniques to support the scientific data analysis processes as
Fig. 5 Applying cloud management
infrastructure techniques to workflow application:
shown in Fig.1. For simplicity and ease of under-standing, we use a reduced version of Fig.1in this demonstration.
As described in Section3.1, the resource mon-itoring framework consists of three main com-ponents: (i) the Monitoring agents that monitors single computational nodes; (ii) the Host
moni-tor that gathers and processes monimoni-tored
infor-mation from the Monitoring agents; and (iii) the
Run-time monitor that maps metrics and
moni-tors application SLAs. We integrated the appli-cation monitoring architecture functions into the resource monitoring components to supplement their functions in monitoring at application level, and thereby achieve an advanced monitoring tech-nique. Figure 5presents how we applied the ad-vanced monitoring technique to efficiently man-age the scientific data analysis executions.
The TopHat workflow application execution is composed of different applications (sub-tasks) running sequentially and in parallel (as shown in Fig. 1). Thus, it is necessary to monitor the computational node used to execute each of these sub-tasks and the sub-tasks themselves in order to dynamically allocate resources if needed and to determine at each point in time the perfor-mance of the sub-task execution. As depicted in Fig.5, we integrate a monitoring agent into each of the computational node used for the execu-tion of the workflow applicaexecu-tion. The monitoring agents monitor the low-level resource metrics’ status (e.g., CPU, memory, disk space, etc.) of each node including the resource consumption of each sub-task. The monitored information (arrow
a in Fig.5) is communicated back to the advanced monitoring technique for processing.
The monitored information consist of unique IDs for each of the computational node, and their resource metrics including the resource consump-tion of each of the processes executing the sub-task. Thus, the advanced monitoring technique is capable of determining the specific node and the exact resource metric that might be lacking in the near future. It passes this information to the knowledge management component (arrow
b in Fig. 5) to take appropriate actions to en-sure the availability of this resource (arrow c in Fig. 5) in the Cloud environment for further computations.
4.2 On-Demand Resource Allocation
This section describes how we apply the knowl-edge management strategy to allocate resources on-demand based on the monitored information. With this strategy, we intend to efficiently manage computational resources to support the execution of the workflow applications.
To achieve these aims, we introduce a specula-tive knowledge management technique utilizing rule-based approach [30]. This approach ensures that at every point in time the computational nodes posses enough resources for the workflow application. Furthermore, it ensures that re-sources are not wasted by reducing the amount of resources allocated to a node if necessary.
In the life sciences, it has been identified that CPU, storage, and memory are the crucial com-putational resources for workflow execution. To demonstrate our speculative approach, we define SLAs to represent the workflow application per-formance goals. The SLAs specify objective val-ues for the required computational resources. En-forcing these objectives guarantees the applica-tion performance and its successful compleapplica-tion. An example of SLA specifications is presented in Table2at the evaluation section. The initial size of a computational node is determined based on the SLA of the application to be executed.
In a further step, we introduce three notions for resource management: allocated, utilized, and
specif ied—allocated means the amount of
re-sources allocated to a computational node,
uti-lized means the amount of resources used by the
application executing on the computational node, and specif ied means the assumed amount of re-sources required for successful completion of the workflow application. An SLA violation occurs, if less resource is allocated than the application utilizes (or wants to utilize) with respect to the specified objective in the SLA. Consequently, we try to allocate less than specified, but more than utilized in order to avoid SLA violations on the one hand and on the other hand to mitigate re-source wastage.
We define allocating more or less than uti-lized to be called over-provisioning or
under-provisioning, respectively. In order to know
under-provisioning or already is under-provisioned, or whether it is over-provisioned, we calculate the current utilization utr =user
prr ×100, where user
and prr signify how much of a resource r was
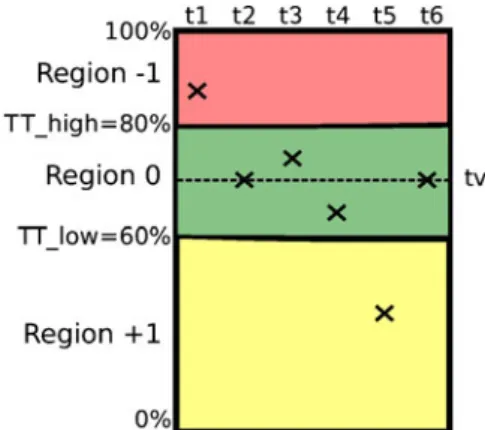
used and allocated, respectively, and divide the percentage range into three regions using Threat Thresholds (TT). In this case, we define two threat thresholds T Tr
low and T Thighr representing
the higher and the lower boundaries as shown in Fig.6:
– Region−1: Danger of under-provisioning, or under-provisioning (>T Tr
high)
– Region0: Well provisioned (≤T Tr
high and ≥ T Tr
low)
– Region+1: Over-Provisioning (<T Tlowr ) The idea of this rule-based design is to maintain an ideal value that we call target value tv(r) for the utilization of a resource r, in exactly the centre of region 0. So, if the utilization value after some measurement leaves this region by using more (Region−1) or less resources (Region+1), then we reset the utilization to the target value, i.e., we increase or decrease allocated resources so that the utilization is again at region 0 using (2).
tv(r)= T T r low+T T r high 2 %. (2)
As long as the utilization value stays in region 0, no action will be executed. E.g., for r=storage,T Tlowr =60 %, and T Thighr =
80 %, the target value would be tv(r)=70 %. Figure6presents the regions and measurements
Fig. 6 Example behaviour of actions at time intervals t1– t6: color online
(expressed as utilization of a certain resource) at time steps t1,t2, . . . ,t6. At t1 the utilization of the
resource is in Region −1, because it is in danger of a violation. Thus, the knowledge database rec-ommends to increase the resource such that at the next iteration t2 the utilization is at the center of
Region 0, that is, the target value. At time steps
t3 and t4 utilization stays in the center region 0
and consequently, no action is required. At t5,
the resource is under-utilized and so the knowl-edge database recommends the decrease of the resource to tv(r), which is attained at t6. Therefore,
we reset the utilization value to the target value by dynamically allocating extra resources to the computing node.
A large enough span between the thresholds
T Tr
low and T Thighr helps to prevent oscillations
of repeatedly increasing and decreasing the same resource. However, to further reduce the risk of oscillations, we suggest to calculate a prediction for the next value based on the latest measure-ments. Thus, an action is only invoked when the current AND the predicted measurement exceed the respective thresholds. So, especially when only one value exceeds the threshold, no action is executed.
Our on-demand resource allocation model dy-namically increases or decreases the virtual ma-chines resources by allocating extra resources when necessary and duly releasing them to avoid wastage and unnecessary energy consumption.
Based on this technique, we can provision sci-entific data analysis processes with enough re-sources to achieve high performance and to ensure their successful completion. In the next section, we present some evaluations of our approach.
5 Evaluation
In this section, we present the evaluation of our approach. The goals of the evaluations are to show the applicability of our advanced monitoring tech-niques to monitor the workflow application execu-tion and the usage of the knowledge management strategy to efficiently manage resources. We first discuss the environmental setups, the workflow application used, and later present the achieved results.
Table 1 Computational
node capacity OS CPU Cores Memory Storage
Linux/Ubuntu Intel Xeon(R) 3 GHz 2 9 GB 19 GB
5.1 Experimental Setup
The evaluations are carried out in a private virtu-alized Cloud environment. The workflow applica-tion is executed using virtual machines and each of them can have its capacity increased up to the values presented in Table1.
The virtual machines (VMs) represent compu-tational nodes for the execution of applications. The VMs in our evaluation environment are cre-ated using VMWare tools, which offer us the opportunity to manage the created VMs using our developed monitoring and knowledge man-agement techniques. We avoided using existing Cloud frameworks such as Eucalyptus in setting up our Cloud environment since they have their own management tools. However, we intend to integrate our management tools into such frame-work in the future.
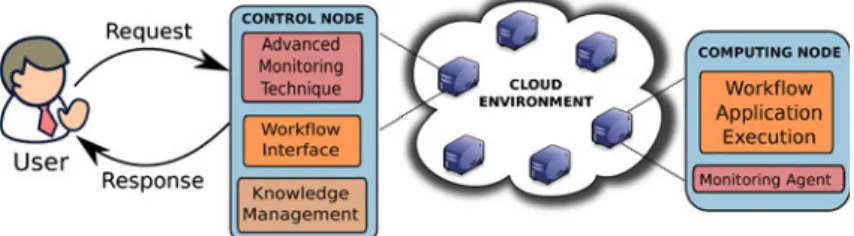
Figure 7 presents an abstracted view of the evaluation testbed exemplifying a control entity node and a computing node. The testbed repre-sents a setup for efficient management of appli-cation execution in a Cloud environment. This testbed is a private Cloud environment used for the evaluation of our implemented research pro-totypes. In this case, the purpose of the testbed is to present a proof of our concept and to demon-strate how workflow application executions can be efficiently managed in a Cloud environment.
On the testbed, a group of nodes act as the control entity. They host the advanced monitor-ing technique, the knowledge management com-ponent, and provides an interface for deploying workflow applications requested by the users. The testbed is designed with scalability in mind. The
control nodes are de-centrally distributed in order to be capable of monitoring large scale Cloud environment. The computing nodes are used for the execution of the workflow applications. In this group of nodes, we only embed light-weight agents for monitoring and executing the resource allocation decisions. Thus, the computing nodes are focused on executing the applications thereby relieving them from the complexities of analyz-ing the monitored information. This increases the efficiency and performance of the comput-ing nodes. The control nodes and the computcomput-ing nodes interacts through our designed communica-tion mechanism, which is based on the Java Mes-sage Service (JMS). The communication mecha-nism provides a means of exchanging information such as resource status, monitored values, and synchronization data, among the components in the Cloud environment.
Generally in our private Cloud, each con-trol node is assigned a number of computing nodes, which it processes their monitored infor-mation. Furthermore, the control nodes synchro-nize among themselves based on the available resources to reach the decision of where to deploy further workflow application requests.
The evaluation of our approach in this paper is based on the bioinformatic workflow application TopHat, which was described in Section 2.1. It aligns RNA-Seq reads to mammalian-sized genomes using the ultra high-throughput short read aligner Bowtie [24], and then analyzes the mapping results to identify splice junctions between exons. Furthermore, it uses the Sequence Alignment/Map (SAM) tools in its execution. SAM tools provide various
Fig. 7 Evaluation tEstbed: color online
utilities for manipulating alignments in the SAM format, including sorting, merging, indexing, and generating alignments in a per-position format [25].
We analyzed a set of RNA-Seq data using the
TopHat workflow application, and the achieved
results are presented in the next sections. 5.2 Resource Level Monitoring Results
As outlined in Section4.1, we use the LoM2HiS framework to monitor the infrastructure re-sources while analyzing RNA-Seq data using TopHat workflow application for the duration of about three hours. We monitored the status of the resource metrics CPU, memory and storage at runtime with a measurement interval of one minute. The achieved results are presented in Figs. 8, 9, and 10. Note that the monitored re-sults presented are from one of the computational node and not the entire Cloud environment. The resource consumption behaviours on the different computational nodes are similar, thus, we present the results from one node for simplicity and ease of understanding our approach.
The aim of the monitoring processes is to timely detect the unavailability of computational resources. To realize this, LoM2HiS utilizes mon-itoring agents to monitor the resource status and compares them against the threat thresholds, which are defined values to signalize the short-age of computational resources at runtime. The threat thresholds can be dynamically or stati-cally defined. In this paper, the knowledge man-agement dynamically updates the initial defined threat thresholds.
Figure8presents the monitored results for the CPU usage. From the results, it can be observed that the TopHat workflow application in some time intervals is very CPU intensive. For example from the execution time 52 to 80. These time inter-vals where the CPU usage is 100 % are the critical ones that need to be managed. The LoM2HiS framework is configured in this case with a threat threshold value of about 80 % CPU utilization. This means, once the CPU utilization exceeds this threshold, it sends a notification message to the knowledge management to provide preventive ac-tions to avoid reaching 100 % utilization, because at that point the performance of TopHat degrades and there might be risk of failures.
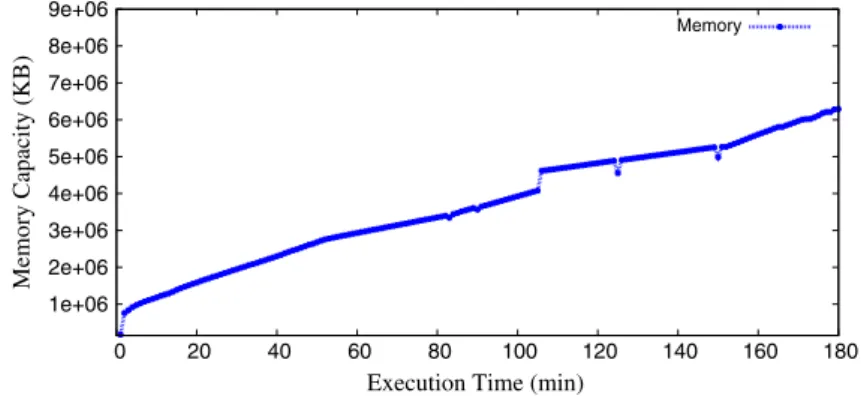
The monitored results of the memory usage are depicted in Fig. 9. As shown in the figure, the memory consumption increases along the execu-tion line of the TopHat workflow applicaexecu-tion. It is difficult to predict the total amount of memory the application might require in the next time inter-val or to successfully complete the data analysis. Thus, we define a threat threshold value that is about 2 GB less than the current allocated mem-ory. That is, once the memory utilization exceeds the threat threshold value, a notification message is sent to the knowledge database for memory resource allocation decisions.
Figure 10 shows the utilization of storage re-source by the TopHat workflow application. Ac-cording to the figure, the storage utilization in-creases along the execution line. In this case, one can notice some jumps in the utilization lines. These jumps can be high depending on the size of the data set to be analysed. Therefore, the threat threshold value for managing storage resource is
Fig. 8 Monitored CPU utilization: color online
20 40 60 80 100 120 0 20 40 60 80 100 120 140 160 180 CPU Usage (%)
Execution Time (min)
Fig. 9 Monitored memory utilization: color
online 1e+06 2e+06 3e+06 4e+06 5e+06 6e+06 7e+06 8e+06 9e+06 0 20 40 60 80 100 120 140 160 180 Memory Capacity (KB)
Execution Time (min)
Memory
set to be about 4 GB less than the current allo-cated storage, in order not to risk failure situations before the knowledge management can react to allocate more storage resources.
Generally, the threat thresholds are defined to accommodate reaction time for the knowledge management so that the resource allocation pro-cedures are carried out early enough before the system runs out of resources.
5.3 Application Level Monitoring Results
In this section, we discuss the application level monitoring results achieved at runtime while ex-ecuting the TopHat workflow application. The results show the behaviour of each system process executing the sub-tasks of the workflow appli-cation in terms of memory resource utilization. Furthermore, we show the result of the amount of temporal storage used by the TopHat workflow application while executing.
Figure 11 presents the results of the memory utilization from selected processes executing the TopHat application sub-tasks. To simplify the re-sults of the application level monitoring, we con-centrate on the processes executing the highest resource consumption sub-tasks. In this regards, the Bowtie and Fix-map-ordering processes are outstanding.
The Bowtie processes are the most expensive in terms of memory resource consumption as de-picted in Fig. 11. According to the results shown on Fig.11, the two Bowtie processes use the high-est amount of memory while actively executing and the memory consumption falls to zero in their passive state. The Fix-map-ordering process is sec-ond in memory consumption level as shown in Fig.11. Once the process comes into active state, its resource consumption jumps from zero to a certain level and gradually makes an increasing curve along the execution line until the process becomes inactive and the consumption level falls back to zero.
Fig. 10 Monitored storage utilization: color
online 15 15.5 16 16.5 17 17.5 18 18.5 19 0 20 40 60 80 100 120 140 160 180 Storage Capacity (GB)
Execution Time (min)
Fig. 11 Process memory utilization: color online
The TopHat process has lower memory re-source consumption level compared to the other two processes as depicted in Fig.11. It is the main process controlling the execution of the other processes. It stays active and consumes resources while the processes executing the sub-tasks are running. It releases the resources and goes into passive state when all the sub-processes are in passive state for example in timeline 25 and 75 in Fig. 11. Furthermore, it is the process that terminates last at the end of the execution.
Note, we also monitored the memory resource consumption of the Java virtual machine run-ning the whole TopHat workflow application as shown in Fig.11. This process consumed the same amount of memory resource as the Bowtie process from the beginning to the end of the execution length. However, this process is not considered as part of the TopHat processes.
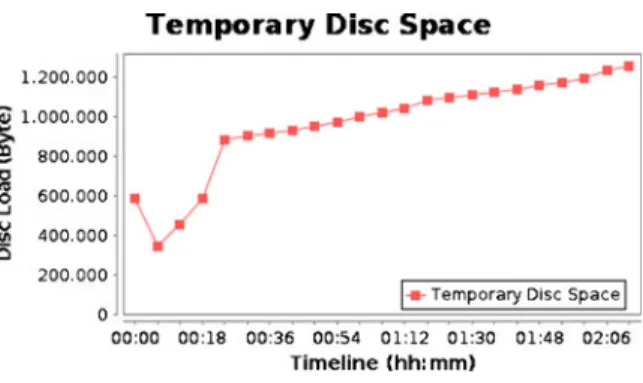
Figure12presents the monitored results of the temporary storage TopHat uses while executing.
Fig. 12 Monitored temporary storage utilization: color
online
This temporary storage usage is due to the tem-porary files written by the workflow application along the execution line, which are cleaned up at the end of the execution. The behaviour of the temporal storage usage increases as more data are being analyzed by the TopHat workflow applica-tion. However, the usage falls to zero at the end of the execution once the workflow application cleans up. The essence of monitoring the temporal storage is to determine the whole amount of stor-age resources required by the TopHat workflow application for seamless execution.
Without the knowledge of the exact temporal storage requirement, one might not efficiently al-locate enough storage resources to support the execution of the workflow application. Because, using only the monitored information from the normal storage utilization can cause poor resource allocation decision in situations where the TopHat is writing lots of temporary files. As seen on Fig.10, there were jumps in the storage consump-tion along the execuconsump-tion line. These jumps are caused due to the temporary storage usage, which the resource monitoring technique is unable to de-tect. This issue causes the definition of large threat threshold value for the management of storage resource. However, the monitoring of the tempo-ral storage addresses this issue and provides the knowledge management with the missing infor-mation to efficiently manage the storage resource. Generally, the application level monitoring complements the resource monitoring with fine-grained monitored information of the applica-tion resource consumpapplica-tion behaviour. Further-more, it supports the knowledge management in defining appropriate values to update the pre-defined threat thresholds. This is evident in the management of the storage resource as can be observed from the monitored results.
In the next section, we discuss how the knowl-edge management deals with the notification mes-sages generated by the monitoring techniques.
5.4 Ensuring Resource Availability
This section shows via simulations how the knowledge management approach reacts to the monitored data and enables seamless workflow
application execution, as well as an economically efficient usage of resources.
To demonstrate this approach, we first define the SLAs shown in Table2for the workflow appli-cation to specify the amount of available resources on the virtual machine required for the seamless execution of the workflow. For CPU power, we convert CPU utilization into Million Instructions Per Second (MIPS) based on the assumption that an Intel Xeon(R) 3 GHz processor delivers 10,000 MIPS for 100 % resource utilization of one core, and linearly degrades with CPU utilization.
Additionally, we analyze the Resource
Alloca-tion Ef f iciency (RAE) of the various simulaAlloca-tions,
where we relate violations and utilization. The basic idea is that RAE should be equal to utiliza-tion (100%−w, wherewstands for wastage, see below) if no violations occur ( p=0%, where p stands for penalty, see below) or equal to zero, if the violation rate is at 100 %, and follow a linear decrease in between. Thus, we define
RAE= (100−w)(100−p)
100 . (3)
Furthermore, we define a more general ap-proach also taking into account the cost of actions with a generic cost function that maps SLA viola-tions, resource wastage, and the costs of executed actions into a monetary unit, which we describe as Cloud EUR. The essence of this monetary unit is to device an independent means of comparing the various cost values realized in the different evaluation scenarios. There is no pricing model behind it.
The cost values in our generic cost function are defined based on the specified SLA penalties for violating the agreed SLA terms, the consequence of resource wastage, and the effects of the correc-tive actions to avoid SLA violations on the Cloud
Table 2 TopHat SLA
Service level objective (SLO) name SLO value
CPU power ≥20000 MIPS
Memory ≥8192 MB
Storage ≥19456 MB
system performance. Equation (4) presents the cost function
c(p, w,c)= r
pr(pr)+wr(wr)+ar(ar), (4)
where, the resource r, pr(pr): [0,100] →R+
defines the costs due to the penalties that have to be paid according to the relative number of SLA violations (as compared to all possible SLA violations) pr;wr(wr): [0,100] →R+ defines the
costs due to unutilized resources wr; and ar(ar):
[0,100] →R+the costs due to the executed num-ber of actions ar(as compared to the number of all possible actions).
The evaluations of our knowledge management techniques are done in three simulation cate-gories, where we setup and configure our VM resources differently to manage the agreed SLA objectives and prevent / correct SLA violation situations. The categories are described as follows: 1. In the first category (Scenario 1) we assume a static configuration with a fixed initial re-source configuration of the VMs. Normally, when setting up such a testbed as described in Section5.1, an initial guess of possible re-source consumption is done based on early monitoring data. From this configuration, we assume quite generous resource limits. The first ten measurements of CPU, memory, and storage lie in the range of [140, 12,500] MIPS, [172, 1,154] MB, [15.6, 15.7] GB, respectively. So we initially configured our VM with 15,000 MIPS, 4,096 MB, and 17.1 GB, respectively. 2. The second category subsumes several
sce-narios, where we apply our knowledge man-agement approach to manage the initial VM configurations as described in the first cate-gory. The eight scenarios in this category de-pend on the chosen Threat Thresholds (TTs). According to Table3, we define these scenar-ios as Scenario 2.1, 2.2, . . . , 2.8, respectively. In these scenarios, we investigate low, middle, and high values for T Tr
low and T Thighr , where T Tr
low∈ {30 %, 50 %, 70 %} and T Thighr ∈
Table 3 8 Simulations Scenarios for T Tlowand
T Thigh
Scenarios
1 2 3 4 5 6 7 8
T Tlow 30 % 30 % 30 % 50 % 50 % 50 % 70 % 70 %
T Thigh 60 % 75 % 90 % 60 % 75 % 90 % 75 % 90 %
above. We combine the TTs to form eight different scenarios as depicted in Table3. 3. In the third category (Scenario 3), we consider
a best case scenario, where we assume to have an oracle that predicts the maximal resource consumption values, which can be used to statically configure the virtual machines. The essence of this third scenario is to demonstrate the better resource utilization achievable by our knowledge management approach com-pared to peak provisioning.
Figure13a, b and c present the violations, uti-lization, as well as the number of reconfiguration actions, respectively, for every SLA parameter (together with an average value) in the different scenarios. Generally, the bars in the figures are naturally ordered beginning from Scenario 1, over Scenarios 2.1, . . . , 2.8, ending with Scenario 3. In Scenario 1, we have static resource configuration and the number of violations in this scenario reaches 41.7 % for CPU and memory, and 49.4 % for storage, which leads to an average of 44.3 %. Thus, we experience violations in almost half of the cases. This is especially crucial for parameters
memory and storage, where program execution
could fail, if it runs out of memory or storage, whereas for a violation of the CPU parameter, we would “only” delay the successful termination of the workflow application. We excluded the results of Scenarios 1 and 3 from Fig. 13a for better visibility in order to focus on the achieved results of scenario 2.*, which applies the knowledge man-agement approach to prevent or correct the SLA violations.
With the Scenarios 2.* in the second category, we can reduce the SLA violations to a minimum. We completely avoid violations for storage in all sub-scenarios, as well as for memory in all but one sub-scenario. Also CPU violations can be reduced to 0.6 % for Sub-scenarios 2.1 and 2.4,
and still achieve a maximum SLA violation rate of 2.8 % with Scenario 2.8. The average SLA violation rate can be lowered to 0.2 % in the best
(a) Violations
(b) Utilization
(c) Reconfiguration actions
Fig. 13 Violations, utilization and reconfiguration actions for ten knowledge management scenarios using bioinfor-matic workflow: color online
case. Scenario 3, of course, shows no violations. However, it is unlikely to know the maximum resource consumption before workflow execution. The resource utilization is clearly higher when a lot of violations occur due to out-usage of available resources. Thus, Scenario 1 naturally achieves high resource utilization because when a parameter is violated, it means the resource is already fully used up, but more of the re-source would be needed to fulfill the require-ments. On the opposite, Scenario 3 naturally achieves low utilization, as a lot of resources are over-provisioned. Scenarios 2.* achieve a good utilization that is on average in between of the two extremes and ranges from 70.6 % (Scenario 2.1) to 86.2 % (Scenario 2.8). Furthermore, we observe some exceptions to this “rule” when considering individual parameters. So, e.g., for memory, we achieve a utilization of 85.0 % with Scenario 2.8 or 80.0 % with Scenario 2.6, which is higher than the utilization in Scenario 1 (77.4 %). The same is true for CPU utilization rates of 85.5 % as compared to 84.3 % for the Scenario 1 and 2.8, respectively. Only in the case of storage, the utilization of all except in one of the Scenarios 2.*, achieved 85.9 % utilization, which is smaller than that of Scenario 3 (90.1 %).
The clear advantage of Scenarios 2.* is that they do not run into any crucial SLA violation (ex-cept for Scenario 2.3), but they achieve a higher resource utilization as compared to Scenario 3. Regarding the reallocation actions, of course, Sce-nario 1 and 3 do not execute any. This is only done for Scenarios 2.* as shown in Fig.13c. More-over, with the knowledge management in Sce-narios 2.*, the amount of executed reallocation actions for most scenarios stays below 10 %. Only Scenario 2.7 executes actions in 19.8 % of the cases on average of the time. Nevertheless, five out of eight scenarios stay below 5 % on average. These results show that our knowledge manage-ment approach is scalable and less intrusive on the overall system performance. That is, it does not cause lots of overheads, which might degrade the system performance.
When it comes to the overall costs of the sce-narios (cf. Fig.14a), all 2.* scenarios approach the result achieved by the best case scenario 3. The cost of SLA violations in Scenario 1 sums up to
(a) Cost
(b) Resource Allocation Efficiency
Fig. 14 Resource allocation efficiency and cost for ten knowledge management scenarios using bioinformatic workflow: color online
4493.6 Cloud EUR, and is omitted on Fig. 14a in order to achieve better visibilities of the other cost results because including this result would change the scaling on the figure due to its large value as compared to the other obtained cost values. Furthermore, the lowest cost is achieved using Scenario 2.6, which is even lower than the cost for Scenario 3. This is possible, because Sce-nario 2.6 achieves a very good resource utiliza-tion and low SLA violautiliza-tion rate with a very few number of reallocation actions. Also resource al-location efficiency for Scenarios 2.* as shown in Fig. 14b achieves remarkably better results than for Scenario 1 (RAE of 48.2 %). Nevertheless, all scenarios of the second category achieve a better RAE as compared to that of Scenario 3 (69.3 %). Thus, we conclude that by using the suggested knowledge management strategy, we can avoid most costly SLA violations, and therefore, facil-itate application execution while improving the resource usage efficiency as demonstrated with
the workflow application. All this can be achieved with a very low number of time- and energy con-suming VM reallocation actions as shown in many of the knowledge management scenarios.
Based on these observations, we conclude that by using the suggested Cloud management in-frastructure techniques, we can guarantee the per-formance and successful completion of workflow applications. Furthermore, we can efficiently manage resources to avoid considerable wastage, extra maintenance costs, and CO2 emissions due
to the unnecessary energy consumption of unused resources.
6 Related Work
Currently, a number of workflow systems exist that are applicable in the area of life sciences. While these workflow systems are valuable in the explorative analysis of data, they do not provide resource management capabilities to ensure the performance and successful completion of many modern, more demanding workflow applications.
Hull et al. [17] discuss the Taverna system, a workbench designed to build workflows for bioin-formatics. It is a Java application that is capa-ble of building complex workflows, which can access both remote and local processors of dif-ferent kinds, launch the execution of workflow applications, and display different types of re-sults. The strength of this system lies in its simple interface and its flexibility to support access to services via different types of interfaces. However, it does not provide efficient resource management capabilities.
Altintas et al. [2] propose Kepler, an open source system based on the Ptolemy II tool from the University of California Berkeley. Ptolemy can combine concurrent components that are independent and autonomous through a well-defined model of computation that governs all interactions and thus, guarantees the correct op-eration of the system. The independent compo-nents can be used to achieve different goals for workflow applications. But it does not facilitate adequate resource management to support the execution of the workflow applications.
Deelman et al. [6] present Pegasus, a workflow manager that supports automatic conversion of high-level workflow descriptions to executable workflows and enacts them in a Condor-based Grid infrastructure. It consist of a Metadata Cata-logue Service (MCS) and the implementations of workflow reduction, resource selection, and task clustering to optimize execution performance. Pe-gasus implements both data and computational abstractions and can therefore, perform some management functions but suffers from a lack of openness and standardization.
Other advanced workflow systems including Galaxy [14] and Wildfire [41] offer an easy way to access local and remote resources and perform automatic analyses to test hypotheses or process data. However, many well known challenges, in the field of data integration and workflow systems for bioinformatics [12,13,26], are still not solved such as transferring large amount of data, which might incur high cost of transfer and storage on remote locations.
Despite their usabilities, the above mentioned workflow systems lack the capabilities of on-line resource monitoring of application execution as obtainable in Cloud environments. Moreover, they are not capable of dynamic resource manage-ment (i.e., dynamically allocating and deallocat-ing resources to applications) utilizdeallocat-ing knowledge databases as basis for decision making.
7 Conclusion and Future Work
With the recent fast development of high-throughput technologies in the life sciences, huge amounts of data are being generated and stored in different databases. The analysis of these large-scale data sets by scientists in a search for biomed-ically interesting patterns presents serious tech-nical challenges. Scientific workflow applications can be instrumental in addressing these chal-lenges, provide a certain degree of automation, and thus, empower advanced more complex stud-ies in the life sciences.
The analysis of scientific data using workflow applications is computationally intensive and requires adequate availability of resources to achieve satisfactorily high performance and
suc-cessful execution completion. Lack of compu-tational resources disrupts the analysis process, causing a waste of time and money. Traditional computational environments consist of static lim-ited resources and are, therefore, not well sulim-ited for the execution of large workflow applications. Cloud computing is proving to be a valuable complement to these traditional static compute facilities. Cloud technology promises scalable and on-demand resource provisioning. With this tech-nology, it is now possible to dynamically allocate resources to workflow application executions.
In this paper, we have presented a novel Cloud management infrastructure consisting of a resource level-, application level monitoring techniques, and a knowledge management strat-egy. The monitoring techniques are responsible for monitoring Cloud environments where scien-tific workflow applications are being executed, in order to determine their resource consumption behaviours, the status of the computational re-sources, and the performance of the applications. The knowledge management uses the monitored information to dynamically allocate resources at runtime to the workflow applications. We dis-cussed in detail the design of these Cloud manage-ment infrastructure techniques and their applica-bility to support workflow application execution.
We have evaluated our approach using the well-known TopHat workflow application to an-alyze RNA-Seq data for a duration of about three hours, through which we showed how resource bottleneck are detected at runtime and how the knowledge management could dynamically allo-cate more resources in such cases. Based on our evaluations, we can conclude that we successfully utilized the Cloud management infrastructure techniques to support the execution of a scientific workflow application in order to guarantee its performance goals and successful completion.
In the future, we intend to integrate these Cloud management infrastructure techniques into workflow systems to achieve self-manageable au-tonomic systems that are capable of managing computational resources for data analysis, aiming to fully maximize the power of computational methods and mining of experimental data in the life sciences by means of workflow applications.
Acknowledgements This work is supported by the Vienna Science and Technology Fund (WWTF) under the grant agreement ICT08-018 Foundation of Self-governing ICT Infrastructures (FoSII). PPL and DPK gratefully ac-knowledge support by the Vienna Science and Technology Fund (WWTF), Baxter AG, the Austrian Institute of Tech-nology, and the Austrian Centre of Biopharmaceutical Technology. This paper is a substantially extended version of a WORKS11 paper [9].
References
1. ActiveMQ: Messaging and integration pattern provider. http://activemq.apache.org/. Accessed 4 April 2013
2. Altintas, I., Berkley, C., Jones, E.M., Ludascher, B., Mock, S.: Kepler: an extensible system for design and execution of scientific workflows. In: 16th International Conference on Scientific and Statistical Database Man-agement, pp. 423–424 (2004)
3. Buyya, R., Yeo, C.S., Venugopal, S., Broberg, J., Brandic, I.: Cloud computing and emerging IT plat-forms: vision, hype, and reality for delivering comput-ing as the 5th utility. Futur. Gener. Comput. Syst. 25(6), 599–616 (2009)
4. Cantacessi, C., Jex, A.R., Hall, R.S., Young, N.D., Campbell, B.E., Joachim, A., Nolan, M.J., Abubucker, S., Sternberg, P.W., Ranganathan, S., Mitreva, M., Gasser, R.B.: A practical, bioinformatic workflow sys-tem for large data sets generated by next-generation sequencing. Nucleic Acids Res. 38(17), e171 (2010) 5. Comuzzi, M., Kotsokalis, C., Spanoudkis, G.,
Yahyapour, R.: Establishing and monitoring SLAs in complex service based systems. In: Proceedings of the 7th International Conference on Web Services (ICWS’09) (2009)
6. Deelman, E., Singh, G., Su, M.-H., Blythe, J., Gil, Y., Kesselman, C., Mehta, G., Vahi, K., Berriman, G.B., Good, J., Laity, A., Jacob, J.C., Katz, D.S.: Pegasus: a framework for mapping complex scientific workflows onto distributed systems. Sci. Program. 13, 219–237 (2005)
7. Emeakaroha, V.C., Brandic, I., Maurer, M., Dustdar, S.: Low level metrics to high level slas - lom2his frame-work: bridging the gap between monitored metrics and sla parameters in cloud environments. In: 2010 Inter-national Conference on High Performance Computing and Simulation (HPCS), pp. 48–54 (2010)
8. Emeakaroha, V.C., Calheiros, R.N., Netto, M.A.S., Brandic, I., De Rose, C.A.F.: DeSVi: an architec-ture for detecting SLA violations in cloud comput-ing infrastructures. In: Proceedcomput-ings of the 2nd Interna-tional ICST Conference on Cloud Computing (Cloud-Comp’10) (2010)
9. Emeakaroha, V.C., Labaj, P.P., Maurer, M., Brandic, I., Kreil, D.P.: Optimizing bioinformatics workflows for data analysis using cloud management techniques.
In: Proceedings of the 6th Workshop on Workflows in Support of Large-Scale Science, WORKS ’11, pp. 37–46. ACM, New York, NY, USA (2011) 10. Emeakaroha, V.C., Netto, M.A.S., Calheiros, R.N.,
Brandic, I., Buyya, R., De Rose, C.A.F.: Towards au-tonomic detection of sla violations in cloud infrastruc-tures. Futur. Gener. Comput. Syst. 28(7), 1017–1029 (2012)
11. Ferretti, S., Ghini, V., Panzieri, F., Pellegrini, M., Tur-rini, E.: Qos-aware clouds. In: 2010 IEEE 3rd Inter-national Conference on Cloud Computing (CLOUD), pp. 321–328 (2010)
12. Goderis, A., Li, P., Goble, C.: Workflow discovery: the problem, a case study from e-science and a graph-based solution. In: IEEE International Conference on Web Services, pp. 312–319 (2006)
13. Goderis, A., Sattler, U., Lord, P., Goble, C.: Seven bot-tlenecks to workflow reuse and repurposing. In: Gil, Y., Motta, E., Benjamins, V., Musen, M. (eds.) Semantic Web - ISWC 2005. Lecture Notes in Computer Science, vol. 3729, pp. 323–337. Springer, Berlin/Heidelberg (2005)
14. Goecks, J., Nekrutenko, A., Taylor, J., and The Galaxy Team: Galaxy: a comprehensive approach for support-ing accessible, reproducible, and transparent computa-tional research in the life sciences. Genome Biol. 11(8), R86 (2010)
15. Halligan, B.D., Geiger, J.F., Vallejos, A.K., Greene, A.S., Twigger, S.N.: Low cost, scalable proteomics data analysis using amazons cloud computing services and open source search algorithms. J. Proteome Res. 8(6), 3148–3153 (2009)
16. Hollingsworth, D.: The workflow reference model. In:: Technical Report (WFMC- TC00-1003) Workflow Management Coalition (1995)
17. Hull, D., Wolstencroft, K., Stevens, R., Goble, C., Pocock, M.R., Li, P., Oinn, T.: Taverna: a tool for build-ing and runnbuild-ing workflows of services. Nucleic Acids Res. 34(Suppl 2), W729–W732 (2006)
18. JFree.org: Jfreechart. http://www.jfree.org/jfreechart/. Last Access: 4 Apr 2013
19. JMS: Java messaging service. http://java.sun.com/ products/jms/. Last Access: 4 Apr 2013
20. Kephart, J.O., Chess, D.M.: The vision of autonomic computing. IEEE Comput. 36(1), 41–50 (2003) 21. Koller, B., Schubert, L.: Towards autonomous SLA
management using a proxy-like approach. Multiagent Grid Syst. 3(3), 313–325 (2007)
22. Kreil, D.P.: From general scientific workflows to specific sequence analysis applications: the study of compositionally biased proteins. Ph.D. thesis (2001) 23. Łabaj, P.P., Leparc, G.G., Linggi, B.E., Markillie, L.M.,
Wiley, H.S., Kreil, D.P.: Characterization and improve-ment of RNA-Seq precision in quantitative transcript expression profiling. Bioinformatics 27(13), i383–i391 (2011)
24. Langmead, B., Trapnell, C., Pop, M., Salzberg, S.: Ul-trafast and memory-efficient alignment of short DNA sequences to the human genome. Genome Biol. 10(3), R25 (2009)
25. Li, H., Handsaker, B., Wysoker, A., Fennell, T., Ruan, J., Homer, N., Marth, G., Abecasis, G., Durbin, R., 1000 Genome Project Data Processing Subgroup: The sequence alignment/map format and samtools. Bioin-formatics 25(16), 2078–2079 (2009)
26. Linke, B., Giegerich, R., Goesmann, A.. Conveyor: a workflow engine for bioinformatic analyses. Bioinfor-matics 27(7), 903–911 (2011)
27. Massie, M.L., Chun, B.N., Culler, D.E.: The Gan-glia distributed monitoring system: design, implemen-tation and experience. Parallel Comput. 30(7), 817–840 (2004)
28. Maurer, M., Brandic, I., Emeakaroha, V.C., Dustdar, S.: Towards knowledge management in self-adaptable clouds. In: IEEE 2010 Fourth International Work-shop of Software Engineering for Adaptive Service-Oriented Systems, Miami, USA (2010)
29. Maurer, M., Brandic, I., Sakellariou, R.: Simulat-ing autonomic sla enactment in clouds usSimulat-ing case based reasoning. In: ServiceWave 2010: Proceedings of the 2010 ServiceWave Conference, Ghent, Belgium (2010)
30. Maurer, M., Brandic, I., Sakellariou, R.: Enacting slas in clouds using rules. In: Proceedings of Euro-Par 2011 (2011)
31. Maurer, M., Brandic, I., Sakellariou, R.: Adaptive resource configuration for cloud infrastructure man-agement. Futur. Gener. Comput. Syst. 29(2), 472–487 (2013)
32. Merchant, N., Hartman, J., Lowry, S., Lenards, A., Lowenthal, D., Skidmore, E.: Leveraging cloud in-frastructure for life science research laboratories: a generalized view. In: International Workshop on Cloud Computing at OOPSLA09, Orlando, USA (2009) 33. Nurmi, D., Wolski, R., Grzegorczyk, C., Obertelli, G.,
Soman, S., Youseff, L., Zagorodnov, D.: The Eucalyp-tus open-source cloud-computing system. In: Proceed-ings of the 9th International Symposium on Cluster Computing and the Grid (CCGRID’09) (2009) 34. Pennisi, E.: Will computers crash genomics? Science
331(6018), 666–668 (2011)
35. Robinson, G.E., Banks, J.A., Padilla, D.K., Burggren, W.W., Cohen, C.S., Delwiche, C.F., Funk, V., Hoekstra, H.E., Jarvis, E.D., Johnson, L., Martindale, M.Q., Rio, C.M., Medina, M., Salt, D.E., Sinha, S., Specht, C., Strange, K., Strassmann, J.E., Swalla, B.J., Tomanek, L.: Empowering 21st century biology. BioScience 60(11), 923–930 (2010)
36. Rochwerger, B., Breitgand, D., Levy, E., Galis, A., Nagin, K., Llorente, L., Montero, R., Wolfsthal, Y., Elmroth, E., Caceres, J., Ben-Yehuda, M., Emmerich, W., Galan, F.: The RESERVOIR model and architec-ture for open federated cloud computing. IBM J. Res. Dev. 53(4), 535–545 (2009)
37. Romano, P.: Automation of in-silico data analysis processes through workflow management systems. Brief. Bioinform. 9(1), 57–68 (2007)
38. Smedley, D., Swertz, M.A., Wolstencroft, K., Proctor, G., Zouberakis, M., Bard, J., Hancock, J.M., Schofield, P.:
Solutions for data integration in functional genomics: a critical assessment and case study. Brief. Bioinform. 9(6), 532–544 (2008)
39. Stein, L.D.: Towards a cyberinfrastructure for the bio-logical sciences: progress, visions and challenges. Nat. Rev. Genet. 9(9), 678–688 (2008)
40. Stoegerer, C., Brandic, I., Emeakaroha, V.C., Kastner, W., Novak, T.: Applying availability slas to traffic man-agement systems. In: Proceedings of the IEEE Intelli-gent Transportation Systems Conference (ITSC 2011) (2011)
41. Tang, F., Chua, C.L., Ho, L.-Y., Lim, Y.P., Issac, P., Krishnan, A.: Wildfire: distributed, grid-enabled workflow construction and execution. BMC Bioin-forma. 6(69) (2005). http://www.biomedcentral.com/ 1471-2105/6/69
42. Tiwari, A., Sekhar, A.K.: Workflow based framework for life science informatics. Comput. Biol. Chem. 31(5– 6), 305–319 (2007)
43. Trapnell, C., Pachter, L., Salzberg, S.L.: Tophat: dis-covering splice junctions with RNA-Seq. Bioinformat-ics 25(9), 1105–1111 (2009)