Program Visualization – The State of the Art
Sharon Ellershaw and Michael Oudshoorn Department of Computer Science
University of Adelaide Adelaide S.A. 5005
Abstract
Program visualization focuses on the graphical representation of an executing program and its data. The information is presented in a form designed to enhance both the understanding and productivity of the programmer through the efficient use of the human visual system. The programmer is able to observe patterns of behaviour within the executing code and rapidly detect a departure from the expected behaviour patterns in an accurate way. However, depending on the programming paradigm and architectural platform that is utilized, the variety and manner in which information is best presented varies somewhat.
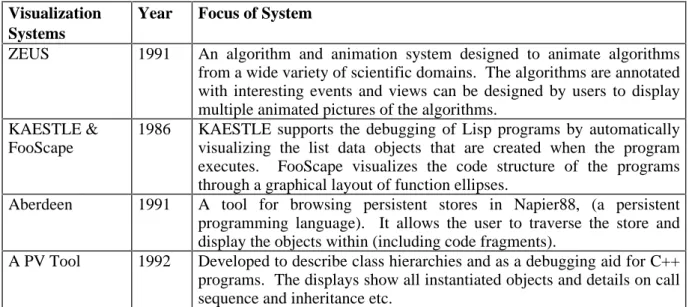
This paper attempts to analyse the visualization requirements for a variety of programming paradigms and architectural platforms, detailing the paradigm and platform specific needs, in addition to general visualization requirements that extend across paradigms and platforms. A survey of current visualization systems is presented which examines each system in detail and categorizes it by the programming paradigms/platform that it is designed to visualize. A comparison of the various visualization systems is also presented and the achievements and failures of current visualization technology are highlighted and commented upon.
1. Introduction
It is essential that programmers are able to quickly and clearly understand the code that they are working on, regardless of whether they wrote it or not. Without a clear picture of how the executing code behaves the task of debugging a program, and assessing its efficiency, is extremely difficult. Graphical visualization systems have been designed in an attempt to support programmers in these undertakings, by making effective use of the efficient human visual system to process information that is presented in a graphical form. When large volumes of data or text are to be understood, it is often the case that a simple picture captures the important aspects in a readable and elegant manner, allowing users to quickly and accurately detect any variations from expected behaviour patterns and values.
The type of information a programmer requires to enhance understanding of a program differs greatly depending on the type of programming paradigm employed and the execution architecture. For example, information concerning process allocation and processor utilization is relevant in a visualization system targeted at concurrent programming languages executed on a multiprocessor or distributed architecture, whereas such information is irrelevant to a visualization system targeted towards sequential languages running on a single processor machine. However, all programming systems benefit from graphical displays of program data structures that allow for the ready identification of trends and patterns by the programmer. As a result of the vast range of needs, program visualization systems tend to vary a great deal in what visualizations are offered to the user and are, in general, targeted towards a specific subset of the requirements of the programmer.
In this paper, we examine six different programming paradigms and three different architectural platforms of execution. The different types of information useful to the programmer are discussed and the visualization requirements specific to each paradigm and platform are detailed. Section 2 clarifies some terminology used throughout the paper. The needs of various programming paradigms are discussed in Section 3, and Section 4 examines examples of current visualization systems in some detail, noting the paradigms and/or architectures that each attempts to visualize. The achievements and failures of each system are also considered. The paper concludes with a summation of the results achieved to date by the program visualization community and of the work that is yet to be done.
2. Terminology
The semantics of various terms involved in the visual display of programs and their data is often unclear. Visual programming, programming by example, scientific visualization and program visualization are terms which are used but often confused. We provide our definition of each of these terms in this section.
2.1. Program Visualization
Program visualization is the application of graphical transformations to an executing program to enhance the reader’s understanding of that program. Visual representations of run-time data and execution sequences can provide users with invaluable information in many aspects of program development and execution, such as debugging or comparing different algorithms for efficiency and correctness. Employing modern workstation technology, system designers are able to use graphical applications that are both computation and storage intensive with some degree of freedom. Consequently, large volumes of information can now be presented in forms that can be assimilated quickly, and with ease, by the human visual system.
Many different aspects of program execution may be captured by a visualization system. These include the dynamic visualization of code, illustrating the dynamic call chain; displaying the changing values and structures of program entities within an executing program; and detailing the hardware utilization (and process overhead, when dealing with concurrent programs). Simple graphs and bar charts are common graphical representations used to convey this information, while the use of sound and color is emerging. All visualization systems are unique, with the information that they provide to the user varying in both context and presentation. The majority of visualization systems are targeted towards particular programming languages and the visualizations that are produced reflect this specialization. Program visualization has rapidly emerged as an important field in computer science and research is being conducted into this area globally [1-11].
2.2. Visual Programming
Visual programming differs from conventional programming in that a program is entered through a two-dimensional graphical interface rather than the common one-dimensional textual interface [12]. These graphical pictures are parsed by recognizing basic graphical elements such as circles and lines from the input set and combining these simple elements into higher-level structures, eventually building up a suitable data structure to represent the entire program. The concept of a visual language includes input through languages such as conventional flow charts, PERT-charts, entity-relationship diagrams, state charts, electric circuit diagrams, musical notation, structural-chemical formulae, and mathematical equations [13]. Visual languages aspire to allow non-programmers to create complex programs with little training in the science of programming. Early visual language systems were aimed at a specific application area such as music or chemistry, rather than general programming.
Visual languages are becoming more realizable as technology improves and, hence, work in the field is becoming increasingly widespread. This has resulted in workshops such as the IEEE Workshop on Visual Languages, which have been conducted annually since 1985. A visual version of the Prolog programming language, called visual Prolog[13], has been developed, as has Pictorial Janus [14], a visual version of the concurrent logic programming language Janus.
The field of visual programming overlaps with that of program visualization in that a graphical representation of a program will, in all likelihood, improve the programmers understanding of the program [9]. Importantly, visual programming also provides a graphical basis from which visualizations of the programs execution may be derived. This requires a cross visualization system incorporating both program visualization and visual programming. Pictorial Janus is an attempt at such a system.
2.3. Scientific Visualization
Scientific visualization is distinct from program visualization in that it deals solely with the graphical representation of scientific data. Due to the large volumes of data typically generated by scientific computing (e.g. satellite data), users are only able to view and understand a small fraction of the data at any one time. Scientific visualization attempts to convert this deluge of data into color images, in order to convey the information produced to the user in a manner that can be easily assimilated. Research into scientific visualization is being conducted globally and a summation of research work currently being undertaken in some of the major supercomputing centers in the United States is presented in a special issue of IEEE Computer [14-19]. Examples of the type of information visualized within these projects are:
• visualizations of numerical simulations of a gas jet penetrating a quiescent medium [15];
• 3D rendering of wind tunnel calculations, and semitransparent volume rendering of the nucleus of a human cell [16];
• visualization of global climatic effects of increased greenhouse gasses [17]; and • visualization of ocean currents [19].
A summary of the long and short-term needs of both designers and users of scientific visualization systems is presented by Defanti et al [20]. Scientific areas of research requiring visualization are presented and the software and hardware tools needed to construct appropriate visualization systems are detailed. It is important that scientific visualization systems progress, if we are to continue to make significant progress in many scientific fields. As stated by Nielson et al [21], future visualization systems need to be modular in design and facilitate user interaction in the modelling and viewing of the data set visualized. It is also very important for the systems to be both extensible and user configurable. Only in this way can scientific visualization systems attempt to satisfy the wide range of needs of computational scientists and engineers.
3. Program Visualization Paradigms
Program visualization is the focus of this paper. In this section we consider the type of information required by the programmer based on the programming paradigm and the architectural structure used.
When considering visualization at a language level, we abstract over the execution architecture, and concentrate on visualizing the conceptual model of the language. The paradigms considered at a language level are:
• imperative programming, • parallel programming,
• functional programming, • object-oriented programming,
• persistent/database programming, and • logic programming.
At an architectural level we consider the requirements for efficient and bug free programming on different architectures, examining processor usage, congestion in message queues, and the like. The architectures we consider are:
• a single processor architecture, • a multiple processor architecture, and
• a distributed heterogeneous network of computers.
Program visualization can also be considered at a system level. Here we refer to visualizations that show the execution of programs from both the conceptual language level and from the perceptive of the concrete architecture of execution. These contrasting views should be shown in conjunction with each other, providing the programmer with displays showing the exact processors on which specific sections of code are executing. This information can then be used by programmers to debug faulty language implementations, to discover processor failures on parallel architectures, or to examine issues pertinent to fault tolerant systems. At the current point in time we know of no visualization systems that attempt to address this issue.
3.1. Program Visualization for Imperative Programming Languages
The imperative programming paradigm forms the basis for a majority of languages available globally, encompassing sequential, parallel, and object-oriented programming. In this section we present the general requirements for a visualization system targeted at languages with an imperative foundation. Details of the additional information that needs to be conveyed in order to visualize the parallel or object-oriented nature of languages are discussed in Sections 3.2 and 3.4 respectively.
Within the imperative programming framework, program visualization systems have the scope to provide the user with information regarding both debugging and performance analysis.
3.1.1. Debugging
In order to debug an imperative program it is necessary to understand the programs fundamental operations and to be able to analyze its behaviour as it is executing. To facilitate this understanding, a visualization system targeted at an imperative programming language would ideally provides both code visualization and data visualization.
Code visualization refers to the presentation of static and dynamic views of program code that show the user the basic structure of the program and its execution sequence. Different techniques, such as pretty-printing and structured code diagrams, can be used to provide the programmer with varying views of the source code. For example, structured code diagrams can be used to show the interactions and dependencies between different sections of the code and display the type of information that is passed through these interactions. The visualizations should be able to abstract over the concrete code, while still providing the user with the freedom of examining the lower level details of computation if desired. The forms of abstraction will vary depending on the program abstractions provided by the language being visualized. For example, instead of displaying each statement in the source code, the visualizations may only display the procedure and function calls. Another level of abstraction may be to only display the various compilation unit headings and the calls that occur between the different compilation units. This visual display of the information
provides the user with a useful insight into the basic structure of the program by presenting the source code in forms that are both readable and understandable.
Dynamic traces of program execution should also be incorporated into these code visualizations. As execution passes through different sections of the code, the current statement, block, or compilation unit, should be indicated and the call path highlighted to the user. With this dynamic trace, the programmer is provided with an insight into details of program execution that may be difficult to capture with just a static display.
Data visualization refers to the presentation of detailed and dynamic views of specified variables, and their structure, within executing code. This allows users to observe the behaviour of the data within the visualized code as the execution sequence progresses, providing invaluable debugging information. As imperative languages generally allow user-defined types and structures, it is important that visualization systems provide some basis for displaying these structures. This may be achieved through default visualizations, produced automatically by an examination of the data structures, or through user-defined visualizations, achieved with a user interface. In addition to visualizing variables within a section of code, it is also important that information regarding the values, passed between these separate code sections, through the parameter passing mechanism be displayed. Due to the multitude of variables typically created within a program, it is important that visualization systems allow the user to specify which data structures are of interest and should be visualized.
In order to produce these views, showing the changing data structures of an executing program, information regarding the values of these data structures must be collected during program execution and processed into a graphical display. These graphical displays can be produced during program execution, by processing the collected information as it is gathered and dynamically changing the displays as processing is achieved. When the data is processed in this manner it is possible for live interaction to occur between the programmer and the instance of the program being executed. Processing of the data into visual displays may also be conducted after the execution of the program is complete. This involves the collection of trace information as the program is executing, and then the post-processing of this information to provide the user with a replay of program execution. This results in views that can be replayed and examined repeatedly at any desired speed, but removes the possibility for the programmer to interact with the execution of the program. Post-processing may also pose a problem when bugs in the source code prevent the program from terminating. Trace data is typically buffered and then dumped to a trace file so when a program fails to terminate it may prove very difficult to capture the trace information relevant to the program failure.
Regardless of the manner in which the information is processed it is important for visualization systems to be able to display the history of values bound to an identifier throughout the program execution. Visualization systems that capture the history of data structures allow programmers to inspect the changes that were made to the data structures at leisure.
In this section we have discussed both code and data visualization and the manner in which they form the basis for efficient debugging and understanding of source code. An important feature that has yet to be mentioned is the ability to correlate the two visualization techniques. A vivid connection needs to be drawn between the views that display the changing data structures and those which highlight the code execution sequence, so that a mapping between data and program constructs is achieved. In this way, programmers are able to clearly see the computational constructs responsible for interesting transformations of specified data structures, and the speed and accuracy with which debugging can be performed are greatly enhanced.
3.1.2. Performance Evaluation
A significant amount of algorithm performance analysis can be achieved by observing the changing data structures of an executing program, and comparing them with the execution of another algorithm designed to achieve the same result. To facilitate this, a program visualization system needs to provide a facility for the comparison of the execution speeds of multiple programs. This can be achieved through the simultaneous execution and visualization of multiple algorithms or through special visualizations that are designed to capture clock information and display the comparisons between the execution speeds of multiple algorithms. Another way in which a programmer could be assisted in analyzing an imperative program for speed and efficiency is through a program visualization system that provides simple complexity analysis information. A static visualization showing a complexity analysis of the source code would enable the programmer to immediately recognize bottlenecks before execution of the code is even attempted. We are currently unaware of any visualization systems that provide this form of program analysis.
3.2. Program Visualization for Parallel Programming Languages
The requirements for visualizing parallel programming languages are basically the same as for their sequential counterparts. However, a few additional requirements do exist. In the field of parallel programming, bugs which result from misinterpretations of concurrency control are common. Thus, visualization systems need to provide the programmer with information that will overcome these misunderstandings. For example, when visualizing parallel segments of code, it is important that the code visualizations produced reflect the parallelism exhibited by the language. As execution progresses, all active parallel sections of the code should be highlighted, regardless of the number of processors actually used for the execution. In this way, it is the parallelism of the language that is visualized and not the parallelism of the architecture. Users are able to see the maximum parallelism possible in the source code from a language point of view, and to follow the parallel execution of their program.
If the relative order of execution between parallel segments of code in a parallel program has an effect on the outcome of the execution, intermittent program bugs may appear and programmers will encounter results that differ between program executions. It is important that when operations in one process can have an effect on an operation in another process, through a chain of interprocess communications and dependencies, that this information is highlighted and displayed to the user [11]. A visualization system that is able to highlight the code sequences within the processes which result in these potential side-effects, and specify the nature of these side-effects, provides the programmer with more, extremely valuable, debugging information.
3.3. Program Visualization for Functional Programming Languages
The requirements for visualizing functional languages are very similar to those of imperative languages. Code and data visualizations, which reflect the structure of the program, and, display the data values applied to the functions during program execution, are required. It is characteristic of functional languages to provide only a very limited set of data objects with simple and regular structures, for example, lists in Miranda or LISP, and arrays in APL. With these simple and regular structures, the task of visualizing the data values themselves is comparatively simple. To show the functional nature of program execution effectively, the visualization system needs to display these data structures in the context of a data flow graph. For each function application that occurs during the execution of a program, the visualization system should display the data values that form the arguments to the function and the data values produced as its result. In this way, the flow of data values from
one function application to another can be viewed by the programmer, and the behaviour of the program can be easily observed. Any parallelism possible during program execution should be reflected in the data flow graphs produced, with function nodes fanning out to indicate the multiple function applications that can be executed in parallel.
3.4. Program Visualization for Object-Orientated Programming Languages
Code reuse is of major importance within the object-oriented programming paradigm and, subsequently, the scope for visualization tools extends beyond debugging, to providing a conceptual understanding of the class libraries that are available to the programmer. In general, these libraries embody a particular model for applications and are composed of many concrete and partially implemented abstract classes that express that model [3]. In order for a programmer to make efficient use of these reusable components, it is necessary to understand their nature, both individually and in combination with other components. Thus, visualization systems targeted at the object-oriented paradigm need to provide visualizations of these class libraries and the class structures defined by the programmer. Visualization of the class structure must provide information regarding the existing class hierarchy and detailed descriptions of each of the individual classes.
In addition to the static information regarding the classes used within a program, it is also necessary to provide the programmer with dynamic information regarding the objects created by the executing program, with a clear indication of the class to which each object belongs. For each active object, the visualization system must show the current method invoked and highlight the ancestor class in which that method is defined. In this way, any ambiguities about the exact method invoked, resulting either from naming clashes due to multiple inheritance, or simple user misinterpretation of the class hierarchy, can be clarified. As methods themselves may simply be a sequence of message calls to other class or instance methods, the execution of a method instance may involve the invocation of a series of other methods. As each method is invoked, it subsequently becomes the active method and must be displayed. Thus, in order to visualize the execution of an instance of a method, a visualization system must display the active message call and link that to the display of the class or object method invoked. In this manner, the execution call chain within the active program is displayed.
As with the visualizations required by imperative programs, it is important that object-oriented visualizations show the objects and their encapsulated state (data structures), and that these values are updated during the execution of the program.
3.5. Program Visualization for Persistent & Database Programming Languages
In a persistent programming language, data objects have the ability to outlive the execution of the program in which they are created, and thus, be persistent [22]. Orthogonal persistence specifies that all data objects may be persistent and that a program manipulates transient and persistent data in the same manner. A representative persistent programming environment is the Napeir88 system [23] which consists of the language Napier88 and a persistent store. In the Napier88 system, long term data objects are stored in the persistent store and are obtained by traversing the store from the root of persistence. All data objects are considered first-class objects, and thus, in addition to traditional data structures, code segments may also reside in the store. When writing persistent programs the programmer must deal with variables, procedures, functions, programs, and types that may be created within the local program, or found in the persistent store. It is extremely important then, that a visualization system targeted at the persistent programming paradigm is able to visually display both long term and transient data. Both forms of data should be displayed dynamically in a manner appropriate to the language, using the code and data visualizations as discussed in Section 3.1. In addition, a dynamic view of the store is also required, showing all objects that reside
in the store and allowing a detailed examination of these objects. The view will need to change dynamically as a program is executed, reflecting any changes to the state of the store, (possibly altered by another program in a multi-user environment) and establishing a link between the dynamic visualizations of the objects and their position within the persistent store. In this way, the long term data used within a program is viewed in the context of the store. When viewing code segments that reside in the store the visualization system needs to be able to present them as dynamic data objects, in addition to being able to view them as code segments that may form part of the program under execution.
In a database programming environment, long term data is kept in the database and the visualization requirements are very similar to those of persistent programming. Views of the database need to be presented, showing the conceptual schema and providing the ability to view the instances of data contained within. During the execution of a query, views showing the tables resulting from each join and subquery made need to be displayed, showing the build up to the final table that results from the query as a whole.
3.6. Program Visualization for Logic Programming Languages
To visualize a logic program effectively, a visualization system needs to present graphical views of the structure of the program and its execution sequence. In depicting the structure of a logic program, a visualization system needs to construct a graph showing all of the individual clauses and relationships defined by the program source code. Alternative clauses that refer to the same relationship must be grouped together in the graph, showing the relationship name and the different clauses available. These alternatives should be presented so that the linear order of clause selection, during unification, is visible from the representation. The representation of individual clauses will differ, depending on whether the clause is a rule or a fact. If the clause is a fact, to unify with that clause simply requires the unification of its parameters with those of the goal parameters. Hence, all that is required is the visualization of its parameters. However, if the clause is a rule, unification of the clause as a whole implies unification with every relationship on its right hand side. Thus, in addition to the display of its parameters, the relationships that form the right hand side of the rule must also be displayed. As the order of unification of relationships, on the right hand side of a clause, affects the unification of the clause as a whole, the sequential ordering of relationships within a clause must be reflected in the graphical display. Recursive calls to relationships in the right hand sides of rules are very common in logic programming and must also be represented in this graphical structure. Research into effective methods to display this information has been conducted by Senay and Lazzeri [10]; details of their visualization system are presented in Section 4.
During execution, the graph depicting the program structure should be dynamically annotated with information showing the successive goal reductions performed to solve a given goal. As clauses are tried they should be highlighted in the graph, showing the user the unsuccessful attempts to solve the goal in addition to a possible successful solution. Due to the recursive nature of logic programs, it is important that the environments of recursive calls are kept clear. Users need to be able to see the multiple goal reductions performed on the each relationship in a clear and unambiguous manner.
3.7. Program Visualization on a Single Processor Architecture
Program visualization systems, that target the visualization of execution sequences on a single processor architecture, have limited uses. The major benefit of such a visualization is to provide the programmer with information on the relative order of execution of parallel programs. In programs where the relative order of execution of parallel sections of code can effect the outcome of the execution, intermittent bugs, and results that differ between program executions often occur. If the system is able to track the non-deterministic choices
made during program execution and hence, have the ability to reproduce any desired execution sequence, an execution run exhibiting a bug can be reproduced. This allows the user to repeatedly modify the source code until the program bug is identified and corrected. Work in this area is applicable to both single and multiple processor architectures and is currently being conducted at the Georgia Institute of Technology [24]. A drawback of this technique is that there is no way to prove that other intermittent bugs, of the same nature, do not exist within the program, or, that in resolving one bug the programmer does not inadvertently introduce a new critical dependency between other parallel sections of the code, resulting in more bugs.
Visualization at an architectural level is also able to provide performance information for programs running on a single processor machine. For example, visualizations that show the CPU utilization as the program progresses, enable the programmer to identify those areas of the source code that are CPU intensive. A measure of the number of I/O accesses against the execution of the source code is also useful, in that it enables the programmer to identify those areas of the code that are I/O intensive and potentially result in an execution bottleneck. With these performance measures, a programmer can determine where, and why, bottlenecks occur in the source code and can make knowledgeable attempts to improve the speed and efficiency of the code.
It should also be noted that visualization systems attempting to measure performance statistics must be extremely careful to compensate for any CPU time and I/O activity undertaken by the visualization system when monitoring the program execution. As has been shown, visualization at an architectural level on a single processor architecture can produce relevant information to programmers for both debugging and performance analysis. However, as the scope of this information is very limited, few visualization systems attempt to visualize execution at this level.
3.8. Program Visualization on a Multiple Processor Architecture
With the rapid development of computer hardware, machines that provide for parallel processing are becoming increasingly common in the world of computer science. The computers vary from those with a few processors running concurrently to massively parallel machines with thousands of processors. Program visualization on systems such as these must deal with this new aspect of program execution providing information about processor utilization and process interaction that can be used for performance analysis purposes.
Significant work has been done in this area and it is the focus of a large number of program visualization systems [4, 6, 7, 25]. Issues such as synchronization and multiple task coordination make it intrinsically more difficult to write and understand correct and efficient parallel programs than it is to write and understand their sequential counterparts. With the help of program visualization systems targeted at visualizing execution from an architectural perspective, large gains can be achieved in producing efficient parallel code.
It is important to emphasize that any visualizations produced by these visualization systems should not rely on a fixed number of processors being used within the execution process. If a program visualization system is to be portable it must take into consideration that many parallel systems now run thousands of processors. Visualizations produced by the systems should be able to scale to encompass this possibility.
When analyzing the performance of parallel programs, the programmer needs information regarding processor utilization and communication. The visualizations need to show the effective use of the processors over program execution and the distribution of work to each of the processors, indicating process migration over the processors. Displays that visualize communication information are helpful in determining the communication frequency, the volume of communication that actually occurs, the overall pattern of communication, and whether or not there is congestion in any of the message queues.
As pointed out by Lehr et al [6], statistics such as these plotted against time, provide insufficient information for a programmer to debug the program quickly and easily. In order for a programmer to locate the source of performance degradation there must also be a visual mapping between the performance data displayed and the computational constructs in the source code that are responsible for them. If this connection is not made programmers will be aware of the performance degradation but have no hint as to its cause.
As has been previously noted, visualization systems measuring performance must be extremely careful not to affect the performance of the program being visualized. On a parallel architecture the execution of the visualization system may result in different loads on the available processors and change the pattern of execution over those processors. Due to this constraint, the majority of available visualization systems choose to only collect trace data during the execution of the program and delay the processing and displaying of this information until execution is complete. In this way, they intrude as little as possible on the program execution pattern. Visualization systems utilizing computation resources which would otherwise be used by the monitored program must at least compensate for this by measuring the time taken by the visualization system and thus, produce estimates of how the computations would perform without these perturbations to performance [6].
3.9. Program Visualization over a Distributed Heterogeneous Network of Computers
Distributed programming involves programming on a collection of computers, linked by a network, to function as a single large parallel computer. PVM (Parallel Virtual Machine) is a software package that supports programming over a heterogeneous network of computers. This is a relatively new form of parallel programming, and it is being jointly developed by Oak Ridge National Laboratory, the University of Tennessee, and Emory University [1]. Users view PVM as a loosely coupled, distributed memory computer programmed in C or Fortran, with message-passing extensions.
Within PVM, the user can access the networks computational resources at three different levels:
• the transparent mode: in this mode sub-tasks are automatically located at the most appropriate sites;
• the architecture-dependent mode: in this mode the user can indicate the specific architecture on which particular subtasks are to execute; and
• the machine-specific mode: in this final mode the user can specify a particular machine for each subtask.
With any network of computers, viewed as a loosely coupled, distributed memory computer, issues such as coarse-grained subtask partitioning and processor allocation are critical, as part of the design of correct and efficient parallel programs. In order to provide assistance to programmers in debugging over such a network, a visualization system must provide views showing the distribution of code across the network and the dependencies that exist between these parallel sections of code, as described in Section 3.8. Displays showing the changes to data structures that occur during the parallel execution in conjunction with these distribution visualizations enable programmers to easily trace bugs to specific segments of code as executed on a specific machine.
To effectively fine tune performance when programming over a heterogeneous network of computers, it is important that the user be able to specify on what machine the various sections of code are to be executed. In support of this, a visualization system would need to provide the user with detailed performance visualizations that show the execution of each section of code, on each of the different machines. In this way, programmers can make knowledgeable choices about the distribution of work over the system and take advantage of the performance abilities of each different kind of architecture. In accordance with the
distributed nature of the programming, it is also important that information regarding network latency and node failures are conveyed to the programmer to enable them to track down communication bottlenecks and execution failures.
4. Example Program Visualization Systems
This section of the paper examines some example program visualization systems in detail. Each system is categorized by the programming paradigms it is designed to visualize. For each of the systems, the provided facilities are detailed and compared with the requirements detailed in Section 3.
4.1. ZEUS
Zeus [2], is a system for algorithm animations and multi-view editing. Development of Zeus commenced in 1988 and it has been stable and in regular use since 1990. Algorithms from the domains of computational geometry, operating systems, hardware design, distributed spanning trees and communication protocols can be animated after being annotated with interesting events.
Zeus is operated through a control panel. The control panel supplies configuration facilities that permit the user to choose the desired algorithm, the views that they wish to open and the data to be provided to the selected algorithm. Other configuration facilities within the control panel allow a snapshot of the state of the system to be written to file, and the restoration of the system from a previously created snapshot. Interpretive facilities, allowing the user to start, stop, and step through an algorithm are also available through the control panel, along with the facility to control the speed of animation. The Zeus interpreter functions in terms of interesting events. Single-stepping through an algorithm will advance execution from one interesting event to the next.
When an annotated algorithm is executed two views are automatically created based on the set of interesting events. The first view displays each event as a symbolic-expression as it is generated and the second view provides a button corresponding to each event, with appropriate
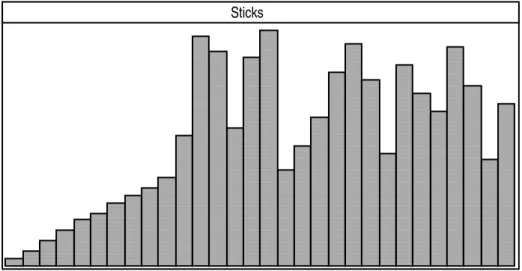
Sticks
Figure 1. User defined animation of selection sort with Zeus.
graphical widgets for specifying parameters to the events. These parameters identify the program data that will be visualized by the views.
Other views can be designed by users to display multiple animated pictures of the algorithms. For example, Figure 1 shows an animation defined by a user which illustrates an
array being sorted with selection sort. In this diagram the X axis shows the range of array elements and the Y axis shows the value stored in each array location. As the algorithm is executed the view is updated to reflect the changing values in the array elements. Views such as this are constructed by graphically demonstrating how an instance of an object used in the view should look and then applying rudimentary library procedures to interpolate changes to object parameters (and hence program data structures) over time.
Zeus works by running a preprocessor over a file of events – specified as procedure signatures – and generating definitions of annotated algorithms and view classes. Procedures are also created for dispatching information between algorithms and views. When an executing algorithm encounters an event, the event procedure forks a thread for each view animating the event. Each such thread then invokes the appropriate method to update that view using the parameter values of the event. When the event procedure terminates, control is returned to the executing algorithm.
In addition to updating views during the execution of an algorithm, Zeus allows the user to change data values used by the algorithms. The views themselves may be annotated with feedback methods that can be invoked by the user. When this occurs the old data values of the algorithm are updated with the updated user supplied values and this change is then broadcast to all views. In this way, all views are updated with the new values.
In summary, Zeus provides a very good foundation for animating algorithms at a language visualization level. Programmers can construct views that show the progress of algorithm execution, and there is scope for user interaction with the algorithm by modifying data values during its execution. The main drawback to Zeus is that a novice programmer does not have the experience necessary to design appropriate data and code structure views, and hence, its use may be somewhat limited.
4.2. KAESTLE and FooScape
KAESTLE [26], is a program visualization system that supports the visualization of programs written in Lisp. It supplies the user with both code and data visualizations, giving static and dynamic views of each. The main data structure within Lisp programs is the list, and thus, KAESTLE provides an automatic graphical representation of the list structure, see Figure 2. In this way, all data objects created by an executing program may be visualized. The displays can then be edited, allowing the user to change not only the graphical layout of the display, but also to manipulate the structure of the objects themselves. Executing programs may be monitored by updating the displays whenever an “interesting” function is entered (traceenter) or left (traceexit). Instead of updating one display repeatedly and thus losing the history information of the data structure, a series of snapshots may be generated, each appearing in a separate window, as shown in Figure 2.
Code visualization occurs within KAESTLE through the FooScape tool. FooScape is primarily designed to give a first, rough overview of some code fragment and displays functions as ellipses that are connected by arrows, representing the call between one function and another. In this way, FooScape represents a program or code fragment, as a network of functions that mutually invoke each other, see Figure 3.
The dynamic behaviour of the code is also visualized through FooScape with the use of the standard Franz Lisp trace package. A function ellipse is highlighted whenever a function is active, and a programmer can tell from the pattern of highlighted function ellipses what the system is doing. Sound has now been added to FooScape and each function is assigned two specific tones that are played when the function is entered and exited, respectively. In this way, recursive calls to functions can now be heard. FooScape does not provide any data visualization and must be used in conjunction with KAESTLE when such visualization is required. However, even with the integration of the two separate tools, there does not appear to be any way in which the information regarding the flow of code execution, and the changing data structures, can be visualized in a harmonious fashion. To obtain a clear indication of what section of code is resulting in the changing data visualizations the user must track the traceenters and traceexits as they are encountered during program execution.
Bocker et al [26] claim that KAESTLE has proved to be very effective in debugging LISP programs. Although the code visualization provided by FooScape are very limited, they still provide an overall knowledge of the run-time execution of the program code, imparting important information to the user. This, combined with the ability to see data structures before and after any user-defined interesting events, e.g. function invocations, provides the programmer with enough knowledge to easily locate bugs in the source code.
"l" 1 2 3 4 l/Snapshot - 1 "l" 1 2 3 4 l/Snapshot - 2
Figure 2. Generating a sequence of snapshots of a data structure with KAESTLE.
match-restriction test-eval match match-> match-rule make-alist match-* toplcopy init-binds try-rules match-rules s-e circle replace-variables markedp mark-expression simplify pget phash passociation pput classify-expression cons-cell-generating-expr side-effect-free predicate-expr FooScape
Figure 3. FooScape: a view of connected function ellipses, showing the dynamic behaviour of a program through the inversion of active functions.
4.3. ABERDEEN
Within the Napier88 [23] programming environment a tool, ABERDEEN [27], for browsing the persistent store and allowing interactive declarations and expressions to be applied to the store has been developed. ABERDEEN is an extension of Kirby’s object browser for Napier88 [28]. ABERDEEN is not intended to be a true visualization system, but is the closest tool that exists in a persistent environment.
ABERDEEN allows the user to traverse through the persistent store and examine objects that reside within it. Upon traversal, objects are displayed in one of three ways. The value of the object and its type are written to the screen if it is a simple base type object of the language; a graphical picture is displayed for graphical objects; and a menu showing the structure of the object is displayed for structured objects. Each field of the structure may then be subsequently traversed, see Figure 4. When executing code within ABERDEEN, a programmer may execute an entire program or a selected subsection of a program. Any objects that are created by the execution sequence can be automatically displayed if the user chooses and any changes to the persistent store made by the execution sequence can be displayed by re-traversing the objects within the store.
ABERDEEN does not provide any further visual information to the programmer, and as stated previously, is basically an extended browser rather than a true visualization system. Its failures as a visualization system are:
• There is no way to automatically view objects within the store which are used by a program, the programmer must manually traverse the store to examine the required objects.
• Any changes made to the store as an effect of program execution are only displayed when the objects are re-traversed.
• During execution there is no dynamic display of the store. Thus, the changing values of objects can only be displayed by breaking down the code into small segments and executing them manually with re-traversal of the objects of interest each time.
• There is no way to visualize short-term objects as they never reside in the store.
• Although code residing in the store can be examined, there is no structured views of the segments of code and how they interact with each other.
• There is no control flow, or execution sequence visualization.
However, even with these deficiencies, ABERDEEN plays a vital role in the development of persistent programs. In providing the user with information about the contents of the store, the first, major step, towards a visualization system has been taken.
env proc structure TYPE aProc : proc int structure -> void x : bool y : string Figure 4. Traversal of a procedure with ABERDEEN.
4.4. CASE*Designer
CASE*Designer [29] is a commercially available tool supporting the use of the Oracle database. It is composed of a number of different illustrative tools that have been designed to support Computer-Aided Systems Engineering Concepts and provides the user with a multi-windowed, multi-user graphical interface to CASE*Dictionary, the development database. However, CASE*Designer has been developed primarily for the generation of databases through a graphical interface, in much the same way as a visual programming language provides for the generation of programs through a graphical interface. As a result of this, the facility to view an existing database graphically has not been incorporated into the CASE*Designer tool set. While reverse engineering from an existing database to a graphical representation of its structure can be achieved, the process needed to do this is very complicated. Databases that have been generated with CASE*Designer’s graphical interface can only be viewed through the generation tools, and there is no support provided for the viewing of queries executed on these databases. In summary, while CASE*Designer is a very useful tool and supports the concept of visual programming, it appears to provide very little in the way of database visualization.
4.5. A Program Visualization Tool
A “Program Visualization Tool” [3], has been developed to assist C++ programmers in their use of the class library framework and as a debugging aid. The tool allows a programmer to review a run of an application, examining the behaviour of the system at varying levels of detail, and focussing on particular interactions (such as those leading to object creation and destruction of specific objects).
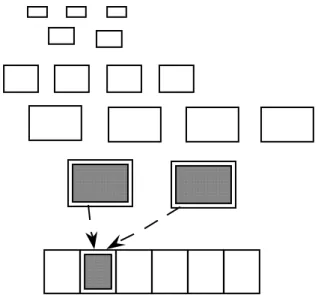
In visualizing a C++ program, the tool firstly annotates it with “tracing” statements and then an application is built and run for demonstration. During execution the application generates a trace file that is then processed by a display program to provide the visual model. The user chooses icons from a predefined table of icons, to represent objects of different classes and then the program trace is replayed. Figure 5 illustrates a snapshot of a trace replay with the top portion of the screen showing objects that have been created, and the bottom portion showing a simplified call trace indicating object interactions. The display shows all of the instantiated objects and groups them together by class. Active objects are highlighted, and are grouped to show the calling sequence. Data defining the methods currently under execution is presented, with the methods identified by class name and method name. In this way, inherited methods are identified.
Rather than passively watching a trace replay, in this version of the tool, the user may also control the replay of information by setting breakpoints and using single-step execution. In future versions of this tool it is proposed to also implement:
• “reverse”, allowing the user to go backwards through the trace;
• “find a place where an object of class X invokes a specified/unspecified method in an instance of class Y ”; and
• “display only interactions involving this chosen object”.
This visualization tool provides the user with a very useful debugging aid, and helps in the users understanding of an unfamiliar new “application framework”. However, it does fail to provide any code visualization and there is also no visualization of the encapsulated state of the objects created within an execution. Visualization is provided purely on a class level and no attempt has been made to provide any information at lower levels of detail.
A similar research thrust is also being conducted at the Geogia Institute of Technology, where a visualization system for visualizing the execution of complicated C++ programs is currently under development [30].
4.6 Goofy, Cppinfo and POLKA
The Goofy software system [31, 32] is a general animation system that builds on the ideas of Stasko [33] and his software system, POLKA. It is composed of the Goofy animation language, and a processor, which together provide for smooth, 2½ dimensional colour animations on top of the X11 Window System. The main features of the Goofy language are as follows:
• Objects can be constructed from elements such as lines, rectangles, circles, ellipses, splines and polygons.
• They are generally defined in terms of their size, colour and initial position in the window along with specialized attributes. For example, a line can be thin, medium or thick (its width), dotted, dashed or solid (its style) and can have noarrows, forwardarrows, backwardarrows or twoarrows (its arrows).
IconEdit Demo 1 TIconDocument TIconBitMap TApplication::Run TIconView::DoMouseDown TIconEditCommand::IconEditCommand Objects currently active Doc. ? ? ? ? View **
Objects that have been created
• Animation is achieved by performing such operations as moving, showing, hiding, revealing and deleting objects within the window. The animation is controlled by specifying start and end times for each different event.
As demonstrated in [32], a simple program could be animated with Goofy by annotating it in the following manner:
[call to create graphics.] while (x<7)
{
[call to animate upper part of loop.] [call to colour loop’s body.] y=y+z*x;
x++;
[call to animate change to loop variant.] [call to animate lower part of loop.] }
[call to colour STOP box.]
Goofy functions corresponding to each call need to be defined. These calls then generate the Goofy instructions that are filed and subsequently read by the processor to provide a Goofy animation.
As demonstrated, Goofy is a general visualization system requiring the user to construct animation code before visualization of a program is possible. To integrate with this, the authors of Goofy have also developed a program cppinfo [34], which provides two forms of information about a C or C++ program: static data and dynamic data, and a visualization system built on top of the Goofy system that processes this information and automatically constructs animations of the data information provided, as illustrated in Figure 6. The visualization module works by processing each data record, specifying the appropriate
source code cppinfo trans- formed source compile and link executable dynamic data static data File Processor Visualization Module Goofy POLKA
animation and the time at which the animation should occur. In this way, an arbitrary number of animations can be specified to occur simultaneously. The user is then able to interact with the developing visualization by manipulating the visual display through pausing, zooming in and out, panning, and so forth.
The visualizations produced show the static structure of the program and depict each control construct in turn, starting with the first declaration in the main function. Figure 7 shows: a declaration, an assignment, a loop containing a choice statement leading to an inner loop, and finally an assignment.
Data flow visualizations are used to depict dynamic software features. Figure 8 shows two variables being used to assign to an element of an array. The smaller rectangles depict variables that have been assigned to in the past. When an assignment occurs, the variables and constants involved in the assignment are enlarged and moved to the centre of the window. The view then moves away so that all variables in scope are again visible, but the items used in the last assignment appear larger than those involved in previous assignments. The effect of this is that the size of items is directly related to their execution history.
In summary, the Goofy/POLKA system provides a good basis for the construction of visualization graphics, allowing the animation programmer to animate any aspect of program behaviour that is desired by constructing the corresponding animation program. However, the construction of an animation program is not a trivial task and to assist novice programmers an automatic visualization tool has also been designed. This tool appears to provide useful visualizations of the source code with both static and dynamic visualizations
declaration
assignment assignment
outer loop inner loop
choice statement
Figure 7. Visualization of static data.
presented. However, there is no integration of these visualizations and thus, programmers may still have difficulty in isolating the source of program bugs.
4.7. IVE
IVE [5], the Integrated Visualization Environment, is a graphical debugging tool for (massively) parallel programs. It supports three kinds of visualizations. The first are program visualizations, which present logical and structural software relationships such as call diagrams and dependency graphs. Process visualizations are also presented, depicting the flow of execution of a program and, finally, application visualizations are presented. These application displays represent the results of a computation using application specific metaphors and abstractions. The IVE system is composed of a monitoring-rendering system and a visualization template designer called the Visualization Design Environment (VDE).
VDE reads in a low-level specification of a program’s data structures and from this produces a basic visualization template. This template can then be refined by the user into higher level template specifications. VDE will produce all of the graphical specifications that it can, if the user is not interested in some of these views they can easily be removed. The final specifications are then incorporated into visualization templates that are subsequently read by the monitoring-rendering system, as part of the visualization process.
The monitoring-rendering system is divided into four parts, the schedular, monitor, instantiator-renderer, and subject program. The scheduler reads a file containing:
• the location of break points in the subject program;
• the visualization templates designed with VDE that will be used to render data postprocessors for managing the data of a program; and
• pointers to the subject program variables that allow the data to be collected.
This information is then passed to the monitor that monitors the subject program during its execution. When a break point is encountered in the program the monitor reads the current values of the program variables and processes the information with the data postprocessors. These results are then passed on to the instantiator-renderer and a process visualization is created.
In this way, IVE is able to produce a wide range of visualizations pertaining to program execution, limited only by the user's design of visualization templates. However, the construction of good visualization templates is not a trivial task, as the choice of effective visualizations is not clear. The static nature of the system also means that users cannot change what they are monitoring once execution has started and hence cannot interactively design a visualization template. However, the automatic generation of graphical specifications within the Visualization Design Environment does appear to provide the programmer with a good support base for this task, thus increasing the usefulness of IVE.
4.8. A Graphical Environment for Monitoring Prolog Programs
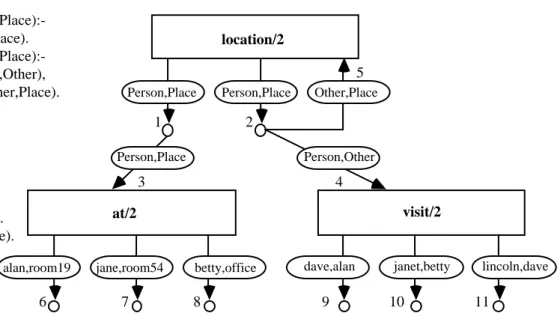
Lazzeri [35], has developed a graphical environment for logic programming that uses cyclic AND/OR graphs to represent both program source code and dynamic program behaviour. In the AND/OR graph, a program clause is represented by an AND node. The node has a single incoming arc, representing the clause head, and n outgoing arcs, each corresponding to one atomic formula in the clause body. Every arc is labelled with a box, showing the name of the predicate that the arc corresponds to and the number of arguments that the predicate takes. The parameter names given to the predicate arguments are also displayed. During unification, the relation labelling an incoming arc is true, if and only if all relations labelling the outgoing arcs are true.
Multiple clauses defining a single relationship within a logic program are grouped together in the graph with an OR node. This is shown as a procedure box with an outgoing arc for
every alternative clause in the relationship definition. The outgoing arc is labelled with the parameters to the clause and connects with the AND node of the clause. These alternatives are searched from left to right during unification, corresponding to a linear ordering of the clauses in a textual definition.
Recursive definitions of relations within a logic program are displayed by introducing cycles to the AND/OR graphs. Arcs that correspond to a relationship already defined in the graph by location/2 at/2 visit/2 Person,Place Person,Place Person,Place Person,Other Other,Place
alan,room19 jane,room54 betty,office dave,alan janet,betty lincoln,dave
1 2 3 4 5 6 7 8 9 10 11 location(Person,Place):- at(Person,Place). location(Person,Place):- visit(Person,Other), location(Other,Place). at(alan,room19). at(jane,room54). at(betty,office). visit(dave,alan). visit(janet,betty). visit(lincoln,dave). 1 3 2 4 5 6 7 8 9 10 11 (a) (b)
Figure 9. (a) A simple recursive logic program; and (b) its cyclic AND/OR graph representation.
a procedure box, simply point back to that initial definition, and introduce a cycle to the graph structure. The textual and graphical representations of a simple recursive logic program are shown in Figure 9.
Using this visual representation, the system developed by Senay and Lazzeri is also able to depict the run-time behaviour of logic programs by showing the successive goal reductions performed to solve a given goal. The AND/OR graphs are augmented with various symbols to indicate clause failures and unifications and the user is able to observe the changing graph as program execution progresses. As these graphs may grow large very quickly, the ability to cluster, hide, and resize components of the graph has also been built into the graphical environment. To further facilitate the programmers understanding of an execution run, binding dependency graphs, which show how and when variables are generated during the computation, will be added to the system.
By utilizing these static and dynamic displays the programmer is able to effectively monitor the execution of logic programs. Static and dynamic graphs of the program code are produced, along with binding dependency graphs which show the generation of variables throughout an execution run. The clustering, hiding and resizing of components of the graphs also allows the programmer to focus attention on particular program segments, providing good support for the debugging process. In summary, the graphical environment developed appears to encompass the range of needs of a programmer within the field of logic programming, and provides very good support for the debugging of logic programs.
4.9. PIE
PIE [6], the Parallel Programming and Instrumentation Environment, is a visualization system implemented on the Mach operating system to support the visualization of programs written in languages such as C, MPC [36], C-threads [37], Ada and Fortran. It is not an architecture specific system and hence may be ported. Its basic platform is a workstation running the X Window System [38].
When using PIE, the programmer enters a program textually and a basic visualization showing the code’s principle constructs, (eg. syncs, joins, puts, gets, etc.) is automatically generated. To gather performance information the user chooses the constructs of interest and then executes the program. When a selected construct is encountered during execution, important information, such as time stamps, is automatically collected, through a sensor and an independent collector process.
The PIE system can then present the gathered information in a variety of ways. One of these views is a histogram plotting the various levels of parallelization achieved throughout program execution, against the percentage of total execution time that achieved each level. Another view displays the number of processes being used concurrently, against a time-line of program execution. However, the most informative view presented by PIE, is where time is plotted on the horizontal axis and the processes used throughout the computation are on the vertical axis. Each process used has a separate horizontal bar that makes use of changing colors to represent different episodes in the process's history, with the entire bar depicting the execution history of the process over the life of program execution. As an example of the use of colors in these bars, process waits resulting from to a sync construct may appear as a yellow rectangle in the bar of that process, the length of the rectangle showing the length of the wait encountered by the process. Green rectangles might similarly indicate an instance of a process waiting to join a child.
Rectangles may be selected by the user and the PIE editor then automatically moves the cursor to the corresponding construct in the program text. In this way, the programmer can analyze the computation's performance using data that is automatically projected onto the computation's structures. Thus, the aim of mapping performance data onto program constructs is achieved in the PIE visualization system.
PIE goes to considerable effort to compensate for any performance perturbation caused by the monitoring. An algorithm is used which manipulates the time stamps of events according to the number of monitored events that have come before it to reflect the true times of the computation. However, with this compensation method a risk of reordering events is introduced and ways of overcoming this are still under investigation.
In summary, PIE provides good support to allow users to observe computations while they execute by mapping the performance data onto the program constructs. It presents visualizations at a language (process) level and an architectural (processor) level, and is the only visualization system that we are aware of that does this. However, it presently has limited interactive features and does not support dynamic changes to the object code during execution. It also makes no attempt to display the data structures created within the program or to supply any visualizations pertaining to the code's overall structure.
4.10. Zernick, Snir, and Malki
A visualization tool has been developed by Zernick, Snir and Malki [11], that attempts to use visualization to understand and overcome concurrency related bugs. The visualizations are based on trace information collected from interprocess communication and are suitable for systems with thousands of processors, coarse-grained parallelism, and any language that makes communication and synchronization explicit.
The visualizations are displayed in the form of causality graphs, see Figure 10, which provide a logical view of execution by indicating to the user which operations in the source