Repository ISTITUZIONALE
PERCEIVE: Precipitation Data Characterization by means on Frequent Spatio-Temporal Sequences / Farasin, Alessandro; Garza, Paolo. - ELETTRONICO. - (2018), pp. 1081-1088. ((Intervento presentato al convegno 15th
International Conference on Information Systems for Crisis Response and Management (ISCRAM 2018), In-Cooperation with ACM SIGCAS tenutosi a Rochester, NY (USA) nel May 20-23, 2018.
Original
PERCEIVE: Precipitation Data Characterization by means on Frequent Spatio-Temporal Sequences
Publisher: Published DOI: Terms of use: openAccess Publisher copyright
(Article begins on next page)
This article is made available under terms and conditions as specified in the corresponding bibliographic description in the repository
Availability:
This version is available at: 11583/2710805 since: 2018-07-12T12:55:34Z
PERCEIVE: Precipitation Data
Characterization by means on Frequent
Spatio-Temporal Sequences
Alessandro Farasin
Istituto Superiore Mario Boella
and
Politenico di Torino, Italy
[email protected]
Paolo Garza
∗
Politecnico di Torino, Italy
[email protected]
ABSTRACT
Nowadays large amounts of climatology data, including daily precipitation data, are collected by means of sensors located in different locations of the world. The data driven analysis of these large data sets by means of scalable machine learning and data mining techniques allows extracting interesting knowledge from data, inferring interesting patterns and correlations among sets of spatio-temporal events and characterizing them. In this paper, we describe the PERCEIVE framework. PERCEIVE is a data-driven framework based on frequent spatio-temporal sequences and aims at extracting frequent correlations among spatio-temporal precipitation events. It is implemented by using R and Apache Spark, for scalability reasons, and provides also a visualization module that can be used to intuitively show the extracted patterns. A preliminary set of experiments show the efficiency and the effectiveness of PERCEIVE.
Keywords
Spatio-temporal sequence mining, Data characterization
INTRODUCTION
Association rules and frequent sequences are well-known descriptive pattern-based techniques (Tan et al.2005; Flach2012) that have been used in many application contexts to describe and model the main characteristics of the analyzed data (e.g., market basket data (Agrawal and Srikant1994), census data (Appice et al.2003), medical data (Xiao and Chiusano2014), biological data (Pan et al.2003; Hasan et al.2012)). However, to the best of our knowledge, those two typical data mining techniques have never been used to characterize climatology data and in particular spatio-temporal sequences of precipitation events. Many complex and precise meteorological models have been proposed to predict precipitations and forecast precipitation and fire events. Also, data mining approaches have been proposed to address the prediction/forecast problem (e.g. (Cheng and Wang2008)). However, our goal is different. Specifically, we are interested in inferring the correlations among precipitation events to describe the analyzed events and understand whether, based on the analyzed data, some common patterns and trends can be discovered. To address this goal we propose a framework, called PERCEIVE, based on Frequent Spatio-Temporal Sequences (FSTSs). Frequent Spatio-Temporal Sequences are patterns representing correlations among set of events. For instance, the sequence{(pos1,heav yr ain),(pos3,snowstorm)}(0) → {(pos2,heav yr ain)}(2)represents the
following sequence of events: heavy rain inpos1and snowstorm inpos2at the same time, followed by a heavy rain
event inpos2two days after the occurrence of the first two events. These human-readable patterns can provide
interesting insights to domain experts. Specifically, the extracted set of spatio-temporal sequences can be used to characterize precipitation events and can also be considered during the definition of new climate or meteorological models.
Since the amount of collected data is potentially big, PERCEIVE is based on Apache Spark big data framework, coupled with R, to extract Frequent Spatio-Temporal Sequences. Moreover, PERCEIVE displays also the extracted
patterns on maps to facilitate domain expert analyses. Specifically, the domain expert can analyze one single pattern (FSTS) at a time or groups of similar patterns (FSTSs) to inspect the main spatio-temporal correlations between sets of precipitation events highlighted by PERCEIVE. PERCEIVE automatically extracts FSTSs from the precipitation data without the human intervention, i.e., it is completely data driven during the knowledge extraction step. The domain expert is involved only in the last phase to inspect the extracted spatio-temporal sequential patterns. Even if we used PERCEIVE to characterize precipitation events, the proposed framework is general and can be applied to analyze any type of spatio-temporal events.
An initial campaign of experiments, performed on real data about precipitation events in the USA, confirms that PERCEIVE is efficient and effective in extracting interesting knowledge.
The paper is organized as follows. The frequent spatio-temporal sequence mining problem, and the related main concepts, are introduced. Then, the PERCEIVE framework and its main components are described. Finally, the results of a preliminary campaign of experiments are reported in the experimental section, while the last section draws conclusions and presents future work.
FREQUENT SPATIO-TEMPORAL SEQUENCES
In the following, we report the basic definitions related to the frequent spatio-temporal sequence mining problem and we formally define the addressed mining problem.
We initially introduce the concept of spatial event, which correlates an event type with the location in which it occurs. Then, we define the temporal database concept and we describe how it can be used to store for each spatial event also the information about when each spatial event occurred.
A spatial event is a pair (position, type of event) storing the information about an event type (e.g., heavy rain, snowstorm) and the georeferenced position in which it occurs (e.g., a heavy rain event located in (Lat=42.361145, Long=-71.057083)).
Definition 1 (Spatial event) LetP={p1, . . . ,pn}be a set of positions, where each positionpiis a pair (latitude,
longitude). LetET={et1, . . . ,etm}be a set of event types.
A spatial eventseiis a pair(pi,eti), wherepi ∈P,eti ∈ET.
For instance, the spatial eventse=(p1,heav yr ain)represents the occurrence of a heavy rain event located inp1,
wherep1=(Lat.=42.361145,Long.=−71.057083).
In the frequent sequence mining problem, a set of (spatial) events is referred to as a transaction. For instance, the set
{(p5,heav yr ain),(p1,snowstorm),(p4,light r ain)}is a transaction composed of 3 spatial events.
Definition 2 (Transaction of spatial events) LetSE={se1, . . . ,sel}be a set of spatial events.
A spatial transactiontr={se1, . . . ,sek}is defined as a non-empty set of spatial eventssei ∈SE, i.e.,tr ⊆SE.
A temporal database is used to store the temporal information associated with the records stored in it. In our context, we are interested in storing the timestamps of the sets of spatial events we are analyzing. Specifically, a temporal database storing spatial events is defined as a set of pairs(timestamp, transaction of spatial events). Each pair is called record and stores the set of spatial events occurred at timetimestamp. In our context, we suppose that the domain of the timestamp attribute is a finite sequence of discrete values associated with the period under analysis (e.g., the sequence of dates in the period under analysis). Without loss of generality, we assume that the interval between two consecutive timestamps is a fixed constant (e.g., the interval between two consecutive timestamps is equal to one day if we are storing daily events).
Definition 3 (Temporal database of spatial events) LetT ={t1, . . . ,tk}be a finite sequence of discrete
times-tamps, such thattj+1=tj+∆t, where∆tis the fixed step/interval between two consecutive timestamps.
A temporal databaseT D ={r1, . . . ,rn}is defined as a set of recordsri =(ti,tri), whereti ∈T,tri ⊆ SEand
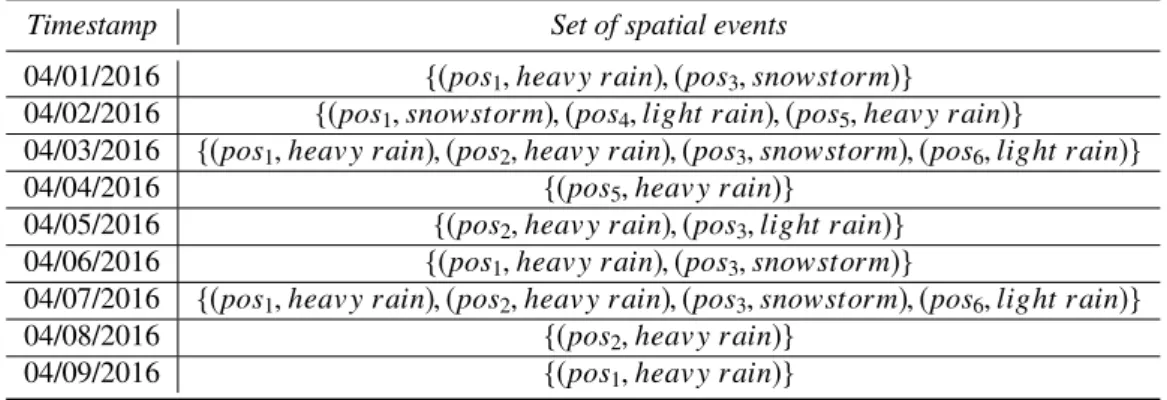
Table 1. Running example temporal database storing spatial events. For the sake of clarity, in each spatial event we report the “alias” of the position instead of its (Lat., Long.) coordinates.
Timestamp Set of spatial events
04/01/2016 {(pos1,heav yr ain),(pos3,snowstorm)}
04/02/2016 {(pos1,snowstorm),(pos4,light r ain),(pos5,heav yr ain)}
04/03/2016 {(pos1,heav yr ain),(pos2,heav yr ain),(pos3,snowstorm),(pos6,light r ain)}
04/04/2016 {(pos5,heav yr ain)}
04/05/2016 {(pos2,heav yr ain),(pos3,light r ain)}
04/06/2016 {(pos1,heav yr ain),(pos3,snowstorm)}
04/07/2016 {(pos1,heav yr ain),(pos2,heav yr ain),(pos3,snowstorm),(pos6,light r ain)}
04/08/2016 {(pos2,heav yr ain)}
04/09/2016 {(pos1,heav yr ain)}
Note that, according to Definition3, each timestamp appears at most one time in the temporal database and the record associated with it contains all the spatial events occurred in that specific timestamp (i.e., we cannot have events occurred at the same time in different records).
Table1reports a running example temporal databaseT Dexamplestoring the information about daily sets of spatial
events (i.e.,∆tis set to 1 day and each timestamp inT is a date). The first record ofT Dexamplemeans that a heavy
rain event and a snowstorm event occurred in positionspos1andpos3on April 1, 2016, respectively. Note that a
different number of events can occur in each timestamp (e.g., two events occurred on April 1, 2016 while three events occurred in April 2, 2016) and the same event type can be associated with many positions at the same time (e.g., heavy rain occurred in positionpos1andpos2on April 3, 2016).
In our context, we are interested in identifying frequent sequences of sets of spatial events. Specifically, a sequence
sis an ordered list of transactions of spatial events {tr1, . . . ,trq}. Each transactiontri in a sequencesis also
characterized by the time distance/interval from the first transaction of eventstr1ins. For instance, the sequence
s1 ={(pos1,heav yr ain),(pos3,snowstorm)}(0) → {(pos2,heav yr ain)}(2)represents the following sequence of
events: heavy rain inpos1and snowstorm inpos3at the same time, followed by a heavy rain event inpos2two days
after the occurrence of the first two events. The sequences1occurs three times in the running example database
(see Table1). The first occurrence ofs1is associated with the 1st and 3rd record of the running example, the second
occurrence is associated with the 3rd and 5th record, while the third occurrence is supported by the 6th and 8th record. Hence, the frequency ofs1in the running example database is three.
Definition 4 (Sequence of spatial events) A sequence of spatial events s is defined astr1(δt1) → tr2(δt2) → . . .→trq(δtq), wheretri is a transaction of spatial events andδtiis the time distance/interval of those events from
the first event(s) of the sequence (i.e., the events intr1).
Note that each sequence represents a set of spatial events and the relative distance/interval between them instead of the information about the absolute time when the sequence of events occurred. The main motivation of this definition is that we are not interested in identifying one single occurrence of a set of events. Instead, we are interested in learning patterns which occur periodically and characterize the relative temporal distance between spatial events. This type of patterns could be useful to develop a system for future event prediction, even if this is not the main goal of this paper.
The support of a sequence represents the frequency of the sequence in the temporal database, i.e., the number of times the sequence occurs in the temporal database. This measure is used to estimate the “statistical relevance" of the sequence. Specifically, the higher the support value, the higher the probability that the extracted sequence models a real characteristic of the analyzed data.
Definition 5 (Support of a sequence of spatial events) The absolute support (sup) of an arbitrary sequencesin the temporal databaseT Dis defined as the number of occurrences ofsinT D.
For instance, the support of the sequence{(pos1,heav yr ain),(pos3,snowstorm)}(0) → {(pos2,heav yr ain)}(2)
in the running database is three because it occurs in the combinations of records {1st, 3rd}, {3rd, 5th}, and {6th, 8th} (see Table1), while the support of the sequence{(pos2,heav yr ain)}(0) → {(pos5,heav yr ain)}(1) →
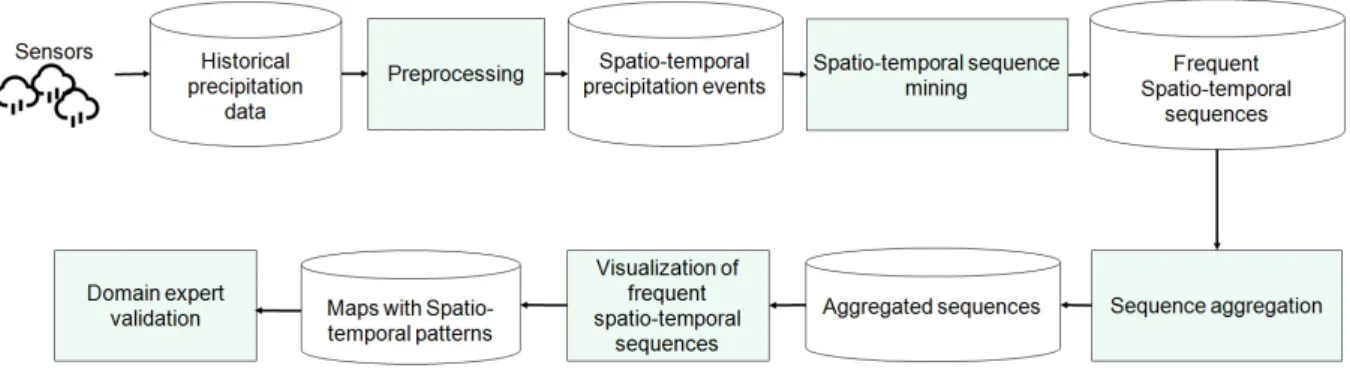
Figure 1. Architecture of thePERCEIVEframework
{(pos2,heav yr ain),(pos3,light r ain)}(2)is one, because only the triplet of records{3r d,4t h,5t h}of the running
example database matches/supports that sequence.
Another measure of interest is the confidence measure, which is usually used to assess the ability of the sequence to predict future events. The confidence of a sequencesrepresents the conditional probability of having the last set of events (transaction of events) ofsgiven the firstq−1 sets of events ofs(i.e., it estimates the probability of occurrence of the last set of events given the occurrence of the antecedent events). For this reason, in the following we will use the term “antecedent” to refer to the firstq−1 sets of events ofsand “consequent” to refer to the last sets of events ofs(i.e.,trq).
Definition 6 (Confidence of a sequence of spatial events) The confidence (con f) of a sequences=tr1(δt1) →
tr2(δt2) →. . .→trq(δtq)is defined as sup tr1(δt1) →tr2(δt2) →. . .→trq(δtq) sup tr1(δt1) →tr2(δt2) →. . .→trq−1(δtq−1)
For instance,con f{(pos1,heav yr ain),(pos3,snowstorm)}(0) → {(pos2,heav yr ain)}(2)
is 0.75 (i.e., 75%) because{(pos1,heav yr ain),(pos3,snowstorm)}occurs four times in the running example database but only in
three cases the spatial event{(pos2,heav yr ain)}occurs two days after the first two events.
Frequent spatio-temporal sequence mining problem. Given a temporal database of spatial events, a minimum support thresholdminsup, and a minimum confidence thresholdmincon f, the frequent spatio-temporal sequence mining problem consists in extracting all the spatio-temporal sequences with a support value greater than or equal to minsupand a confidence value greater than or equal to mincon f. These sequences are referred as “Frequent Spatio-Temporal Sequences (FSTSs)” in the following. This set of mined sequences can be used to
model/characterize the analyzed events.
FRAMEWORK
This section describes the Sequence-based Precipitation Data Characterization and Visualization (PERCEIVE) framework we designed to analyze the spatio-temporal correlation among precipitations. In this paper, we focus our analysis only on precipitations. However, the proposed framework can be effectively used to characterize and visualize also other types of spatial events (e.g. fires, traffic jams).
The architecture of PERCEIVE is reported in Figure1and its main building blocks are described in the following.
Data Preprocessing. Initially, PERCEIVE collects and preprocesses the data about the precipitations in order to obtain data consistent with the spatio-temporal data format defined in Definition3. Specifically, the data about the precipitations are collected by means of several sensors located on the areas under observation. Each sensor collects a set of readings that must be collected and merged with the readings of the other sensors. Moreover, the readings are continuous values. Since we are interested in analyzing sequences of spatial events, we must map these values to events. We perform this operation by applying a threshold calledminpr ec. Specifically, for each pair (sensor,
date) we analyze the daily precipitation, in tenths of mm per day. If the daily precipitation associated with a pair (sensor, date) is greater than or equal tominpr ec, we decide that a “relevant” precipitation event happened and hence a “spatio-temporal” event occurred in (sensor, date). We decided to use PERCEIVE to perform a daily-based analysis. Hence, the preprocessing step generates one record for each date of the period under analysis and the set of spatial-events (“relevant” precipitations) occurring in each date. However, a different time granularity can be set. The data preprocessing step has been implemented by using an SQL Server database to store and query the data and a program written in R.
Spatio-Temporal Sequence Mining. After the input data collection and preprocessing step, PERCEIVE mines the frequent spatio-temporal sequences characterized by a support and confidence greater than or equal to the user defined thresholdsminsupandmincon f, respectively. Moreover, PERCEIVE prunes the sequences containing events for which the distance is less thanmindistancekm because they are usually considered irrelevant or trivial correlations in the precipitation analysis domain. We setmindistanceto 50 km in all our experiments. The mined sequences characterize, by means of human-readable sequences, the correlations among the precipitations of the areas under analysis. This automatic data-driven approach allows extracting/inferring knowledge from the input data without the intervention of domain experts. The extracted sequences can be manually analyzed to understand what the correlations about precipitation events are and how they move from one area to another.
Several algorithms can be used to mine frequent sequences (e.g. (Zaki2001; Zaki2000; Wang and Han2004)). However, a specific solution is needed to mine spatio-temporal sequences. Similarly to the solution exploited by Bruno and Garza in (Bruno and Garza2010) to mine temporal sequences, we use a windowing transformation and a frequent itemset mining algorithm to extract frequent spatio-temporal sequences. The windowing transformation creates a set of “macro” records, each one representing the events occurred in a specific date and the events occurred in thewfollowing dates. As described in (Bruno and Garza2010), an itemset mining algorithm can then be applied on the transformed data to efficiently mine frequent temporal sequences. Since our input data are spatial events, the output of this process is a set of frequent spatio-temporal sequences. To implement a scalable solution, PERCEIVE exploits the Apache Spark (Zaharia et al.2010) implementation of the FP-growth itemset mining algorithm (Han et al.2000) coupled with a windowing function written in Java.
Sequence Aggregation. To provide a better characterization of the correlations among precipitation events, PERCEIVE applies two aggregation (clustering) procedures on the mined frequent sequences with the aim of (i) grouping sequences characterized by the same consequent (i.e. sequences for which the last spatio-temporal event is the same) and (ii) grouping sequences characterized by the same consequent and similar antecedents (i.e., FSTSs with at leastminoverlap% spatio-temporal events in common in their antecedent and exactly the same consequent) to reduce the redundancy related to similar sequences. Aggregation step (i) allows obtaining a global view of the different preconditions of events that are correlated with precipitation events in a specific position of interest. For instance, suppose that only the following two sequences are characterize by positionpos5as consequent:
s1 ={(pos1,pr ecipitation)}(0) → {(pos5,pr ecipitation)}(1)
s2 ={(pos3,pr ecipitation)}(0) → {(pos5,pr ecipitation)}(1)
Aggregation step (i) groups them together proving the global information that, based on the rules inferred from the data, the precipitations in positionpos5happens frequently when the day before a precipitation occurred in position
pos1orpos3.
Aggregation step (ii) is used to merge rules characterized by the same consequent and similar antecedents. It allows achieving two goals: redundancy removal (each set of similar sequences is merged in one group and hence domain experts analyze one group instead of many singular sequences) and spatio-temporal trend confirmation, supported by slightly different sequences.
This component has been implemented in R (R Core Team2018).
Sequence Visualization. To facilitate the exploration of the knowledge represented by FSTSs, the mined sequences are visualized on a map. The visualization component allows domain experts to analyze the direction of the spatio-temporal correlations and the time intervals between the precipitation events represented by the extracted sequences. PERCEIVE can visualize either one single sequence or one “group” of aggregated sequences at a time. Also, the visualization part has been implemented by using the R software.
Figure 2. Oregon precipitations: Examples of mined FSTSs
PRELIMINARY EXPERIMENTAL EVALUATION
We performed a set of experiments by using the real GHCN-Daily dataset (Menne, Durre, Korzeniewski, et al.n.d.). Specifically, we focused our analyses on the precipitation information available in the downloaded data to assess the quality and the quantity of the frequent spatio-temporal sequences (FSTSs) extracted by using PERCEIVE. We have performed an initial qualitative analysis of the extracted FSTSs, supported also by the visualization component. Then, quantitative analyses have been performed to understand the characteristics of the mined FSTSs in terms of support and confidence.
Dataset. We used the precipitation data related to the Oregon country to perform our experiments. The used data (Menne, Durre, Korzeniewski, et al.n.d.), which are provided by the NOAA National Climatic Data Center, were collected by means of 1652 sensors located in Oregon. The data set contains the historical daily precipitation information for each sensor. We considered the precipitation data from 2014 to 2016. A detailed description of the collected data is reported in (Menne, Durre, Vose, et al.2012).
Qualitative analysis and data visualization
We performed an initial set of experiments by considering the precipitations of year 2016. We setminpr ecto 300 tenths of mm per day (i.e., a daily precipitation event is considered only if the measured daily precipitation is greater than 300 tenths of mm),minsupto 5% (i.e., only the sequences that occurred at least in 5% of analyzed data is mined), andmincon f to 75%.
PERCEIVE has automatically mined a set of FSTSs representing interesting frequent correlations among sets of precipitation events in different areas of Oregon. Specifically, 2,417 FSTSs have been automatically extracted. Figure2reports two representative examples of the mined FSTSs on a geographical map. The blue points are related to the antecedent items/events while the orange one represents the consequent one (i.e., the last event of the sequence). Both FSTSs are characterized by a confidence equal to 100%. It means that, according to the analyzed historical data, if precipitations are happening in the blue points after one day a precipitation will happen in the location associated with the orange point. The graphical representation FSTSs allows to easily analyze the mined sequences and hence the represented correlations among spatio-temporal events.
Since some FSTSs are similar, to easy the manually inspection the mined FSTSs by means of the domain expert, the last component of PERCEIVE group together similar FSTSs to provide a more compact information to the end user. For instance, in this case, by using the first aggregation step, which aggregates FSTSs characterized by the same consequent, 32 aggregations/groups are generated, which are two orders of magnitude less than the number of mined FSTSs, and 113 groups are obtained by applying approach (ii), which generates groups of FSTSs that are
0 500 1000 1500 2000 2500 75 80 85 90 95 100 #FSTSs Confidence (%)
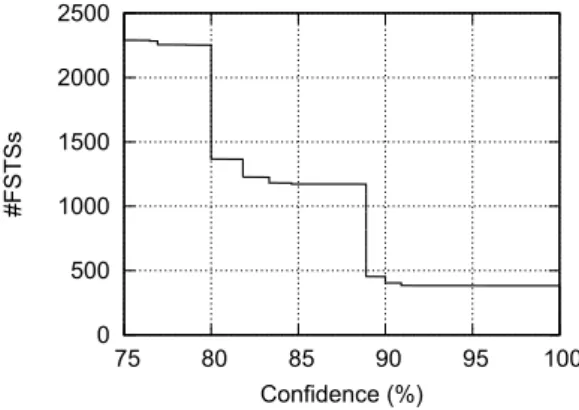
Figure 3. Distribution of the number of FSTSs with respect to their confidence value
characterized by the same consequent and similar antecedents. This means that 113 “trends” are identified (one for each group identified by the second aggregation procedure). The domain expert can analyze one group at a time instead of one single FSTS at a time reducing the time needed to inspect the mined sequences. Moreover, the presence of groups of similar FSTSs, emitted by the second aggregation procedure, can be considered as a reinforcement of the strength of single FSTSs (i.e., the higher the number of FSTSs in a group, the higher the probability that the represented “trend/correlation” among the involved spatio-temporal events is relevant). We performed a similar set of experiments by considering the precipitations occurred in 2014 and 2015, respectively. Many of the mined FSTSs are similar to the ones mined by considering year 2016. Hence, the correlations among precipitation events seem to be, on the average, independent of the considered year. They are probably related to the geological characteristics of the areas under analysis and the impact that they have on the wind direction and the cloud movement. One of the most interesting features of PERCEIVE is that all the correlations between precipitations among different areas have been mined automatically without the intervention of domain experts, who however are extremely useful to inspect and validate the mined patterns.
Quantitative analysis
In the previous section we already reported some quantitative information about the number of mined FSTSs. In this section we analyze the distribution of the number of mined FSTSs with respect to their confidence value, to understand if the mined sequences can potentially be used for predictive purposes. Figure3reports the cumulative number of mined FSTSs with respect to their confidence value. Specifically, each point (confidence, cumulative number of FSTSs) of the reported curve corresponds to the number of FSTSs with a confidence value greater than or equal to confidence.
The achieved results confirm that many of the mined FSTSs are characterized by a high confidence value and specifically 382 of them have a confidence equal to 100%. Hence, a large part of the mined FSTSs are characterized by a potential high prediction quality. Then, they have been aggregated in 114 groups of similar FSTSs, which means that in 2016, in the Oregon State, 114 different sets of FSTSs having confidence equal to 100% have been found. In order to confirm the affordability of the system, other tests for other years (2014 and 2015) have been performed, showing similar results as in 2016.
CONCLUSIONS
In this paper we proposed PERCEIVE. To the best of our knowledge, PERCEIVE is the first data-driven framework that characterizes spatio-temporal precipitation events by using frequent spatio-temporal sequences. The preliminary performed experiments show the ability of PERCEIVE to automatically mine recurrent spatio-temporal patterns. Further experiments, which will involve also domain experts for the validation step, will be performed by considering different countries and other types of spatio-temporal events. The potential correlation with the geographical characteristics of the considered areas will also be investigated. The exploitation of the extracted FSTSs for the precipitation prediction problem will be investigated and a prediction algorithm based on FSTSs will be designed as well. Finally, an improvement of the visualization module will be performed, in order to better distinguish event typologies and magnitudes.
ACKNOWLEDGMENT
The research leading to these results has received funding from the European Union’s Horizon 2020 research and innovation programme under grant agreement No 700256 (“I-REACT” project).
REFERENCES
Agrawal, R. and Srikant, R. (1994). “Fast Algorithms for Mining Association Rules in Large Databases”. In:
Proceedings of the 20th VLDB conference, pp. 487–499.
Appice, A., Ceci, M., Lanza, A., Lisi, F. A., and Malerba, D. (2003). “Discovery of spatial association rules in geo-referenced census data: A relational mining approach”. In:Intell. Data Anal.7.6, pp. 541–566.
Bruno, G. and Garza, P. (2010). “TOD: Temporal outlier detection by using quasi-functional temporal dependencies”. In:Data Knowl. Eng.69.6, pp. 619–639.
Cheng, T. and Wang, J. (2008). “Integrated Spatio-temporal Data Mining for Forest Fire Prediction”. In:Trans. GIS
12.5, pp. 591–611.
Flach, P. (2012).Machine Learning: The Art and Science of Algorithms That Make Sense of Data. New York, NY, USA: Cambridge University Press.
Han, J., Pei, J., and Yin, Y. (2000). “Mining Frequent Patterns without Candidate Generation”. In:Proceedings of the 2000 ACM SIGMOD International Conference on Management of Data, pp. 1–12.
Hasan, M. A., Huan, J., Chen, J. Y., and Zaki, M. J. (2012). “Biological knowledge discovery and data mining”. In:
Scientific Programming20.1, pp. 1–2.
Menne, M. J., Durre, I., Korzeniewski, B., McNeal, S., Thomas, K., Yin, X., Anthony, S., Vose, R. R. R., B.E.Gleason, and Houston, T.Global Historical Climatology Network - Daily (GHCN-Daily), Version 3.
Menne, M. J., Durre, I., Vose, R. S., Gleason, B. E., and Houston, T. G. (2012). “An Overview of the Global Historical Climatology Network-Daily Database”. In: 29, pp. 897–910.
Pan, F., Cong, G., Tung, A. K. H., Yang, J., and Zaki, M. J. (2003). “Carpenter: Finding Closed Patterns in Long Biological Datasets”. In:Proceedings of the Ninth ACM SIGKDD International Conference on Knowledge Discovery and Data Mining. KDD ’03. Washington, D.C.: ACM, pp. 637–642.
R Core Team (2018).R: A Language and Environment for Statistical Computing. R Foundation for Statistical Computing. Vienna, Austria.
Tan, P.-N., Steinbach, M., and Kumar, V. (2005).Introduction to Data Mining. Addison-Wesley.
Wang, J. and Han, J. (2004). “BIDE: Efficient Mining of Frequent Closed Sequences”. In:Proceedings of the 20th International Conference on Data Engineering. ICDE ’04. IEEE Computer Society, pp. 79–.
Xiao, X. and Chiusano, S. (2014). “Analysis of Medical Treatments Using Data Mining Techniques”. In:IEEE Intelligent Informatics Bulletin15.1, pp. 30–31.
Zaharia, M., Chowdhury, M., Franklin, M. J., Shenker, S., and Stoica, I. (2010). “Spark: Cluster Computing with Working Sets”. In:Proceedings of the 2Nd USENIX Conference on Hot Topics in Cloud Computing. HotCloud’10. Boston, MA: USENIX Association, pp. 10–10.
Zaki, M. J. (2000). “Sequence Mining in Categorical Domains: Incorporating Constraints”. In:Proceedings of the Ninth International Conference on Information and Knowledge Management. CIKM ’00. McLean, Virginia, USA, pp. 422–429.
Zaki, M. J. (2001). “SPADE: An Efficient Algorithm for Mining Frequent Sequences”. In:Machine Learning42.1/2, pp. 31–60.