Through the eyes of analysts: a content analysis of analyst report narratives
30
0
0
Full text
(2) Through the Eyes of Analysts A Content Analysis of Analyst Report Narratives∗ Author Christian Nielsen Department of Accounting, Finance and Logistics Aarhus School of Business Fuglesangs Allé 4 8210 Aarhus V. Denmark Tel. (+45) 89 48 62 22 E-mail: [email protected] Abstract This paper contributes to the ongoing debate of developing corporate reporting practices by analyzing the information content of fundamental analyst reports and comparing this with annual reporting practices. As there has been much critique of the lacking relevance of disclosures through corporate reporting, taking the point of departure in some of the capital market actors that follow companies the closest, namely the sell-side analysts, will reveal which types of information companies should be disclosing through their corporate reports. By focusing on the reports disclosed in connection with the analysts’ fundamental analyses of a company, this paper constitutes an important contribution to business reporting but also to the study of the capital market actors’ perceptions of relevant information. A medium-sized medico-tech company, internationally renowned for its state-of-the-art business reporting, was chosen as the basis for the study. An analysis of the latest fundamental analyst report on this company by each investment bank actively following it was conducted using a content analysis methodology. The results illustrate the extent to which analysts consider certain types of voluntary information as relevant to their analyses and recommendations. The paper shows that background information about the company, i.e. about products, markets and the industry, along with the analysts’ own analysis of financial and operating data account for nearly 55% of the total disclosure in fundamental analyst reports, and the amount of financial data supplied is not related to the other disclosures in the reports. In comparison to business reporting practices, the fundamental analyst reports put relatively less weight on social and sustainability information, intellectual capital and corporate governance information and considerably more emphasis on segment information, opportunities, value drivers and critical success factors. ∗. The title and applied methodology of this article is greatly inspired by Beattie, McInnes & Fearnley’s report for ICAEW entitled “Through the Eyes of Management” (2002). A special thanks go to Vivien Beattie and Bill McInnes for allocating time to discuss the applied methodology and implications. Furthermore, the author wishes to thank participants at the seminars at University of Glasgow and University of Stirling as well as Raf Orens for constructive comments on a previous version of this paper. The author also wishes to acknowledge that the data for this paper was gathered in connection with the project “Reporting on the Business Model: Understandings from the Management and Analyst Point of View” with financial support from the “KPMG and the University of Illinois Business Measurement Research Program” under the coordination of BDO-professor Per Nikolaj Bukh, Aarhus School of Business.. 1.
(3) 1. Introduction. The capital market plays an important role in our present day society as it facilitates the distribution of capital between investors and companies, not just in individual countries and on specific stock exchanges, but rather on a global scale. Within the realm of the capital market, information plays a central role because of e.g. agency costs (Jensen & Meckling 1976) and the fact that there is information asymmetry (cf. Akerlof 1970) between company management and investors. The capital market is, according to Barker (1997), essentially a market for information incorporating three main groups of actors: company management, investors, and analysts, and it is constituted by two coexisting information markets, namely the market for financial reporting and the market for financial analysis. Apparently, corporate financial reports do not provide investors with an accurate view of the value creation process within the firm (Garcia-Ayuso 2003, 59), and investors therefore come to rely on financial analysis services as a key source to fill this information gap. Seemingly, the lack of value relevance of corporate reporting in conveying a transparent picture of companies’ intrinsic value (Lev & Zarowin 1999) is an instigator of the role that analysts play on the capital markets. This is, however, not to imply that if a new form of comprehensive corporate reporting were to be invented tomorrow, the analyst function would become useless. Rather, the suggestion is made that looking at the types of information financial analysts consider important and convey to their “customers”, the investors and fund managers, constitutes a valuable contribution to business reporting. Uncovering which types of information the capital market requires, and thus which types of information companies should be disclosing in their corporate reports, is achieved by analyzing the information content of fundamental analyst reports. A few previous studies have compared disclosure practices between analyst and annual reports (cf. Arvidsson 2003, Orens & Lybaert 2004). However, these studies fail to recognize the immense differences between recurrent and fundamental analyst reports. Therefore, this study makes an important differentiation between two types of analyst reports, namely the recurrent analyst reports and the fundamental analyst reports. This is an important distinction to make, because they serve distinctly different purposes, and different types of events trigger their production. It is rather like distinguishing between annual reports and quarterly earnings announcements. It would not make sense to analyze the information content of an earnings announcement and state that the 2.
(4) company’s annual report was lacking in informativeness. In practice the recurrent analyst reports are of a shorter format. More importantly, they are typically updates on an existing base of knowledge. In contrast to this, the more fundamental analyst reports are to a greater extent concerned with forming a new knowledge-base. In relation to solving the problems with present corporate reporting practices, GarciaAyuso suggests that, “[m]anagers must use a language that financial analysts and investors are able to understand. They have to provide explanations of the value creation process in the firm and make clear links between intangible investments and future value creation” (2003, 64). Thus, Garcia-Ayuso advocates for precisely the point of departure taken in this study. By studying the information disseminated through fundamental analyst reports, this paper contributes by identifying the language and themes considered by the market for information participants. Research confirms that analysts’ reports and recommendations are considered informative with respect to investment decisions (Hirst et al. 1995), and also that the analysts’ final recommendations, despite their abbreviated form, have value for investment decisions (Womack 1996, Barber et al. 2001). Also, Frankel et al. (2002) confirm that analyst research helps prices reflect information about a security’s fundamentals. However, Krishnan & Booker (2002) only find that analyst recommendations reduce investors’ disposition errors in the case where they are supported by additional information in the form of a report. This indicates that while the analysts’ role may restrict itself to merely pre-announcing earnings numbers in connection with annual earnings announcements, and that their real value-adding activities relate to conducting fundamental research and supplying a more detailed understanding of the company’s value creation logic, strategy etc. Typically, the analysts create informativeness in comparison to the fund managers themselves and thus justify their existence by specializing by industry (Al-Debie & Walker 1999, 262) and by utilizing synergies between research functions within the investment bank. Investigating which types of information analysts convey to investors through their fundamental reports will render important insights for the future development of business reporting practices. Krishnan & Booker (2002) find that supplying additional information that supports the analysts’ position in the form of an analyst report reduces investors’ disposition errors. Thus, it can be argued that analyst reports constitute a strong proxy for the capital markets’ information demand. In this manner, the present study, like its business reporting counterparts (cf. McEwen & Hunton 1999), takes its 3.
(5) point of departure in the users’ needs of analysts and investors. By analyzing fundamental analyst reports, this paper examines the types of information analysts, as producers of transparency; consider when extending their knowledge-base. According to March & Olsen (1989), human behaviour stems from a conception of necessity rather than objective preferences (ibid, 161), and is therefore associated with the individual’s sense of identity more than with optimal choice. This perspective on human behaviour sees action as driven by a logic of appropriateness. Because the market for information is made up of individual actors, the notions of the neoclassical interpretation of the capital market, entailing that interaction merely relates to supply and demand and that contracts are the only established relationships (Söderbaum 2002, 194), is seen as being inconsistent with reality. Rather, building on the notions of interaction being based on multifaceted relationships between responsible actors, and the fact that such relationships are based on cooperation and considerations of trust and fairness, the capital market can be perceived from an institutional perspective (Söderbaum 2002). Here values, identity and experience become guiding principles for behaviour. Rather than emphasizing personal gain in relation to other actors, a community-based paradigm prevails. Therefore, decisions to conduct and disseminate fundamental research may be driven by appropriate patterns of behaviour, rather than optimizing decisions. The remaining part of this paper examines previous studies of the information content of analyst reports, arguing that the inability to distinguish between the recurrent earnings-triggered analyst reports and the types of reports that are a result of actual fundamental research on the company constitutes a problem with respect to the validity of their results. Furthermore, applying a content analysis of 12 fundamental analyst reports of a large Danish medico-tech company on a series of predefined themes attained from authoritative business reporting literature, the paper uncovers which types of information the capital market participants consider relevant for informing investment decisions. In this manner the paper contributes to the business reporting debate.. 4.
(6) 2. Previous studies of analysts’ reports and information use. Two studies, Rogers & Grant (1997) and Previts et al. (1994), conduct content analyses of information contained in analyst reports. Both argue that the content analysis of analyst reports will unveil important insights about users’ information needs; an aspect which this paper argues can be forwarded to enhancing business reporting practices. Previts et al. (1994, 65) find that analysts extensively consider non-financial information, including company risks, anticipated changes in future earnings, the competitive position of the company, and the quality of management and strategy. In a similar manner, Dempsey & Gatti (1997) induce that financial analysts to a great extent recognize the value of non-financial measures as leading indicators of the long-term financial success of companies. Schipper (1991) concludes that narrative information is useful for financial analysts. In relation to this, Rogers & Grant (1997) investigate the extent to which analysts copy information from the company’s annual report into their own analyst reports – A study which, thus, is concerned with identifying the value-added nature of the information disseminated in analyst reports. It can be contended that such a quantitative measure might not constitute a correct proxy for this value-added hypothesis, as the method does not indicate anything about e.g. news value of additional information, or where it is situated in the report. Despite problems in establishing a consistent method for evaluating the value-added nature of the content of analyst reports, this is an important perspective to investigate in order to contribute to corporate reporting practices. Two recent studies have focused on this issue. Orens & Lybaert (2004) and Arvidsson (2003) both compare the content of analyst and annual reports by applying a disclosure index. However, by using the disclosure index method, these studies are not able to draw conclusions in relation to the relative importance of the themes. For this reason, the present study applies a content analysis method that takes into account the frequency with which disclosures are made according to each theme. According to Berg (1998), the frequency with which information occurs in such reports is a useful proxy for magnitude and importance. It is thus contended that a more qualitative content analysis methodology than the disclosure index method must be applied, despite the fact that this requires a very stringent set of methodological considerations.. 5.
(7) There exists another key deficiency in previous studies comparing disclosures between analyst and annual reports. This deficiency relates to the failure in distinguishing between fundamental and recurrent analyst reports. Arvidsson (2003) and Orens & Lybaert’s (2004) studies readily compare recurrent analyst reports with annual reports. Conducting a comparison on such premises is equivalent to comparing the annual report of one company with the quarterly earnings announcement of a second company and using this as a basis for drawing conclusions about their disclosure practices. It is therefore viewed as a key aspect in relation to establishing relevant results that content analysis studies in this topic distinguish between the recurring earnings analyses and the reports disseminated in connection with fundamental research. The methodology applied in this study will be enlightened upon in the following sections.. 3. Structure of the content analysis. There are several approaches to evaluating the content of analyst reports. One is to apply a disclosure index as done by Garcia-Meca & Conesa (2003) and Arvidsson (2003). While the application of disclosure content studies on reporting practices, including annual reports, analyst reports and also IPO prospectuses, has been widespread (cf. Marston & Shrives 1991, Jones & Shoemaker 1994), other studies apply more qualitatively oriented content analysis approaches to the study of analyst reports (cf. Breton & Taffler 2001, Beunza & Garud 2004). A seminal contribution applying this method is Govindarajan (1980), who analyses the use of cash flow and earnings discourse by financial analysts, while e.g. Breton & Taffler (2001) analyze the correlation between stock recommendation decisions and accounting information. For the purpose of conducting an investigation into the information content of analyst reports and comparing these results with existing business reporting practices, the content analysis will be structured according to themes derived from authoritative business reporting literature. Essentially, business reporting is concerned with satisfying users’ needs (cf. AICPA 1994, McEwen & Hunton 1999), and thereby also investors and analysts. As analyst reports are intended for investors, they too fall within this category. The following sections therefore establish an applicable framework for categorizing business reporting disclosures, and themes from a set of authoritative reports concerned with pinpointing the types of information companies ought to disclose in order to fulfill users’ needs will be identified.. 6.
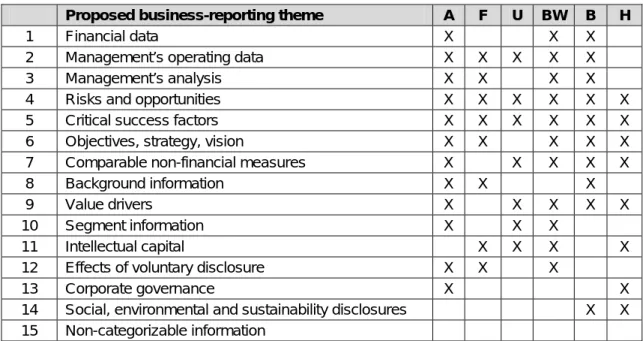
(8) For this purpose, six authoritative reports within the business-reporting debate have been purposively selected from a thorough literature review. These reports are: ‘Improving Business Reporting – A Customer Focus: Meeting the Information Needs of Investors and Creditors’ also referred to as the Jenkin’s Report (AICPA 1994); ‘Business and Financial Reporting, Challenges from the New Economy’ (Upton 2001); ‘Unseen Wealth’ (Blair & Wallman 2001); ‘Improving Business Reporting: Insights into Enhancing Voluntary Disclosures’ (FASB 2001); ‘New Directions in Business: Performance Reporting, Communication and Assurance’ (Bray 2002); and ‘Sustainable Development Reporting: Striking the Balance’ (Heemskerk et al. 2003). The Jenkins Report (AICPA 1994) is viewed as a seminal contribution with respect to recommendations for the future developments of business reporting. Business reporting can be defined as all the information that a company provides about the company in order to help investors with capital allocation decisions (FASB 2001). In this respect, business reporting is more than merely financial statements, including aspects such as operating data, management’s analysis of data, and forward-looking information. Heemskerk et al. (2003, 57), for example, emphasize the necessity of corporate reporting to enable users to look forward. Relevance of corporate disclosure towards the capital market is perceived as a main driver of business reporting as the underlying premise that improving disclosure makes the capital allocation process more efficient and reduces the average cost of capital. Examples of guidelines providing companies with helpful ideas of how to describe and explain their investment potential to investors e.g. is given in the FASB report (2001). Almost as a mantra, it is argued that a disconnect exists in that economic and business systems are tracking, with ever increasing efficiency, a smaller and smaller proportion of the real economy (Eustace 2001, 6). Blair & Wallman argue that “[t]he lack of good information about the most important value drivers in individual firms, and in the economy as a whole, makes it more difficult for managers within firms and individual investors in the capital markets to make sensible resource allocation decisions” (2001, 58). The review of the six authoritative reports reveals a large extent of agreement as to which types of information are perceived as important to the market for information participants and other external stakeholders. In all, 14 separate categories are identified, and, for the purpose of the content analysis, a 15th category that catches all the text clauses which cannot be distributed among the other themes is included. 7.
(9) These themes are illustrated in table 1 along with an indication of which authoritative literature considered which themes. The 15 themes form the basis on which the coding and content analysis of the 12 analyst reports in the sample is carried out. The identified themes cover a wide spectrum of information, from the more traditional financial and operating data and management’s analysis of data to the more forward-oriented information such as critical success factors, strategy and intellectual capital. In a sense they constitute the content of what a so-called flagship performance report should contain (Bray 2002).. 1 2 3 4 5 6 7 8 9 10 11 12 13 14 15. Proposed business-reporting theme Financial data Management’s operating data Management’s analysis Risks and opportunities Critical success factors Objectives, strategy, vision Comparable non-financial measures Background information Value drivers Segment information Intellectual capital Effects of voluntary disclosure Corporate governance Social, environmental and sustainability disclosures Non-categorizable information A) F). A X X X X X X X X X X X X. F. U. X X X X X. X X X X. BW X X X X X X X. X. X X. X X X. X X X X. B X X X X X X X X X. X X X X X X. X. X X. Improving Business Reporting – A Customer Focus: Meeting the Information Needs of Investors and Creditors; also referred to as the Jenkins Report (AICPA 1994) Improving Business Reporting: Insights into Enhancing Voluntary Disclosures (FASB 2001). U). Business and Financial Reporting, Challenges from the New Economy (Upton 2001). BW). Unseen Wealth (Blair & Wallman 2001). B). New Directions in Business: Performance Reporting, Communication and Assurance (Bray 2002) Sustainable Development Reporting: Striking the Balance; also referred to as the World Business Council for Sustainable Development (WBCSD) report (Heemskerk et al. 2003). H). H. Table 1. The themes of the business reporting recommendations An identical study on annual reports was conducted by Nielsen (2004). By applying the exact same themes to categorize the information and the same methodology, this will enable a direct comparison between business reporting practices and the fundamental analyst report disclosures. Previous comparisons have either focused on identifying text copied directly from the annual report into the analyst report (Rogers & Grant 1997), or failed to recognize the principal difference between the types of analyst reports, i.e. fundamental versus recurrent analyst reports, like Arvidsson (2003) and Orens &. 8.
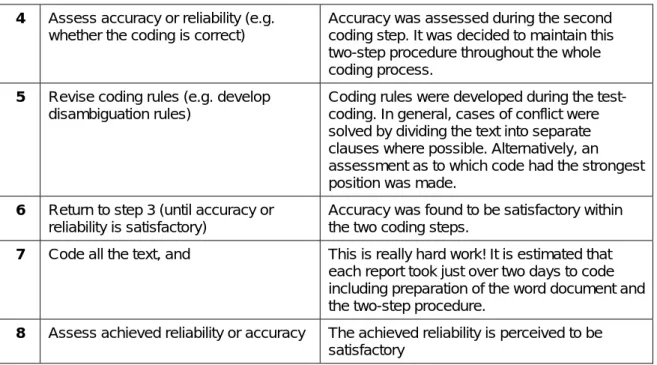
(10) Lybaert (2004), who both apply a disclosure index approach to studying this phenomenon.. 4. Methodology. This paper applies a content analysis approach to the study of fundamental analyst reports. The approach is a classical content analysis (Gerbner et al. 1969; Krippendorff 1980), where already determined codes are taken as a starting point (cf. Ryan & Bernard 2000, 785). Besides the importance of getting reliable data, reliability is ensured through a systematic and methodical analysis of the data. Therefore, the study utilizes a formal procedure building on the categories determined in the literature review of business reporting recommendations as well as taking its point of departure in Weber’s eight prescribed steps for ensuring reliability in the content-analysis (1985, 22-24). Table 2 below lists these steps along with a brief comment on how each of them has been mobilized in the present study. Applying content analysis as a disclosure measurement approach essentially concerns the construction of a measure for the quality of corporate disclosure. In the present study quality is thus proxied by the amount of disclosure according to the 15 themes. Despite the fact that Guthrie et al. (2004, 289), for example, argue that measures of the quality of disclosure also should take into account the form and location of the disclosures in the report (see also Guthrie & Parker 1990), the relative emphasis put on the disclosure in each theme is believed to give a sufficient indication of disclosure quality.. Weber’s steps. Mobilization of the step. 1. Define the recording units (e.g. word, word sense, sentence, or theme). The text is coded according to clauses of topic. In the paper, clauses are referred to as text units. Mostly this is per sentence; however, there are instances where a sentence includes several topics.. 2. Define the categories (e.g. through literature review). The categories are defined in the literature review of recommendational reports on business reporting. A 15th category catching leftover text is included, i.e. text which could not be attributed to any of the recommendational themes.. 3. Test coding on sample of text (apply abbreviated tags to represent the categories). The first report was coded in two steps. In the first step only the overall category was applied. The second step extended this with a sub-topic code.. 9.
(11) 4. Assess accuracy or reliability (e.g. whether the coding is correct). Accuracy was assessed during the second coding step. It was decided to maintain this two-step procedure throughout the whole coding process.. 5. Revise coding rules (e.g. develop disambiguation rules). Coding rules were developed during the testcoding. In general, cases of conflict were solved by dividing the text into separate clauses where possible. Alternatively, an assessment as to which code had the strongest position was made.. 6. Return to step 3 (until accuracy or reliability is satisfactory). Accuracy was found to be satisfactory within the two coding steps.. 7. Code all the text, and. This is really hard work! It is estimated that each report took just over two days to code including preparation of the word document and the two-step procedure.. 8. Assess achieved reliability or accuracy. The achieved reliability is perceived to be satisfactory. Table 2: Mobilization of Weber’s steps for ensuring reliability According to Unerman (2000), limitations of the content analysis method that must be considered relate to subjectivity in connection with the coding process. Furthermore, Unerman (2000, 674) argues that quantification is a major concern when applying this research method, because the application of different methods inevitably leads to different impressions of the relative importance of chosen themes. A good example of this is whether to measure the degree of disclosure according to sentences or as the percentage of pages relating to a certain theme. Ensuring process validity, also denoted internal validity (cf. Yin 1994), can be achieved via methodological coherence. In this paper, internal validity is secured through the application of the formal coding procedure described above. Reliability in content analysis approaches involves two separate issues (Milne & Adler 1999), namely demonstrating that the data produced from the analysis is reliable, but also verifying that the applied coding instrument is reliable. The former can be achieved via the use of multiple coders, and by reporting that the discrepancies between the coders are minimal. The latter is mainly a question of ensuring well-specified decision categories and decision rules. According to Milne & Adler (1999), the application of a rigorous approach to the latter issue reduces the need for multiple coders. Table 2 above thus describes how this study seeks to ensure a reasonable degree of reliability. This study bases its categorization of the narrative disclosures of the sample of analyst reports on the 15 categories above. Within each category, a series of appropriate items were identified. A number of disclosure studies were reviewed in order to establish 10.
(12) relevant sub-categories. The sub-categories chosen are mainly influenced by AICPA (1994) Beattie et al. (2002), GRI (2002), and Bukh et al. (2004). In total 75 separate items across the 15 themes were identified. These are depicted in appendix 1, which also reports the details of the disclosure-analysis and percentages for each category and sub-category. The advantage of applying a content analysis approach, rather than using e.g. a disclosure index (cf. Arvidsson 2003, Orens & Lybaert 2004), is that the study thereby analyzes all the disclosures in the reports rather than merely looking for the presence of particular items, like the approaches applied by Previts et al. (1994), Rogers & Grant (1997), and Breton & Taffler (2001). In this manner, all the narrative sections are analyzed, and the analysis gives an indication of the relative importance among the categories. All of the analyst reports analyzed in the study were obtained from the respective analysts themselves. The reports were then copied directly into a Word-document, excluding the sections that were not to be included in the analysis (see below). Two of the reports were only attainable in hard copy format, and were therefore transformed into a Word-document using a scanner and OCR software. Once the Word-documents were ready, a system of visible separators between the text clauses was added using the find and replace function in Word. Reliability in the coding process was secured using the formal procedure described below (see also Milne & Adler 1999). After the reports had been coded, the amount of text units related to each of the 75 subcategories was uncovered using the find function in Word. The results of the coding process were then transferred to Excel, where they were aggregated and analyzed accordingly. As a guiding rule, all narrative content was considered relevant to the analysis. Pictures, graphs and illustrative tables etc. were left out, although Frost & Wilmshurst (2000) argue that excluding pictures is a limitation to content analysis studies. However, because of the precise method applied in this study, where coding was conducted according to clauses and not according to e.g. percentage of page space used, it does not make sense to include these. In practice, the analysis thus included the whole analyst report except for tables of contents, summary tables of financial data and valuations, and the investment bank’s disclaimers. In total, 4.661 text clauses were coded and analyzed.. 11.
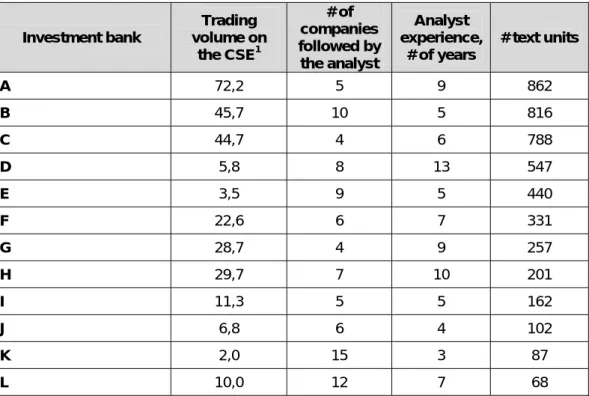
(13) 5. Data. The data collection is based on fundamental analyst reports on the Danish medico-tech company, Coloplast. Coloplast (www.coloplast.com), founded in 1957, is a worldwide provider of high quality and innovative healthcare products and services. In the fiscal year 2002/03, the revenue amounted to around 760 million Euros, and group profit before tax was approximately 117 million Euros. The company employs more than 6.000 people, 2.500 of them working in Denmark, and the firm has production facilities in six countries with approximately 75% of Coloplast’s products being produced in Denmark. Of the 13 analysts following Coloplast on a regular basis on 1 January 2004, 12 acknowledged that they wrote reports on the company on a regular basis. The analysts were asked to send the report written in connection with the most recent fundamental analysis they had conducted on the company. One fundamental analyst report from each investment bank was applied in the study.. A. 72,2. # of companies followed by the analyst 5. B. 45,7. 10. 5. 816. C. 44,7. 4. 6. 788. D. 5,8. 8. 13. 547. E. 3,5. 9. 5. 440. F. 22,6. 6. 7. 331. G. 28,7. 4. 9. 257. H. 29,7. 7. 10. 201. I. 11,3. 5. 5. 162. J. 6,8. 6. 4. 102. K. 2,0. 15. 3. 87. L. 10,0. 12. 7. 68. Investment bank. Trading volume on the CSE1. Analyst experience, # of years. # text units. 9. 862. Table 3: Analyst reports ordered by text units Table 4 provides descriptive statistics across independent variables and the disclosure themes derived from the authoritative business reporting literature, including the mean for each sub-category, standard deviation, and minimum and maximum values. All of the values with respect to disclosure are in absolute numbers of coded text-units.. 1. CSE; Copenhagen Stock Exchange. 12.
(14) The reason for choosing to focus on the fundamental analyst reports is that these to the best degree incorporate all the information deemed relevant according to the analysts, who argue that these reports represent an update on the existing knowledge-base. Other types of analyst reports, typically quarterly updates, updates in connection with the annual earnings announcements or updates in connection with adjustments to earnings expectations and recommendations were found to be fairly superficial, content-wise. For example, to illustrate the difference between a fundamental and recurrent analyst report, one investment bank sent eight analyst reports from the last two years. Two of these constituted fundamental analyses; one focusing on the company totalling 54 pages, and one focusing on the European medical technology sector totalling 84 pages. The remaining six analyst reports averaged just below 8 pages each despite the fact that two of them included a change of recommendation, which is usually a trigger for larger information content. Table 3 below lists the analyzed analyst reports according to number of text clauses. Descriptive statistics of the variables in the sample Total. Mean. Standard Deviation. Minimum Value. Maximum Value. Trading volume in Mio. DKr.. 283,2. 23,6. 21,67. 2,1. 72,2. # of companies followed …. 91. 7,6. 3,40. 4. 15. Disclosure (# of text units) across reports. 4.661. 388,4. 298,04. 68. 862. Disclosure (# of text units) across categories. 4.661. 310,7. 383,31. 2. 1.384. BI. 1384. 115,3. 109,80. 7. 295. Analyst’s analysis of data. ANA. 1162. 96,8. 61,45. 32. 227. Segment information. SEG. 407. 33,9. 25,61. 8. 86. Risks and opportunities. RIO. 306. 25,5. 26,53. 1. 71. Financial data. FIN. 293. 24,4. 24,13. 2. 88. Non-categorizable information. NON. 256. 21,3. 30,05. 0. 95. Critical success factors. CSF. 218. 19,4. 14,35. 0. 43. Objectives, strategy & vision. OSV. 207. 17,3. 18,89. 1. 59. VD. 183. 15,3. 13,28. 1. 37. Management’s operating data. MAD. 129. 10,8. 8,75. 1. 26. Comparable non-financial measures. COM. 57. 4,8. 4,81. 0. 13. Intellectual capital. IC. 32. 2,7. 4,31. 0. 12. Corporate governance. CG. 8. 0,7. 2,31. 0. 8. Effects of voluntary disclosure. EFF. 2. 0,2. 0,39. 0. 1. Social and sustainability disclosures. SOC. 2. 0,2. 0,58. 0. 2. Sub-categories: Background information. Value drivers. Table 4: Descriptive statistics of the variables 13.
(15) 6. Analysis and discussion of results across disclosure categories. Figure 1 illustrates the results of the content-analysis across the 15 categories in percentage of the total amount of disclosure. The figure includes the sample mean for each disclosure-category along with the minimum and maximum values in order to visualize the deviations within each category. The category disclosed upon the most is ‘background information’ (labelled ‘BI’), which accounts for 29,7% of the total disclosure in the sample. Interestingly, this category also has the highest correlation with the analyst reports’ total amount of disclosure, the correlation coefficient being 0,957. This indicates that the analysts writing the most comprehensive fundamental reports also are the ones including the most information on this theme. The five analyst reports with the greatest content of background information account for over 82% of the disclosures on this theme. The background information most readily supplied pertains to markets, products, the industry and the general development of the company. These four items account for 80% of the disclosures on this theme. The second most disclosed upon theme in the sample of analyst reports is ‘analyst’s analysis of financial and operating data’ (labelled ‘ANA’). It amounts to 24,9% of the total disclosures. Of the 1162 clauses within this category, over 65,3% of the items relate to the analysis of financial or management data, including pipeline data. Forwardlooking information, e.g. pipeline data, accounts for 26,1%, and macroeconomic and market trends 7,6%. Together, the two most disclosed upon overall themes in the analysis account for 54,6% of the total disclosure in the sample of analyst reports. Figure 1: Distribution of Narrative Disclosures across Main Topics 50 40 30 20 10 0 BI. ANA. SEG. RIO. FIN. NON. CSF. OSV. VD. MAD. COM. IC. CG. Min. EFF. Mean. SOC. Max. ‘Financial segment information’ (labelled ‘SEG’) totals 8,7% of the sample and is the third most disclosed upon theme. Of the 407 text clauses in this category, 63,4% are 14.
(16) related to information segmented by markets. The rest of the clauses are evenly distributed between information segmented on product and on geography level. In the category ‘risks and opportunities’ (labelled ‘RIO’), which accounts for 6,6% of the disclosures, risks account for 60% of the items; the rest being forward-looking information on opportunities for the company2. ‘Financial data’ (labelled ‘FIN’) accounts for 6,3% of the categorized information. Of these disclosures 65,9% relate to profit, which is also the only item in this category that all of the examined analyst reports include, meaning that sub-categories such as turnover and share performance are not always disclosed upon. ‘Non-categorizable information’, (labelled ‘NON’) totals 5,5%. This category of information seems to be driven by the relatively more comprehensive analyst reports, the top four of these amounting to 89% of these disclosures. The next three categories are some of the more forward-oriented categories. ‘Critical success factors’ (labelled ‘CSF’) account for 5,0%; ‘objectives, strategy and vision’ (labelled ‘OSV’) account for 4,4% – of which strategy makes up 87,9% – and ‘value drivers’ (labelled ‘VD’) are 3,9%. Surprisingly, ‘management’s operating data’ (labelled ‘MAD’) only account for 2,8% of the information disclosed. However, the data presented within this theme is typically analyzed extensively in the reports. For every ‘MAD’ clause identified, more than four ‘ANA’ clauses are disclosed. Lack of reliability of non-financial information is often coupled with the fact that it is difficult to use for decision-making, because it is not comparable with other companies’ measures. Especially capital market agents argue that it would be helpful to them if they could compare such indicators, preferably between companies and at least across time. Therefore it is rather surprising that ‘comparable non-financial information’ (labelled ‘COM’) only accounts for 1,2% of the disclosures in the sample of analyst reports. 80,7% of the items that are disclosed within this theme are comparisons with peers and competitors. The last four themes are virtually non-existent in the sample of analyst reports. Disclosures on ‘intellectual capital’ (labelled ‘IC’) total 0,7%; the ‘corporate governance’ category (labelled ‘CG’) 0,2%; while ‘effects of voluntary disclosure’ (labelled ‘EFF’) and ‘social and sustainability disclosures’ (labelled ‘SOC’) both aggregate to 0,0%. Orens & Lybaert (2004, 21) found similar results with respect to the 2. In a sample of annual corporate reports, the distribution between risks and opportunities was somewhat different. Here almost 96% of the items attainable to this category regarded risks, thus leaving opportunities almost missing.. 15.
(17) ‘IC’, ‘CG’, and ‘SOC’ themes in a study of Belgian fundamental analyst reports. It is worth noting that the corporate governance and social and sustainability themes only are considered by one analyst. The disclosures here came from an emphasized section of the analyst report and were thus a means of differentiation from the other analyst reports, i.e. they were this particular analyst’s perspective, also denoted ‘case’.. 7. Discussion of correlations. The number of companies followed by each analyst was initially regarded as a good proxy for the depth of the analyses conducted, because this would indicate the relative amount of time available per company. Therefore, also the amount of information disclosed in the fundamental analyst reports could be assumed to correlate with this aspect. Despite this, the number of companies followed by each analyst was not significantly correlated with the amount of information contained in each report. The Pearson correlation between the number of companies followed and the number of text units renders an insignificant result – a correlation of -0,307. Although insignificant, the fact that it is negative slightly indicates that our initial presumptions that the analysts conducting the most comprehensive fundamental research generally have smaller clusters of companies in their portfolio. However, it might just be that this correlates with a number of other particularities of matching job descriptions. A possible conclusion would be that the analysts’ job descriptions are more complex than merely dispersing their available time to research on their portfolio of companies. The particularities of the individual analyst’s function in the investment banking ‘value chain’ could be a much more influential factor on time consumption, time being an important and scarce resource, than merely the number of companies they are responsible for analyzing. Such particularities could be whether the analyst has direct client contact and to which extent, whether the analyst takes sales orders etc. Another factor influencing the analyst’s production of fundamental analyses could be his experience or lack of experience. It is a well known fact in the capital market that writing a fundamental report is a way for a new analyst to brand himself; thus arguing that new analysts would disseminate larger proportions of information because analysts need to establish a reputation in the market for information (Fogarty & Rogers 2005). The opposite argument could be that the most experienced analysts were those employed by the largest investment banks; and thus those with the largest customers, 16.
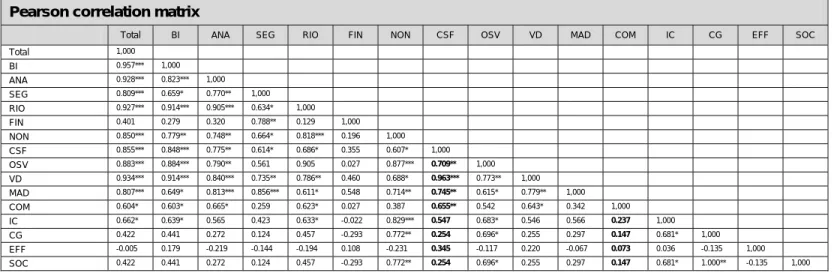
(18) largest trading volume and largest incentives for conducting thorough analyses. Despite these hypotheses disclosure and experience rendered a correlation of 0,237, and was thus insignificant regardless of the posed proposition. Two measures with respect to trading volume were initially considered of interest for comparison with the level of disclosure, because the size of the investment bank might be a proxy for the ability to set aside money for “analyst overhead” (Francis & Philbrick 1993). The measures considered were: trading volume on the Copenhagen Stock Exchange (CSE, henceforth), and total trading volume of each investment bank respectively. However, there are upsides and downsides connected with each measure. Applying the measure of trading volume on the CSE might give a skew impression of trading volume as the local banks will look relatively larger in comparison to international investment banks. On the other hand, total trading volume of the investment bank may not mirror its relative focus towards the market on which the case company operates, in our case the Danish financial market. Unfortunately, it was not possible to retrieve figures for the investment banks’ total trading volume on all markets. It was, however, possible to get figures for the trading volume of the investment banks on the CSE3. The correlation between extent of disclosure – and thus the degree of focus on the company – with trading volume on the CSE is 0,730. This indicates that trading volume pays for analyst overhead as confirmed by Philips & Zuckerman (2001) and is not really surprising as institutional investors compensate for the analysts’ services by trading through their respective banks. The correlation matrix depicted in table 5 is produced using Pearson correlations. This correlation statistic applies the actual values of the observations in the arrays being analyzed. Of the 15 sub-categories applied in the analysis, nine correlate significantly with the total extent of disclosure, i.e. significant at the 0,01 level. The correlation matrix indicates that the correlation between disclosure and trading volume primarily is driven by the sub-categories: ‘background information’, ‘value drivers’, ‘analysis of financial and operating data’, and ‘risks and opportunities’. However, the fact that such a large proportion of the sub-categories correlate with total disclosure, these categories amount to 92% of the sample, implies that valuable implications cannot be drawn from this statistic.. 3. All except one, which was not a member of the exchange and thus traded through other investment banks. 17.
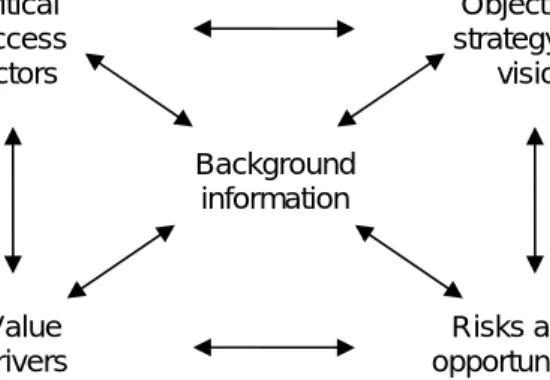
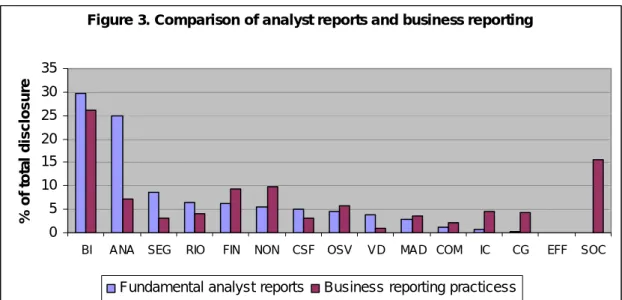
(19) Interestingly, ‘financial data’ is one of the sub-categories that correlates the least with total disclosure (a correlation coefficient of 0,401), which indicates that there might exist some minimum amount of information on the financial well-being of the firm, like e.g. profitability - Information that the analysts have to disclose within this category no matter the size of the report being disseminated.. Critical success factors. Objectives, strategy and vision Background information. Value drivers. Risks and opportunities. Figure 2. Significant inter-correlations between sub-categories With respect to correlations between the sub-categories themselves, the significant correlations relate primarily to five particular sub-categories. The four of them; ‘risks and opportunities’, ‘critical success factors’, ‘objectives, strategy and vision’, and ‘value drivers’ seem to revolve around the fifth, ‘background information’. These relationships are depicted in figure 2 above. The four sub-categories mentioned are characterized by being forward-looking of nature, so in a sense there is a positive relationship between forward-looking information and background information. Precisely how this relationship is characterized cannot be answered through the present study, but a possible assumption could be that forward-looking information, in order to be comprehended fully, must be accompanied by an appropriate amount of information that explains the context of it.. 8. Comparison between fundamental analyst reports and present business reporting practices. A related study by Nielsen (2004) conducted a content analysis on a sample of annual reports from the Danish bio and medico technology industry, i.e. the same industry as Coloplast. Because the exact same methodology and thematic categorization as in the present study was applied, we are able to compare the results against each other. Figure. 18.
(20) 3 below illustrates the dispersion of the information contained in each type of reporting across the themes percentage wise. Figure 3. Comparison of analyst reports and business reporting. % of total disclosure. 35 30 25 20 15 10 5 0 BI. ANA. SEG. RIO. FIN. NON. CSF OSV. Fundamental analyst reports. VD. MAD COM. IC. CG. EFF. SOC. Business reporting practicess. This comparison renders some interesting results. First of all, because this study only considers fundamental analyst reports the results become more relevant, and secondly this analysis, as opposed to previous studies, is based on a qualitative content analysis. In both types of reports, background information was the most disclosed theme. It may have been pondered that analyst reports would contain a lot less background information, because it either would be considered too general to be decisive for stock triggers, or regarded as redundant in comparison with the information already disclosed in the annual report. Analysis of financial and operating data was one of the themes where the discrepancies between the two studies were greatest. Coming in as the 10th most disclosed upon category in annual reports with 3,6%, 25% of the information in the analyst reports was related to this theme. Significant differences were also evident with respect to segment information. Relatively, the analyst reports disclosed almost threefold that of the annual reports. Although there was a tendency for the fundamental analyst reports to disclose relatively more information on risks and opportunities, the differences here were not gigantic. There were, however, very different dispersions between the two sub-categories making up this theme, namely disclosures of risks and disclosures of opportunities. The analyst reports disclosed a lot more information on opportunities. Actually, 40% of the information related to this theme concerned opportunities. In comparison, this was only the case for 4% of this theme in the annual report study.. 19.
(21) Pearson correlation matrix Total. BI. ANA. SEG. RIO. FIN. NON. CSF. OSV. VD. MAD. COM. IC. CG. EFF. Total. 1,000. BI. 0.957***. 1,000. ANA. 0.928***. 0.823***. 1,000. SEG. 0.809***. 0.659*. 0.770**. 1,000. RIO. 0.927***. 0.914***. 0.905***. 0.634*. 1,000. FIN. 0.401. 0.279. 0.320. 0.788**. 0.129. NON. 0.850***. 0.779**. 0.748**. 0.664*. 0.818***. 0.196. 1,000. CSF. 0.855***. 0.848***. 0.775**. 0.614*. 0.686*. 0.355. 0.607*. OSV. 0.883***. 0.884***. 0.790**. 0.561. 0.905. 0.027. 0.877***. 0.709**. 1,000. VD. 0.934***. 0.914***. 0.840***. 0.735**. 0.786**. 0.460. 0.688*. 0.963***. 0.773**. 1,000. MAD. 0.807***. 0.649*. 0.813***. 0.856***. 0.611*. 0.548. 0.714**. 0.745**. 0.615*. 0.779**. 1,000. COM. 0.604*. 0.603*. 0.665*. 0.259. 0.623*. 0.027. 0.387. 0.655**. 0.542. 0.643*. 0.342. 1,000. IC. 0.662*. 0.639*. 0.565. 0.423. 0.633*. -0.022. 0.829***. 0.547. 0.683*. 0.546. 0.566. 0.237. 1,000. CG. 0.422. 0.441. 0.272. 0.124. 0.457. -0.293. 0.772**. 0.254. 0.696*. 0.255. 0.297. 0.147. 0.681*. 1,000. EFF. -0.005. 0.179. -0.219. -0.144. -0.194. 0.108. -0.231. 0.345. -0.117. 0.220. -0.067. 0.073. 0.036. -0.135. 1,000. SOC. 0.422. 0.441. 0.272. 0.124. 0.457. -0.293. 0.772**. 0.254. 0.696*. 0.255. 0.297. 0.147. 0.681*. 1.000**. -0.135. SOC. 1,000. 1,000. *** Correlation is significant at the 0.001 level (2-tailed) ** Correlation is significant at the 0.01 level (2-tailed) * Correlation is significant at the 0.05 level (2-tailed). Table 5: Correlations between independent variables and disclosure categories. 1,000.
(22) There was a series of themes where the differences were not that large. The analyst study found slightly less disclosure relating to the ‘FIN’, ‘NON’, ‘OSV’, ‘MAD’ and ‘COM’ themes, while slightly more disclosure were related to the ‘CSF’ and ‘VD’ themes. With respect to the latter two themes, which are considered to be capital market terminology, this is not surprising. In both studies comparable non-financial information and consideration of the effects of voluntary disclosure is virtually non-existent. In contrast, there were significant differences in the disclosure patterns with respect to the three themes ‘IC’, ‘CG’ and ‘SOC’. In the annual report study, these three themes amounted to 24,6% of all disclosure, whereas in the sample of analyst reports they amounted to a mere 0,9%. An interesting assertion can be made by comparing the analyst reports’ lack of disclosure within these three categories with their inclusion of significantly more information in relation to analysis of financial and operating data and segment information. Together these five categories account for almost the same relative share of disclosure, namely 35%.. 9. Conclusions. In the present paper the information content of 12 fundamental analyst reports was analyzed according to a series of themes derived from the debate on the future of business reporting. The contribution of the present study was twofold. On the one hand, the content analysis illustrates which types of information analysts consider when evaluating the strategic imperatives of the firm and updating their knowledge-base, and whether the thoroughness of the analyst’s research is related to the size of his employer and his job description. On the other hand, the contribution of the present study is to apply the thematic content of fundamental analyst reports as a proxy for how companies’ business reporting practices should be. A final contribution is to compare these reports with current business reporting practices from a similar sector. The thoroughness of the individual analysts’ research correlated significantly with the size of the investment bank on the specific market (the CSE) in terms of trading volume. This was expected as trading volume is essentially what reimburses the investment banks’ analyst overhead. The analysts’ thoroughness did not correlate significantly with the number of companies each analyst followed, although the relationship was negative as could be expected. This implied that the job descriptions of the analysts, being more.
(23) complex than merely stating the amount of companies in their ‘portfolio’, might be a better explanatory factor. The results of the content analysis across the categories illustrate that ‘background information’ about the company, i.e. information about products, markets and the industry, along with ‘analyst’s analysis of financial and operating data’ account for nearly 55% of the total disclosure in the fundamental analyst reports. In the ‘middlerange’, disclosure wise, are categories such as ‘financial segment information’, ‘financial information’, and ‘risks and opportunities’. Interestingly, a number of themes that have received much attention in the recent business reporting debate, namely ‘intellectual capital’, ‘corporate governance’, and ‘social and sustainability disclosures’, turned out to be virtually non-existent in the sample of fundamental analyst reports. Two possible explanations present themselves. Either the information is not considered relevant for understanding the future prospects of the firm, or the role such types of information in relation to the value creation process is not understood by the capital market agents, as likewise suggested by Holland & Johanson (2003), wherefore they leave it out. This poses an interesting proposition for future research. A possible interpretation of this result could be that such disclosures simply are not relevant to analysts and investors, not even when they are in the process of updating their knowledge-base with respect to the company. However, as the actors’ roles in the market for information and patterns of behaviour are driven by values and experience (Söderbaum 2002), it may take time before their reluctance towards new inputs and new types of information declines (cf. Norberg 2001). If e.g. the dominating party (the investors) in the market for information disregards certain types of information as relevant, it may be difficult for the supporting function (the analysts) to acknowledge them too, and consider them in their analysis processes. More qualitative research methods must be applied for further study of this proposition. According to Söderbaum (2002), roles and relationships are a key to the functioning of the market for information (see also Barker 1998). Unfortunately, this study cannot illustrate anything about the intricate relationships between the three parties constituting the market for information. The normative explanation of why the analysis of a company is conducted is that a new piece of information, or an event that triggers stock price movement, has been released or has occurred. But maybe a fundamental analysis is not prompted by so-called 22.
(24) triggers. Perhaps such a fundamental analyst report is a mechanism to brand the individual analyst or investment bank in the light of a unique perspective on the company (a unique trigger or long-term value driver), or it may be that the analyst happens to be new in the sector and therefore an analysis is carried out. In this light, a unique perspective on the company might be due to the individual analyst’s experience and identity, e.g. as an alternative analyst, as a more long-term oriented partner for the investors etc. However, being able to conclude on these ideas will have to wait for a future qualitative study of how the market for information functions. The results from the correlation matrix showed that nine sub-categories significantly correlated with the total amount of disclosure in the analyst reports. As these categories accounted for 92% of the sample, nothing meaningful can be inferred from this statistic. However, the sub-category ‘financial data’ was found to be the one least related to total disclosure, which implies that there exists some minimum level of disclosure on the financial well-being of the company that is always included in an analyst report, regardless of its overall thoroughness. Finally, let us briefly consider what these results, being applied as a proxy for the future of business reporting, imply. The results illustrate that categories such as: ‘analysis of data’ along with ‘financial segment information’, ‘risks and opportunities’, ‘critical success factors’, and ‘value drivers’ should have a relatively higher focus in companies’ business reporting. Further, companies should consider reporting on opportunities and not just on risks. Also, the study concludes that the capital market agents have some reluctance towards the types of information such as ‘intellectual capital’, ‘corporate governance’, and ‘social and sustainability disclosures’ that have received an immense focus in the recent business reporting debate. This does not imply that these themes are irrelevant for reporting purposes; rather they indicate that the market for information participants’ interest in them needs stimulation.. References AICPA. 1994. Improving Business Reporting – A Customer Focus: Meeting the Information Needs of Investors and Creditors; and Comprehensive Report of the Special Committee on Financial Reporting. New York: American Institute of Certified Public Accountants. Akerlof, G. 1970. The market for “lemons”: Quality, uncertainty and the market mechanisms, Quarterly Journal of Economics, Vol. 84, pp. 488-500.. 23.
(25) Al-Debie, M. & M. Walker. 1999. Fundamental Information Analysis: An extension and UK Evidence, British Accounting Review, Vol. 31, No. 3, pp. 261-280. Arvidsson, S. 2003. The Demand and Supply of Information on Intangibles: The Case of Knowledge-Intense Companies. Ph.D Thesis, Institute of Economic Research, Lund University. Barber, B., R. Lehavy, M. McNichols & B. Trueman. 2001. Can Investors Profit from the Prophets? Security Analyst Recommendations and Stock Returns, The Journal of Finance, Vol. 56, No. 2, pp. 531-563. Barker, R. 1997. Information Flows between Finance Directors, Analysts and Fund Managers: A Study of Accounting Information, Corporate Governance and Stock Market Efficiency. Judge Institute of Management Studies, Cambridge University, Research Paper No.1997/16. Barker, R. 1998. The Market for Information: Evidence from Finance Directors, Analysts and Fund Managers. Accounting and Business Research, Vol. 29, No. 1, pp. 320. Beattie, V., McInnes B. & Fearnley, S. 2002. Through the eyes of management: a study of narrative disclosures. Institute of Chartered Accountants in England and Wales. Berg, B. 1998. Qualitative Research Methods for the Social Sciences. Boston: Allyn and Bacon. Beunza, D. & R. Garud. 2004. Security Analysts as Frame-makers, Working paper, Department of Economics and Business, Universitat Pompeu Fabra. Blair, M. & S. Wallman. 2001. Unseen Wealth. Brookings Institution, Washington D.C. Bray, M. 2002. New Directions in Business: Performance Reporting, Communication and Assurance. The Institute of Chartered Accountants in Australia. Breton, G. & R. Taffler. 2001. Accounting information and analyst stock recommendation decisions: a content analysis approach, Accounting and Business Research, Vol. 31, No. 2, pp. 91-102. Bukh, P.N., C. Nielsen, Gormsen & J. Mouritsen. 2004. Disclosure of Information on Intellectual Capital in Danish IPO Prospectuses, Working paper, Aarhus School of Business. Dempsey, S.J. & J.F. Gatti. 1997. The Use of Strategic Performance Variables as Leading Indicators in Financial Analysts’ Forecasts, Journal of Financial Statement Analysis, Vol. 2, No. 4, pp. Eustace, C. 2001 The intangible economy: impact and policy issues, Report of the High Level Expert Group on the Intangible Economy, EU Commission. FASB. 2001. Improving business reporting: insights into enhancing voluntary disclosures. Steering Committee Business, Reporting Research Project. Financial Accounting Standard Board. Fogarty, T.J. & R.K. Rogers. 2005. Financial Analysts’ Reports: An Extended Institutional Theory Evaluation, Accounting, Organizations and Society, Forthcoming. Francis, J. & D. Philbrick. 1993. Analysts’ Decisions as Products of a Multi-Task Environment, Journal of Accounting Research, Vol. 31, No. 2, pp. 216-230. Frankel, R., S.P. Kothari & J.P. Weber. 2002. Determinants of the Informativeness of Analyst Research, MIT Sloan School of Management, Working Paper 4243-02. 24.
(26) Frost, G. & T. Wilmshurst. 2000. The adoption of environment related management accounting: An analysis of corporate environment sensitivity, Accounting Forum, Vol. 24, No. 4, pp. 344-365. Garcia-Ayuso, M. 2003. Factors Explaining the Inefficient Valuation of Intangibles, Accounting, Auditing & Accountability Journal, Vol. 16, No. 1, pp. 57-69. Garcia-Meca, E. & I.M. Conesa. 2003. The Relevance of Intellectual Capital Information in the Decision Making Process. An Empirical Study through Analyst Reports. Working Paper, University of Murcia. Gerbner, G., O.R. Holsti, K. Krippendorff, W.J. Paisley & P.J. Stone (Eds.). 1969. The analysis of communication content: Developments in scientific theories and computer techniques. New York: Wiley. Govindarajan, V. 1980. The Objectives of Financial Statements: An Empirical Study of the Use of Cash Flow and Earnings by Security Analysts, Accounting, Organizations and Society, Vol. 5, No. 4, pp.383-392. GRI 2002. Sustainability Reporting Guidelines. Global Reporting Initiative, Boston. Guthrie, J., R. Petty, K. Yongvanich & F. Ricceri. 2004. Using content analysis as a research method to inquire into intellectual capital reporting, Journal of Intellectual Capital, Vol. 5, No. 2, pp. 282-293. Guthrie, J. & L.D. Parker. 1990. Corporate social disclosure practice: a comparative international analysis, Advances in Public Interest Accounting, Vol. 3, pp. 159-75. Heemskerk, B., Pistorio & M. Scicluna (WBCSD). 2003. Sustainable development reporting: Striking the balance. World Business Counsel for Sustainable Development. Hirst, E., L. Koonce & P. Simko 1995. Investor Reactions to Financial Analysts’ Research Reports, Journal of Accounting Research, Vol. 33, No. 2, pp. 335-351. Holland, J. & U. Johanson. 2003. Value Relevant Information on Corporate Intangibles - Creation, Use, and Barriers in Capital Markets - Between a Rock and a Hard Place, Journal of Intellectual Capital, Vol. 4, No. 4, pp. 465-486. Jensen, M., & W. Meckling. 1976. Theory of the firm: Managerial behaviour, Agency Costs and Ownership Structure, Journal of Financial Economics, Vol. 3, pp. 305-360. Jones, M.J. & P.A. Shoemaker. 1994. Accounting Narratives: A Review of Empirical Studies of Content and Readability, Journal of Accounting Literature, Vol. 13, pp. 142– 184. Krippendorff, K. 1980. Content Analysis: An Introduction to its Methodology. London: Sage Publications. Krishnan, R. & D.M. Booker. 2002. Investors’ Use of Analysts’ Recommendations, Behavioural Research in Accounting, Vol. 14, pp. 129-156. Lev, B. & P. Zarowin 1999. The boundaries of financial reporting and how to extend them, Journal of Accounting Research, Vol. 37, pp. 353-385. March, J.G. & J.P. Olsen. 1989. Rediscovering Institutions: The Organizational Basis of Politics. New York: The Free Press. Marston, C.L. & Shrives, P.J. 1991. ‘The use of disclosure indices in accounting research: A review article’, British Accounting Review, vol. 23, pp. 195-210. McEwen, R.A., & J.E. Hunton. 1999. Is Analyst Forecast Accuracy Associated With Accounting Information Use? Accounting Horizons, Vol. 13, No. 1, pp. 1-16. 25.
(27) Milne, M. & R. Adler. 1999. Exploring the reliability of social and environmental disclosures content analysis, Accounting, Auditing & Accountability Journal, Vol. 12, No. 2, pp. 237-56. Nielsen, C. 2004. New Reporting Models – Plethora or Pertinent: Empirical evidence on the state of business reporting 10 years after the Jenkins, Working paper, Copenhagen Business School. Norberg, P. 2001. Finansmarknadens amoralitet och det kalvinska kyrkorummet: En studie i ekonomisk menatlitet och etik, The Economic Research Institute, Stockholm School of Economics, Stockholm. Orens, R. & N. Lybaert. 2004. The use of non-financial information by financial analysts: A content analysis approach. Paper presented at the 27th annual congress of the European Accounting Association 1-3 April 2004, Prague. Philips, D.J. & E.W. Zuckerman. 2001. Middle-Status Conformity: Theoretical Restatement and Empirical Demonstration in Two Markets, American Journal of Sociology, Vol. 107, No. 2, pp. 379–429. Previts, G., R. Bricker, T. Robinson & S. Young. 1994. A Content Analysis of Sell-Side Financial Analyst Company Reports, Accounting Horizons, Vol. 8, No. 2, pp.55-70. Rogers, R. & J. Grant. 1997. Content Analysis of Information Cited in Reports of SellSide Financial Analysts, Journal of Financial Statement Analysis, Vol. 3, No. 1, pp.1430. Ryan, G.W. & H.R. Bernard. 2000. Data management and analysis methods. In Handbook of Qualitative Research, second edition, N.K Denzin & Y.S. Lincoln (eds.). Thousand Oaks: Sage Publications. Schipper, K. 1991. Analysts’ Forecasts, Accounting Horizons, Vol. 5, No. 4, pp. 105121. Söderbaum, P. 2002. Business Corporations, Markets and the Globalisation of Environmental Problems. In Havila, V., M. Forsgren & H. Håkansson (Eds.), Critical Perspectives on Internationalisation, pp. 179-200. Amsterdam: Pergamon. Unerman, J. 2000. Methodological issues: reflections on quantification in corporate social reporting content analysis, Accounting, Auditing & Accountability Journal, Vol. 13, No. 5, pp. 667-80. Upton, W.S. 2001. Business and financial reporting: Challenges from the new economy. Special Report, Financial Accounting Standard Board. Weber, P.R. 1985. Basic Content Analysis. London: Sage Publications. Womack, K.L. 1996. Do Brokerage Analysts’ recommendations Have Investment Value? The Journal of Finance, Vol. 51, No. 1, pp. 137-167. Yin, R.K. 1994. Case Study Research: Design and Methods. London: SAGE Publications.. 26.
(28) Appendix 1 # text The financial report and related financial disclosures Capital expenditure Cashflow Debt Dividends Gearing Interst cover Profit & profitability measures Tax Turnover/sales Working capital Share performance Other Total Management's performance measurement and operating data Revenue/income Costs Productivity and production Innovation Quality Total Management's analysis of financial and nonfinancial data; Identification of and reasons for changes Financial data Management data Macroeconomic trends Market changes Forward-looking information, e.g. outlook & pipeline data Other external trends Total Risks and opportunities Risks Opportunities Total Critical success factors. % of category. % of total. 7 5 3 0 2 0 193 0 35 9 25. 2,4 1,7 1,0 0,0 0,7 0,0 65,9 0,0 11,9 3,1 8,5. OTH. 14 293. 4,8 100,0. MAD REV COS PRD INN QUAL. 56 15 8 28 22 129. 43,4 11,6 6,2 21,7 17,1 100,0. 517 242 48 41. 44,5 20,8 4,1 3,5. AFL AEX. 303 11 1162. 26,1 0,9 100,0. 184 122. 60,1 39,9. 306. 100,0. RIO RISK OPP. CAC CIB SEC REA. Objectives, strategy, and vision Objectives and goals Strategy Vision Mission Total Non-financial measures that are comparable across companies and over time Time-line Comparisons across peers and competitors Geographical comparisons Total. OSV OBJ STR VIS MIS. 67 26 127 13 233. 28,8 11,2 54,5 5,6 100,0. 19 182 5 1 207. 9,2 87,9 2,4 0,5 100,0. 4 46 7 57. 7,0 80,7 12,3 100,0. 17,8 14,9 17,8 28,8 0,0 0,9 2,5 5,1 8,7 1,7 0,4. COMP. 20 1384. 1,4 100,0. 29,7. 66 15 64 27 11 183. 36,1 8,2 35,0 14,8 6,0 100,0. 3,9. 73 76 258 407. 17,9 18,7 63,4 100,0. 8,7. 11 0 13 0 8 32. 34,4 0,0 40,6 0,0 25,0 100,0. 0,7. 0. 0,0. 0 2 2. 0,0 100,0 100,0. 3. 37,5. 0 5 8. 0,0 62,5 100,0. 0,2. 2 0 0 0 0 2. 100,0 0,0 0,0 0,0 0,0 100,0. 0,0. NON LINK STD. 6 21. 2,3 8,2. BACK. 229. 89,5. 256. 100,0. VD GRO EXC VIN VCS VDI. 2,8. Segment information Geography Products Markets Total Information on intellectual capital. SEG SGE SPR SMA. Employees Core competences Core knowledge and technology Organizational, structural & relational capital Patents Total Considerations of the effects of voluntary disclosure Competitive considerations Greater transparency towards the capital market Investor relations considerations Total Corporate governance metrics Board structure and assignments Division of power between board and management Governance in general Total Social and environmental disclosures Sustainability reporting Social aspects Employees quality of life Effects on society and community Environmental aspects Total Other and no code applicable Link to other source Accounting standards & policies Background information on illness/ disease or other information that is not linked specifically to the business or products Total. EMP CORE TECH ORG PAT. 24,9. 6,6. 5,0. 4,4. COM TIME PEER GEO. 247 206 246 398 0 13 35 70 121 23 5. Value drivers Growth drivers Excellence Innovation Company specific Industry specific Total. CSF. Activities Improving competitiveness Activities Improving the business Securing future profitability Realizing objectives, strategy and vision Total. BUS PROD IND MAR PROC CUS REL DIS REG MAN MSH. 6,3. ANA AFD AMD AMT AMC. % of category. Background information and business description General development of the business & company information Products Industry Markets Processes Customers Relationships Distribution External regulation Management; identity and background Major shareholders Compensation of management and shareholders incl. incentive plans Total. FIN CEX CF DBT DIV GEA INT PRO TAX TUR WOR SHR. # text. 1,2. Total (all 75 categories). % of total. BI. IC. EFF CC CM IR CG BOA POW GOV SOC SUS ASP EMQ ESC ENV. 6441. 0,0. 5,5 100,0.
(29) Working Papers from Management Accounting Research Group. M-2004-03. Christian Nielsen: Through the eyes of analysts: a content analysis of analyst report narratives.. M-2004-02. Christian Nielsen: The supply of new reporting – plethora or pertinent.. M-2004-01. Christian Nielsen: Business reporting: how transparency becomes a justification mechanism..
(30) ISBN 87-7882-026-X. Department of Accounting, Finance and Logistics Faculty of Business Administration. Aarhus School of Business Fuglesangs Allé 4 DK-8210 Aarhus V - Denmark Tel. +45 89 48 66 88 Fax +45 86 15 01 88 www.asb.dk.
(31)
Figure

+5

Related documents
1 shows the overall Architecture of F3TM, which con- sists of five process phases including the IdDS-Key Assignment Algorithm, the TFA for finding trust value can be briefly declared,
To provide a focus for their work, we offer seven principles based on research on good teaching and learning in colleges and universities.. Good practice in
Given that, although both types of company spend most of the value added to remunerate staff, the family company spends a higher proportion thereof on self-financing as compared
Most of the steps of TOPSIS can be easily generalized to a fuzzy environment, except max and min operations in finding the ideal solution and negative ideal solution1. Thus we
Fern Taylor szerelmes volt Ambrose Youngba, méghozzá tízéves kora óra, amikor a fiú még egészen másfajta dalokat énekelt, de ebben a pillanatban olyan szépnek látta
To determine whether endogenous switching regression classification of firms are sensitive to the choice of the initial values and/or the specification of the selection
Examples of techniques utilized to identify the chemical bonds and microstructure of amorphous and nanocrystalline carbon films include optical characterization methods such as
Now, whenever a change to the selected game is detected, the live setup will re-build HTML stats and play-by-play files for the game and send them to your FTP site; you will see
