_________________________________________________________________________________________________
© 2014-15, IRJCS- All Rights Reserved
Page -1
An Approach to Analyze Sentiments over Gaza Attacks
Based on Hadoop Ecosystem
Hanane EL MANSSOURI* Soufiane FARRAH El Houssaine ZIYATI Mohammed OUZZIF
RITM Laboratory, ENSEM - ESTC - UH2C, Casablanca, Morocco
Abstract— In last decade, sentiment analysis in social media, especially Twitter, has attracted a very large public of researchers, it helps them to make important decisions. In this paper we analyze sentiment of the people around the word about the attacks on Gaza. We use Tweet Archivist to collect data. Having established the data warehouse model via Hive, we propose an algorithm to calculate Sentiment, then we use HiveQL requests to constitute the fact table in Hadoop platform, finally we analyze the result obtained using Power Pivot and Power View of Excel 2013
Keywords— Sentiment analysis, Twitter, Hive, Hadoop
I. INTRODUCTION
Big data is a term for massive data sets having large, more varied and complex structure with the difficulties of storing, analyzing and visualizing for further processes or results [1]. These data are generated from online transactions, emails, videos, audios, images, click streams, logs, posts, search queries, health records, social networking interactions, science data, sensors and mobile phones and their applications. The analysis of these data is at the center of modern science and business [4,5].
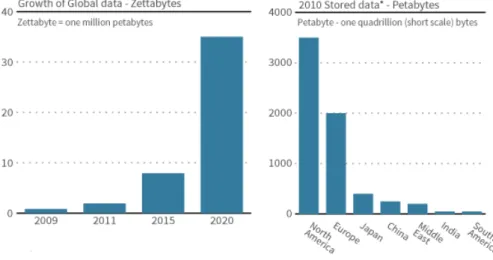
Figure 1. Evolution of Big Data
Figure 1 explains the evolution of Big Data from 2009 (one million petabytes) to more than 35 Zettabyte in 2020, North America is the country that generated the biggest quantity of data (more than 3500 Petabyte) [15].
The amount of data has been increasing and data set analyzing become more competitive. The challenge is not only to collect and manage vast volume and different type of data, but also to extract meaningful value from it [6]. Also needed, managers and analysts with an excellent insight of how big data can be applied. Companies must accelerate employment programs, while making significant investments in the education and training of key personnel [7].
Through TDWI (The Data Warehousing Institute) Big Data Analytics survey, benefits of big data are: better aimed marketing, more straight business insights, client based segmentation, recognition of sales and market chances, automated decision making, definitions of customer behaviors, greater return on investments, quantification of risks and market trending, comprehension of business alteration, better planning and forecasting, identification consumer behavior from click streams and production yield extension [8].
In 2012, The Human Face of Big Data accomplished as a global project, which is centering in real time collect, visualize and analyze large amounts of data. According to this media project many statistics are derived. Facebook has 955 million monthly active accounts using 70 languages, 140 billion photos uploaded, 125 billion friend connections, every day 30 billion pieces of content and 2.7 billion likes and comments have been posted.
_________________________________________________________________________________________________
© 2014-15, IRJCS- All Rights Reserved
Page -2
Every minute, 48 hours of video are uploaded and every day, 4 billion views performed on YouTube. Google support many services as both monitorizes 7.2 billion pages per day and processes20 petabytes (10.e15 bytes) of data daily also translates into 66 languages. 1 billion Tweets every 72 hours from more than 140 million active users on Twitter. 571 new websites are created every minute of the day [14].Within the next decade, number of information will increase by 50 times however number of information technology specialists who keep up with all that data will increase by 1.5 times [11].Twitter contains a very large number of very short messages created by the users of this microblogging platform; the contents of the messages vary from personal thoughts to public statements. As the audience of microblogging platforms and services grows every day, data from these sources can be used in opinion mining and sentiment analysis tasks.
Table 1 shows examples of typical posts from Twitter about attacks on Gaza
Wall Post
New post: "Palestinian woman succumbs to wounds sustained in Gaza war" http://t.co/qlesL2X1ZG #ramallah #gaza
StephenMcShane
RT @PalestinianMiss: Help #Gaza find its life in a peaceful manner.Make it happen for this 'raise fund' campaign http://t.co/BMRn735Tkh #Pa…
ELIZABETH FITZGERALD
@UniteWithIsrael This is our beautiful city #Gaza before and after Israeli bombings... Look at the destruction. https://t.co/2WHRgseMQu
Table.1. Example of Twitter posts with expressed user’s opinions
In this paper we analyze the sentiments of users about the attacks on Gaza. The contributions of our work are as follows:
Constitution of a Data warehouse model and its implementation in Hive DW
Presentation of the algorithm of calculation of sentiment data
Analysis of the result using power pivot and visualize the result with power view of Excel. II. STATEOFTHEART
A. Schema proposed State
Sentiment analysis is a technique to classify people’s opinions in product reviews, blogs or social networks. It has different usages and has received much attention from researchers and practitioners lately. In this study, we are interested on Gaza attacks based sentiment analysis. In other words, we identify the opinion polarities (positive, neutral or negative) expressed on attacks feature.
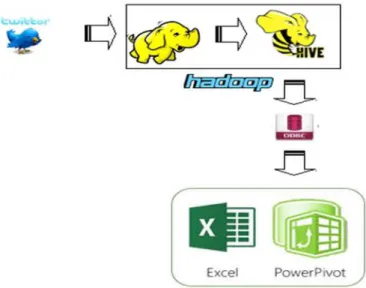
In this work we structured our DW in three steps; we import the data from Archivist Tweet using words keys: Gaza and Attacks, the output of this tool is a text file, we load this file into HDFS (1) using HQL queries, in the end we proceed to store data in our DW HIVE (2) and analyze it by Power Pivot 2013.
_________________________________________________________________________________________________
© 2014-15, IRJCS- All Rights Reserved
Page -3
(1) The Hadoop Distributed File System (HDFS) is a distributed file system designed to run on commodity hardware [11].(2) The Apache Hive ™ data warehouse software facilitates querying and managing large datasets residing in distributed storage. Hive provides a mechanism to project structure onto this data and query the data using a SQL-like language called HiveQL.
B. Data warehouse
Data warehouse is a data base used to collect, to ordain, to log and to stock information from operational database, in order to provide a base for decision support. Data warehouses are used to cross information not directly related (example: link the information of production systems with those of the customer support to derive queries that have significant).We present later the model of Data warehouse used.
C. Related Work
Twitter lunched in 2006, the first quantitative study on Twitter was published in 2010 by Kwak et al. [2] who investigated Twitter’s topological characteristics and its power as a new medium of information sharing. Oconnor extracts public opinion from Twitter using sentiment analysis and reports the possibility of using a proposed method instead of polls [20].
In contrast to the small number of academic studies of Twitter, numerous Twitter applications exist. Some are used for analyses of Twitter data. For example, Tweettronics [3] provides an analysis of tweets related to brands and products for marketing purposes. It can classify positive and negative tweets, and it can identify influential users. The classification of tweets might be done similarly to our algorithm. Web2express Digest [4] is a website that autodiscovers information from Twitter streaming data to find real-time interesting conversations. It also uses natural language processing and sentiment analysis to discover interesting topics, as we do in our study.
III.PROPOSEDMODEL A. Building Data warehouse
Data Warehouses (DW) and OnLine Analytical Processing (OLAP) [2] tools are used in Business Intelligence (BI) applications and beyond to support decision-making processes.
Data warehouse or data mart in the data model "star" is typical of multidimensional structures storing atomic or aggregated data, the star model uses a minim number of joints when asked, which makes this model an optimized one for analytical applications.
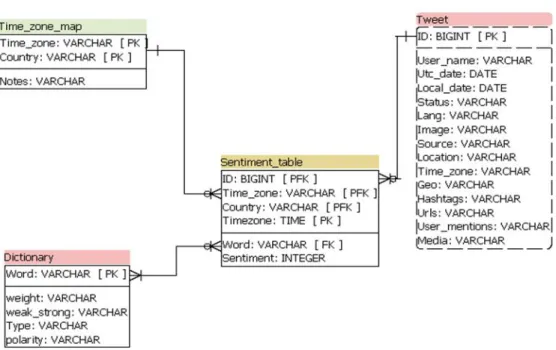
In our model (figure 2) the fact table allows us to calculate for each user the value of sentiment attached, if this value is negative it means that the user is against the attacks, if it’s positive the user supports the attacks, if the value is null, the user is neutral.
_________________________________________________________________________________________________
© 2014-15, IRJCS- All Rights Reserved
Page -4
The table Tweet contains all fields related to tweets imported, especially: Id, User_name, Utc_date, Status (the text of tweet), and Location …We use two external tables to complete our DW: Time_zone_map (represents time zone by country) and Dictionary (represents words of dictionary, the type (noun, verb…), the polarity (positive or negative), and the weight).
This DW is implemented in Hive data warehouse, an open source volunteer project under the Apache Software Foundation, it’s a component of Hortonworks Data Platform (HDP), and it provides a SQL-like interface to data stored in HDP.
B. Hadoop
Apache Hadoop [9] is a well-known project that includes open source implementations of a distributed file system [10] and a MapReduce parallel processing framework that were inspired by Google’s GFS [11] and MapReduce [12] projects.
The emergence of the open source Hadoop system eliminates the technical barrier to cloud computing. Several rising stars of international IT companies, such as Facebook and Twitter, are dedicated to making contributions to the Hadoop community as well as deploying and using this system to building their own cloud computing systems [20].
C. Hive
The primary reason to use Hive over a typical SQL database infrastructure is simply the size of the data and the length of time required to perform the query. Rather than dumping information into Hadoop, writing your own MapReduce query, and getting the information back out, with Hive you can (normally) write the same SQL statement, but on a much larger dataset.
Hive accomplishes this task by translating the SQL statement into a more typical Hadoop MapReduce job that assembles the data into a tabular format. This is where the limitation comes, in that Hive is not a real-time, or live querying solution. Once you submit the job, it can take a long time to get a response.
To implement this Data warehouse in Hive, we need to create tables by using Hive’s Query Editor, the query to use is: CREATE TABLE, then load data file into the table created, the query is: LOAD data INPATH ‘/’.
IV.DISCUSSION A. Extraction of sentiment data (Archivist)
We have used TWEET ARCHIVIST to collect data. Tweet Archivist Desktop is a Windows application that helps to archive tweets for data-mining and analysis. The output of this tool is a Json or an Excel file. This tool gives some views like; tweets by user, volume over time and language breakdown.
B. Data processing with Hadoop
The Data Platform used in the present work is Hortonworks Sandbox v2.1; a single-node Hadoop cluster running in a virtual machine.
We begin by coping Sentiment File to the Sandbox, using WinSCP application, then we build our Data warehouse in Hive by using HQL script, for that we begin by creating Tweet table from Sentiment data file, we use also two additional external tables; Time_zone_map and Dictionary, to constitute the Fact table called Sentiment_table.
C. Analysis tools : Power Pivot and Power View excel
Power Pivot add-in is a component of Excel 2013 used to perform powerful data analysis in Excel 2013. The Hortonworks ODBC driver enables to access Hortonworks data. To visualize the sentiment data we use Power View.
D. Algorithm
To calculate the sentiment field we apply the following algorithm: For each T (tweet)
While T <> 0
S( T) = Sum (αi*S(T(i))
End While End S: Sentiment
T(i) : The word number i of the tweet S( T) : Sentiment of the tweet T
αi: coefficient of weighting it equals to 1 if the word sentiment is weak and it equals to 2 if the word sentiment is
strong.
S(T(i)) is equal to 0 if the word is neutral, 1 if the word is positive and -1 if the word is negative, if S(T) is negative the tweet is negative, and if S(T) is positive the tweet is positive.
_________________________________________________________________________________________________
© 2014-15, IRJCS- All Rights Reserved
Page -5
Example: T = This Couple lost their home in #Israel's attack on #Gaza - But they defy devastationSentiment of this tweet is: S(T) = α1*S(This) + …+ αn*S(devastation)
E. Result
The table result represents the sentiment according to geographical zone, the results on the world map is shown below:
Figure 4. The percentage of negative and positive sentiment all over the world
92,17% of people around the world are against attacks in Gaza, 4,4% are neutral, and just 3,3% are for the attacks. To analyze the power of words by country, we have established the following graph.
Figure 5. The average of sentiment is represented by country
Country Average of sentiment
THAILAND -23 SINGAPORE -22 JAPAN -14,475 INDIA -13 LIBERIA -13 BANGLADESH -12 DENMARK -12 ESTONIA -12 PERU -12 FINLAND -11
Table 2. Top ten of country sentiments
Positive Neutral Negative
_________________________________________________________________________________________________
© 2014-15, IRJCS- All Rights Reserved
Page -6
In this work, we proposed a method of analyzing tweets, to classify them into positive or negative classes, and weight the tweets according to the power of words contained in each tweet. To do this we have established a Data warehouse in HIVE (The DW of Hadoop framework) to enable comprehensive analysis of massive data volumes generated by the social network Twitter, as an application we analyzed the sentiment of people around the word about the Gaza attacks during a week, the result leads to the conclusion about the world opinion about this attack.V. FUTURWORK
In the present work we proposed a model of Hive DW to analyze Tweets data, based on proposed algorithm, the polarity of the sentiment words is determined in a preset table Dictionary, we try in the next work to build an Arabic dictionary to enable identifying the events in Arabic language.
The processed data used for our analyze derived from the free tool Tweet Archivist, in the future work we try to trait online streaming using Flume component.
REFERENCES
[1] Seref SAGIROGLU and Duygu SINANC, “Big Data: A Review.” IEEE, 2013.
[2] H. Kwak, C. Lee, H. Park, and S. Moon, “What is twitter, a social network or a news media?” inProceedings of the 19th international conference on World wide web, ser. WWW ’10. New York, NY, USA:ACM, 2010, pp. 591–600. [3] Y. Yorozu, M. Hirano, K. Oka, and Y. Tagawa, “Electron spectroscopy studies on magneto-optical media and
plastic substrate interface,” IEEE Transl. J. Magn. Japan, vol. 2, pp. 740–741, August 1987 [Digests 9th Annual Conf. Magnetics Japan, p. 301, 1982].
[4] R.D. Schneider, Hadoop for Dummies Special Edition, John Wiley&Sons Canada, 978-1-118-25051-8, 2012. [5] C. Eaton, D. Deroos, T. Deutsch, G. Lapis and P.C. Zikopoulos, Understanding Big Data: Analytics for
Enterprise Class Hadoop and Streaming Data, Mc Graw-Hill Companies, 978-0-07-179053-6, 2012.
[6] K. Bakshi, "Considerations for Big Data: Architecture and Approach", Aerospace Conference IEEE, Big Sky Montana, March 2012.
[7] B. Brown, M. Chui and J. Manyika, "Are you Ready for the era of ‘Big Data’? " McKinsey Quarterly, McKinsey Global Institute, October 2011.
[8] P. Russom, "Big Data Analytics ", TDWI Best Practices Report, TDWI Research, Fourth Quarter 2011. [9] C. Tankard, "Big Data Security", Network Security Newsletter, Elsevier, ISSN 1353-4858, July 2012. [10] T. White, Hadoop: The Definitive Guide: The Definitive Guide. O’Reilly Media, Inc., 2009.
[11] K. Shvachko, H. Kuang, S. Radia, and R. Chansler, “The Hadoop Distributed File System,” in 2010 IEEE 26th Symposium on Mass Storage Systems and Technologies (MSST), 2010, pp. 1–10.
[12] S. Ghemawat, H. Gobioff and S. T. Leung, “Google File System”, In Proc. of the Nineteenth ACM Symposium on Operating Systems Principles (SOSP’03), Lake George New York, 2003, pp. 29-43.
[13] J. Dean and S. Ghemawat, “Mapreduce: Simplified Data Processing on Large Clusters”. In Proceedings of the 6th Conference on Symposium on Opearting Systems Design & Implementation (OSDI’04), Berkeley, CA, USA, 2004, pp.137-150.
[14] Jing Zhang, Gongqing Wu, Xuegang Hu and Xindong Wu, “A Distributed Cache for Hadoop Distributed File System in Real-time Cloud Services“,2012 ACM/IEEE 13th International Conference on Grid Computing.