National Louis University National Louis University
Digital Commons@NLU
Digital Commons@NLU
Dissertations
4-2019
Attendance Matters! We Must Decrease Student Truancy and
Attendance Matters! We Must Decrease Student Truancy and
Absenteeism
Absenteeism
Robert G. Hubbird National Louis UniversityFollow this and additional works at: https://digitalcommons.nl.edu/diss
Part of the Art Education Commons, Curriculum and Instruction Commons, Educational Leadership Commons, Elementary Education Commons, and the Gifted Education Commons
Recommended Citation Recommended Citation
Hubbird, Robert G., "Attendance Matters! We Must Decrease Student Truancy and Absenteeism" (2019). Dissertations. 421.
https://digitalcommons.nl.edu/diss/421
This Dissertation - Public Access is brought to you for free and open access by Digital Commons@NLU. It has been accepted for inclusion in Dissertations by an authorized administrator of Digital Commons@NLU. For more information, please contact [email protected].
A THREE - PART DISSERTATION:
Part I: Do After-School Performing Arts Programs Impact Student Attendance? Part II: Attendance Matters! We Must Decrease Student Truancy and Absenteeism.
Part III: Attendance Matters! A Policy Advocacy Document.
Robert Gabriel Hubbird
Educational Leadership Doctoral Program
Submitted in partial fulfillment of the requirements of
Doctor of Education
in the Foster G. McGaw Graduate School
National College of Education National Louis University
ii
A THREE - PART DISSERTATION:
Part I: Do After-School Performing Arts Programs Impact Student Attendance? Part II: Attendance Matters! We Must Decrease Student Truancy and Absenteeism.
Part III: Attendance Matters! A Policy Advocacy Document.
Robert Gabriel Hubbird
iii
Document Origination Statement for Digital Commons @ NLU
This document was created as one part of the three-part dissertation requirement of the National Louis University (NLU) Educational Leadership (EDL) Doctoral Program. The National Louis Educational Leadership EdD is a professional practice degree program (Shulman et al., 2006). For the dissertation requirement, doctoral candidates are required to plan, research, and
implement three major projects, one each year, within their school or district with a focus on professional practice. The three projects are:
● Program Evaluation ● Change Leadership Plan ● Policy Advocacy Document
For the Program Evaluation candidates are required to identify and evaluate a program or practice within their school or district. The “program” can be a current initiative; a grant project; a common practice; or a movement. Focused on utilization, the evaluation can be formative, summative, or developmental (Patton, 2008). The candidate must demonstrate how the evaluation directly relates to student learning.
In the Change Leadership Plan candidates develop a plan that considers organizational possibilities for renewal. The plan for organizational change may be at the building or district level. It must be related to an area in need of improvement, and have a clear target in mind. The candidate must be able to identify noticeable and feasible differences that should exist as a result of the change plan (Wagner et al., 2006).
In the Policy Advocacy Document candidates develop and advocate for a policy at the local, state or national level using reflective practice and research as a means for supporting and promoting reforms in education. Policy advocacy dissertations use critical theory to address moral and ethical issues of policy formation and administrative decision making (i.e., what ought to be). The purpose is to develop reflective, humane and social critics, moral leaders, and
competent professionals, guided by a critical practical rational model (Browder, 1995). Works Cited
Browder, L.H. (1995). An alternative to the doctoral dissertation: The policy advocacy concept and the policy document. Journal of School Leadership, 5, 40-69.
Patton, M. Q. (2008). Utilization-focused evaluation (4th ed.). Thousand Oaks, CA: Sage. Shulman, L.S., Golde, C.M., Bueschel, A.C., & Garabedian, K.J. (2006). Reclaiming
education’s doctorates: A critique and a proposal. Educational Researcher, 35(3), 25-32.
Wagner, T., et al. (2006). Change leadership: A practical guide to transforming our schools. San Francisco: Jossey-Bass.
iv
Copyright by Robert Gabriel Hubbird, 2019 All rights reserved
v
ABSTRACT
This three-part dissertation concentrates on student attendance. It is clear that we have a student attendance problem in our nation, particularly in urban school districts. There have been other studies, discussions, and debates on how to improve student attendance, but identifying a single policy, program, incentive, and/or intervention to positively impact absenteeism is difficult. Student absenteeism has and will continue to be a national problem. Many factors play a role in student attendance, to a certain degree, some are controllable and others are extremely difficult to affect.
Part II of this dissertation is a Changed Leadership Plan focusing on a small suburban school district with stagnant average daily student attendance, high chronic truancy, and high absenteeism. By increasing student attendance data for the district, then in turn, we are also increasing a student's instructional time. Wagner’s (2008) change leadership model 4C’s (culture, context, conditions, and competencies) were used to assess the district’s student attendance. The goal of this change plan is to significantly decrease student truancy and absenteeism in a district to increase their instructional time.
The overarching challenge is for school districts to be able to proactively manage student attendance to ensure children are in school on a regular basis.
Creating a culture of collaboration for student attendance, shared responsibility, and trust are key to address our national student attendance crisis.
vi
PREFACE
As a minority male who attended public schools with low student attendance; and, more importantly, as a school leader, leveraging resources to combat low student attendance, it is extremely important to me to find effective practices that reduce absenteeism. As a child attending inner city public schools, my dream was not to be an educator, but to be a tax
accountant. Numbers were and continue to be my passion. In order to make some extra money in undergraduate school, I started to tutor students for the SAT and ACT. The passion that
developed inside of me from help others learn was unmeasurable. I never wanted to be an educator, but somehow the calling to serve others was too loud for me to ignore.
As a servant leader in public education, it is my responsibility to provide all students with a quality education by moving teaching and learning forward. This three-part dissertation
focuses on combating student absenteeism. In order to improve student attendance, my past experiences confirm that one must be able to explain the strength and the direction of the relationships between student attendance and the targeted incentives. I believe after-school performing arts programs are key to improving student attendance.
In 2012, I was selected as the principal of a low performing Pre-Kindergarten through 8th grade school with unacceptable student attendance. I took what I had learned from the previous two schools I led and developed an action plan to transform the school into a high performing Science, Technology, Engineering, Arts, & Mathematics (STEAM) school. Within three years, the school had seen significant double digit growth in their academic data, nearly a 5% increase in their student attendance data, and significant double digit decreases in the number of student infractions.
vii
My past experiences as an administrator in schools with historically low student
performance, low student attendance, high chronically truant students, and high absenteeism has shown me the importance of student attendance. People do not go to places that they do not like. If student attendance is low, then perhaps it is because students do not like the school or maybe because no one at the school has established a meaningful relationship with them or maybe those children are not being challenged academically. Regardless of the rationale, low student
attendance plus high chronic truancy equals low student performance for a school district. My professional journey has shown me that there is a positive correlation between student attendance and after-school performing arts programs, but I did not have research-based evidence to show support for this belief.
Part I of this dissertation lays the groundwork to develop research-based data supporting a positive correlation between student attendance and after-school performing arts programs.
Part II of this dissertation uses Wagner’s 4C’s to develop an “As Is… and “To Be…” change plan for a district by focusing on their student attendance. The purpose of the change plan is to drastically decrease student truancy and absenteeism in a district in order to increase their instructional time.
viii
ACKNOWLEDGEMENTS
As a marathon runner, crossing the finish line of this dissertation was by far the hardest race I have ever completed. It was a race against myself. A race without limits, time, or direction, but I was determined to find my way and complete the race. My confidence, work ethic, professional responsibilities, and family obligations were stretched beyond all limitations.
Crossing the finish line of this doctoral race was a result of the love, support, and encouragement of many people.
If it weren’t for my loving family, supportive friends, and my amazing mentors, I could not have completed this journey. Their patience and support helped me more than they’ll ever know. First and foremost, I would like to acknowledge my beautiful children, Ximena and Octavio. During these years, I thank you for putting up with my limited availability and long work hours. I thank you for giving me the space to complete this work. Your patience and understanding during this time was greatly appreciated; know that you are loved.
To all of my family members, thank you for believing in me!
To all of my mentors, thank you for your words of wisdom, for being an active listener, and for pushing me forward!
ix
DEDICATION
To the fiery spirit of my beloved grandmother, Dolores Galloges Tevenal Talavera Diaz! Thank you for giving me the strength to always believe…
x TABLE OF CONTENTS ABSTRACT………... v PREFACE………... vi ACKNOWLEDGMENTS……..……… viii DEDICATION……… ix
List of Figures ...……… xii
Section I: Introduction……….. 13
Statement of Problem ………. 13
Rationale ……….... 16
Goals……….... 17
Demographics …...……….. 17
Section II: Assessing the 4C’s ...……….. 21
Competencies...………. 23
Conditions …………...……… 23
Culture ………. 24
Context ……….... 24
Section III: Research Methodology……...………….……….. 26
Research Design Overview………. 26
Recruitment……….. 28
Participants………... 28
Data Gathering Techniques(s)...……….. 30
Quantitative Technique(s) …..………. 31
Data Analysis Technique(s) ...………. 31
Surveys ………... 33
xi
Section IV: Relevant Literature ………... 35
After-School Programs……….... 35
Absenteeism ……….... 38
Section V: Data Analysis Interpretation ………...………….. 41
Teacher Survey Data ……….. 41
Parent Survey Data ………. 43
Student Survey Data ………... 47
Attendance Data ………. 51
Section VI: A Vision of Success (To Be) ……….... 54
Competencies...………. 54
Conditions …………...……… 55
Culture ………. 55
Context ……….... 55
Section VII: Strategies and Actions for Change ………. 57
Competencies...………. 57 Conditions …………...……… 57 Culture ………. 58 Context ……….... 59 References……… 60 Appendix A: 4C’s As Is ……….……….. 64 Appendix B: 4C’s To Be ……….…………...………. 65
Appendix C: Strategies & Action …….……….. 66
Appendix D: District L Student Survey……….. 67
Appendix E: District L Parent Survey ………..………….. 69
Appendix F: District L Teacher Survey ……….. 71
xii
LIST OF FIGURES
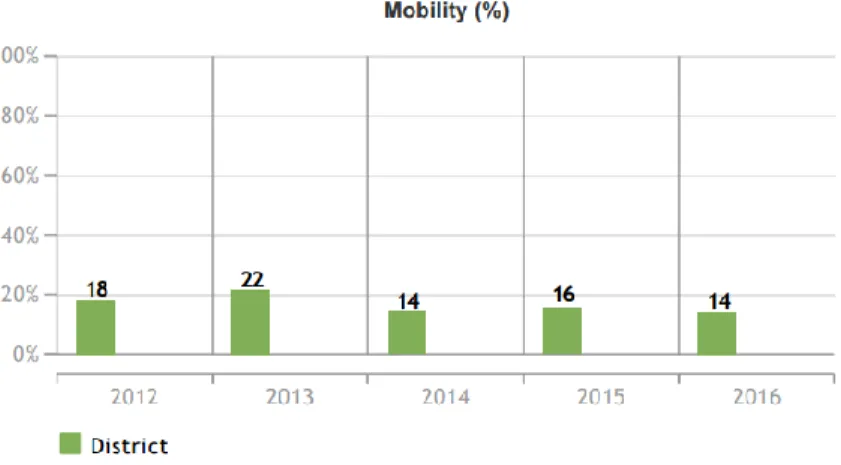
Figure 1: Mobility Rate ..………... 14
Figure 2: Chronic Truant ………... 15
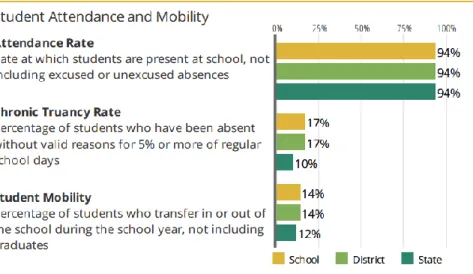
Figure 3: Student Attendance and Mobility ………...………... 18
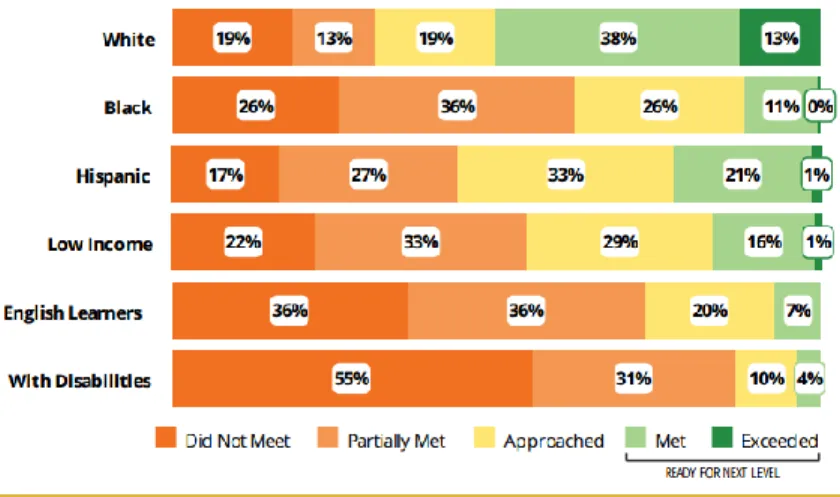
Figure 4: Success by Student Group ……...………...……….. 19
Figure 5: PARCC English Language Arts ...………...………. 19
Figure 6: PARCC Mathematics ...………...……….. 20
Figure 7: Students Collaborates with his/her peers more Frequently ..……….. 41
Figure 8: Improve his/her student attendance ………... 41
Figure 9: Improve his/her performance in reading ….………... 42
Figure 10: Improve his/her performance in math …..………... 42
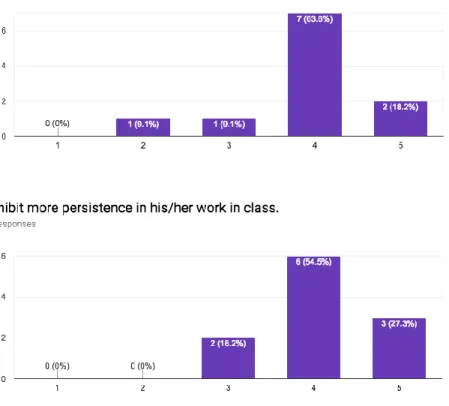
Figure 11: Improved his/her social skills & Exhibit more persistence in his/her work in class. 43 Figure 12: Student Grade Level ……….………... 44
Figure 13: My child is more interested in attending school ……….. 44
Figure 14: My child appears more engaged or interested in learning ………... 45
Figure 15: My child has shown improved reading performance because of participation in the after-school performing arts program ………. 45 Figure 16: My child has shown improved social skills performance because of participation in the after-school performing arts program ………. 46 Figure 17: Grade Level ………... 47
Figure 18: I am more interested in attending school ……….. 48
Figure 19: Participation in the after-school performing arts program has helped me learn to read better ………... 49 Figure 20: Participation in the after-school performing arts program has provided me a safe place to spend my time after-school ………... 50 Figure 21: Participation in the after-school performing arts has helped me to enjoy school more ………... 50 Figure 22: Attendance Data for the First Semester………. 51
13
SECTION I: INTRODUCTION
Our nation has a student attendance problem, particularly in urban school districts. The Department of Education’s Civil Rights Data Collection from 2013-14 found that half of the 6.5 million students who are chronically absent nationwide are recognized in just 4 percent of school districts. The analysis also shows that chronic absenteeism follows poverty wherever it is found in significant concentrations (U.S. Department of Education, 2014).Absenteeism is widespread because we do not uniformly define it so it cannot be effectively tracked or perhaps it is because 21st Century learners have innovative tools and endless access to information. Thus, they do not see the value in attending school on a daily basis in a system that is operating off 100 year old methodologies.Balfanz & Byrnes (2012) summarized the national attendance problem by stating it is not acted upon because it is not measured, so we fail to notice it. There have been many studies, discussions, and debates on how to improve student attendance, but identifying a single policy, program, incentive, and/or intervention to positively impact absenteeism is difficult. A quick Google Scholar search on “student attendance and achievement produce about 6,110 studies in under 0.05 seconds for the year 2019. Student absenteeism has and will continue to be a national problem. Many factors play a role in student attendance, in which, some are
controllable and others are extremely difficult to govern. Regardless, it is unacceptable that in the 2013 - 2014 school year, nearly 500 school districts within the United States had at least 30 percent of students missing 15 or more days of school (Blad, 2016).
Statement of the Problem
For the past five years, District L has averaged an average daily student attendance of 94% each year (Illinois Report Card, 2016). However, Figure 1 shows how the mobility rate has fluctuated over the past five years, but it is currently leveling off. There has been a growing body
14
of research to show that student mobility is a key academic indicator to identifying vulnerable students and their ability to be on-track to graduate. The mobility rate of a district is the
percentage of students who transfer in/out of the district between the first school day of October and the last school day of the year, not including graduates. Additionally, schools with high mobility rates generally have low attendance rates.
Figure 1: Mobility Rate
Illinois law defines “chronic truant” as a student who misses 5 percent of school days within an academic year without a valid excuse. To put that in terms of days, that would be equivalent to 9 school days out of the standard 180 day school year. “Chronic truants are at risk of academic and behavioral problems. Research shows that chronic truancy has been linked to serious delinquent activity in youth and to significant negative behavior and characteristics in adults” (Illinois Report Card, 2016, p. 2). Figure 2 shows a comparison of the percentage of students in the district and the state who have been classified as chronically truant over the past five years to see changes in the student population over time. Each year, District L has averaged a higher percentage of students identified as chronic truants than the state. As shown in Figure 2, for the 2015 - 16 school year, the difference was a massive 7%.
15
Figure 2: Chronic Truant
Based on a national poll conducted by the Partnership for 21st Century Skills with
registered voters, “Americans are deeply concerned that the United States is not preparing young people with the skills they need to compete in the global economy” (Partnership, 2015, p. 21). Many people have strong opinions on what those critical skills are, but that is not the purpose of this study. Regardless of what those skills are, a teacher cannot educate an empty seat. Students need to be in attendance to learn these critical skills. Hence, the purpose of this change plan will be to address student truancy/absenteeism in District L to increase a student's instructional time.
The data shows that the average day attendance can stay the same regardless of
fluctuations in chronic truancy or absenteeism. However, if this change plan can aide District L in decreasing the percentage of students identified as chronic truant and/or with high
absenteeism, then in turn, those students will receive more direct instruction from certified educators. As I continue to dive deeper into my research, I will hopefully be able to provide research-based evidence to support my hypothesis that with decreased chronic truancy / absenteeism, then a district increases students’ instructional time.
16 Rationale
My past experiences as an administrator in schools with historically low student
performance, low student attendance, high chronically truant students, and high absenteeism has shown me the importance of student attendance. People do not go to places that they do not like. If student attendance is low, then perhaps it is because students do not like the school or maybe because no one at the school has established a meaningful relationship with them or maybe those children are not being challenged academically. Regardless of the rationale, low student
attendance plus high chronic truancy equals low student performance for a school district. The last school I humbly served as the principal, I yielded huge success with integrating after-school performing arts programs as an incentive to get students to come to school. For example, within three years, that school had significant double digit growth in their academic data, significant double digit decreases in the number of student infractions, but more significantly the school experienced nearly a 5% increase in their student attendance data. These results led me to my most recent research into determining if there is a correlation between student attendance and participation in after-school performing arts programs (Hubbird, 2016). I am currently analyzing historical data to see which type of correlation exists; furthermore, I will analyze data from District L to see if the change plan strategies improved student attendance.My past professional experiences have proven to me that there is a positive correlation, but once I thoroughly analyze the data, I will be able to cite research-based evidence to show if my belief is true or not.
No matter what the data shows from my previous study, the fact remains the same that teachers cannot educate students who are not in attendance. If we want to prepare our students for the 21st Century, then we need them in school each day to provide a rigorous curriculum to better prepare them for the global economy.
17
District L has a stagnant average daily student attendance, plus high chronic truancy and high absenteeism, resulting in low academic performance as shown in Figures 4, 5, and 6. By increasing student attendance data for the district, then in turn, we are also increasing a student's instructional time. I am not arguing that attendance is the “silver bullet”, many additional factors influence academic growth. Unless a teacher is purposely trying to harm a child, increased instructional time is a win win. However, to tackle the district’s attendance issue, not only are interventions needed, but strategic collaboration with key stakeholders is also crucial.
Goals
The overarching goal of this change plan is to significantly decrease student truancy and absenteeism in District L to increase their instructional time. Additionally, I have several related goals for this change plan and they are as follows:
● To develop a tiered intervention plan for truancy and absenteeism.
● To develop a marketing plan around attendance for students, parents, and staff to take ownership of student attendance.
By focusing this change plan on decreasing District L’s chronic truancy and absenteeism, the hope is that that will increase the number of days a student has the following opportunities: engage in student discourse, develop problem solving skills, access to the curriculum, receive direct instruction from a certified teacher, collaborate with peers, and work on team building skills. This is not an exhaustive list, but it shines a light on the value of being in attendance at school each and every day.
Demographics
District L is a Pre-Kindergarten to Eighth Grade school district with over 1,000 students in one building. Located in the southeast suburbs of a major Midwest metropolitan city, the
18
student body is made up of 2% White, 55% Black, 42% Hispanic, and 1% Two or More Races. Within the district, 95% of the students are Low Income with 16% of students classified as English Learners and 12% of the students receive special education services.
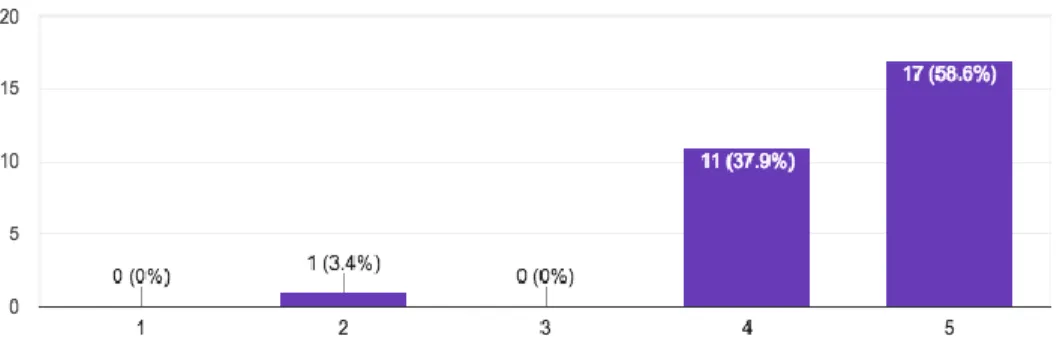
The district had a total of 57 certified teachers and a 62% teacher retention rate for the 2015 - 16 school year. The certified teachers are made up of 58.6% White, 25.6% Black, 12.2% Hispanic, and 3.6% Not Reported for the 2015 - 16 school year. In terms of certified teachers’ gender for 2015 - 16, 17.6% were Male and 82.4% Female (Illinois Report Card, 2016).
Figure 3: Student Attendance and Mobility
Figure 3 shows that during the 2015 - 2016 school year, the school/district averaged a 94% attendance rate which students were present at school, not including excused or unexcused absences. The school/district attendance rate is aligned to the overall state attendance rate. Diving deeper into the attendance data revealed that 17% of the students were absent without valid reasons for 5% or more of the regular school year (9 or more absences). The school/district has a Chronic Truancy Rate that is 7% higher than the overall state’s average. The percentage of students who transferred in or out of the school/district during the 2015 - 2016 school year, not including graduates, was 14% (Illinois Report Card, 2016).
19
Figure 4: Success by Student Group
Figure 4 shows that in the 2015 - 2016 school year, 51% of White students in the district Met/Exceeded the PARCC standards and are ready for the next level of math and reading instruction. However, only 11% of Black and 22% of Hispanic students in the district are ready for the next level of math and reading instruction. Furthermore, 17% of low income students, 7% of English Learners, and 4% of special education students have Met/Exceeded the PARCC standards and are ready for the next level of math and reading instruction (Illinois Report Card, 2016).
20
Figure 5 displays the percentage of students in the district who achieved scores in the 5 PARCC performance level categories for English Language Arts. In school year 2015, the district had 23% of its students who Met/Exceeded English Language Arts state standards and that percentage dropped to 22% in the 2016 school year. In both school years, the district underperformed the state average by double digits for the percentage of students who are ready for next level English Language Arts instruction (Illinois Report Card, 2016).
Figure 6: PARCC Mathematics
Figure 6 displays the percentage of students in the district who achieved scores in the 5 PARCC performance level categories for Mathematics. In school year 2015, the district had 10% of its students who Met/Exceeded Mathematics state standards and that percentage increased to 12% in the 2016 school year. Similarly, to English Language Arts, in both school years, the district underperformed the state average by double digits for the percentage of students who are ready for next level Mathematics instruction (Illinois Report Card, 2016).
21
SECTION II: ASSESSING THE 4Cs…
Currently, District L fosters a culture that does not promote student attendance. The district sees the value of student attendance, but has not focused resources on tackling truancy and/or absenteeism for numerous years. The goal of this change plan is to build an environment within District L so that its’ adult culture takes ownership of student attendance.
Change takes time. In order to successfully build an environment of high expectations for student attendance, the district’s administration needs to clearly articulate the timeline for the change plan. Ideally, attendance initiatives should start yielding results within a year or two, but 4 consecutive years of implementation are ideal to transform District L’s culture where all stakeholders take ownership of student attendance.
As a young minority attending a new elementary school almost every school year, in a large urban district, I felt like it did not really matter whether I attended school or not.
Unfortunately, a majority of my teachers did little to nothing to help change my perspective. It was not until my 7th grade teacher took notice of my hidden talents and exploited them by holding me accountable for my attendance. As a student, I quickly learned how much I could learn if I was present and took ownership of my learning. As an educator, I immediately realized that I would not be able to educate empty seats. To improve and enhance my students’
educational opportunities, they needed to know I cared about them being present and that I held them accountable for their attendance and learning.
My past experiences as a student, educator, and administrator reinforce the importance of student attendance. After reviewing District L’s student attendance and academic data, it is clearly evident that student attendance is an area of growth.Therefore, the purpose of this change plan will be to improve District L’s student truancy/absenteeism in order to increase a student's
22
instructional time. Wagner’s change levers stress how improvement is a progression. First, an organization must know why they need to change. Then, others are included while also building their capacity. Next, the change plan is implemented. Here are the results from my assessment of where I believe District L falls in respect to the Wagner’s change levers for leadership understanding and urgency for student attendance:
Change Phase Diagnostic:
Preparing Envisioning Enacting
Data 10/20 = 50% Emerging 8/16 = 50% Emerging 8/20 = 40% Not Present Accountability 11/20 = 55% Emerging 7/20 = 35% Not Present 14/28 = 50% Emerging Relationships 11/16 = 69% Developing 13/20 = 65% Developing 7/16 = 44% Not Present In regards to student attendance data, District L is half way there in each category. In terms of Accountability, more work is needed to build ownership of student attendance by all stakeholders. Lastly, District’s L strongest area is Relationships; the district can build upon their readiness to change Relationships to increase their readiness for change in terms of ownership.
Thinking ahead and to begin moving towards addressing student truancy/absenteeism in District L to increase a student's instructional time, I have identified the following strategies to help solve the problem (See Appendix C for actions connected to each strategy):
Competencies Develop collaborative relationships among adults to build their knowledge base of truancy/absenteeism.
Conditions Reallocate resources to better support student attendance. Culture To have all students believe that they can succeed.
23 Competencies
In 2015 - 2016, it became clear that District L had no identified staff member to monitor and/or track student attendance. Like most districts within Illinois, District L uses PowerSchool, which has attendance tracking reports, but the district did not take advantage of those meaningful reports. The actions that align to this strategy are as follows: Rewrite job description of
Attendance Clerk to identify key areas to monitor student attendance; Provide professional development to staff around the importance of establishing relationships with students; Provide professional development to parents around core problems associated with absenteeism. These actions will begin to help transform the school’s culture so that all stakeholders take ownership of student attendance. Additionally, by building strong positive relationships with students staff in turn improve their academic success, prevent behavior problems, and improve their attitudes, particularly around student attendance.
Conditions
The data in Figure 3 shows the need for District L to reallocate resources to better support their student attendance. Similar to most districts, District L celebrates students with perfect attendance and they send out daily attendance calls. However, the flat line data and high truancy rates show that these interventions are not successful. Therefore, the actions that align to this resource allocation strategy are as follows: Have office staff cross train each other around Attendance Clerk’s professional responsibilities to build ownership of student attendance; Identify funds to establish extended school hours within the district with wrap around services and extensive After-school Performing Arts Programs; Develop and fund a clear set of
consequences for high truant/absenteeism. District L began implementing an After-school Performing Arts Programs in the Fall of 2016. Data is currently being gathered on student
24
participation for the programs and will be analyzed to identify a correlation strengthen. Culture
In order to relate the parts to the whole and to have a shift in thinking, Wagner proposes the following question for leadership: “How does a leader build a shared vision of success that is coherent and is truly owned and inspiring to others?” (pg. 98, 2006). District L’s leadership team needs to answer this question prior to them getting all students to believe that they can succeed. A shared vision of high expectations for student attendance takes time, consistency, and
resources to develop. This paradigm shift in the culture for student attendance needs ownership and innovation driven by District L’s administrative team to spread like wildfire amongst all stakeholders. The actions that align to the strategy for culture are as follows: Survey students to see if after-school performing arts program motivates them to attend school more frequently; Develop a clear timeline with benchmarks to dramatically decrease the number of students we have defined as chronically truant; Provide ongoing professional development around core problems of absenteeism to students, parents, and staff. Through continuous professional
development based on results from needs assessments with clear benchmarks, the overall goal to transform District L’s attendance culture will become closer to reality.
Context
As a culture of ownership is developed around student attendance, then context has to be applied to that shared vision by administration in order to accelerate stakeholders taking
ownership. The next task would be for District L’s leadership team to develop processes to monitor and improve absenteeism. This change plan calls for the following actions to address this strategy: Establish extended school hours within the district with wrap around services and extensive After-school Performing Arts Programs; Provide ongoing professional development
25
around core problems of absenteeism to students and parents; Offer incentives to students and parents who have registered to attend school on the first day. The set of circumstances around the shared vision of improving student attendance, to in turn increase a student's instructional time, needs to drive all that the district does to truly move their culture forward.
26
SECTION III: RESEARCH METHODOLOGY
Research Design Overview
In our complex world, situations are too unique to be approached with a singular
evaluation method for a change plan. Throughout our history, there have been endless trials and errors to innovate and move society forward. In the end, the trials and errors just want to find out the effectiveness, efficiency, and purpose of all that we do. Change Plans and/or program
evaluations are our modern day trials and errors. They allow for collecting and analyzing data in a systematic method to answer many questions. The findings from program evaluations can help shape projects and policies, particularly about a variables effectiveness and efficiency. Program evaluations differ from social commentary and newspaper reporting by utilizing the scientific method, by being held to a higher standard of evidence, and by being scrutinized by the scientific community (Berk & Rossi, 1999). In 1978, Patton published the 1st edition of
Utilization-Focused Evaluation. After decades of application and testing, Utilization-Focused Evaluation is grounded with strong evidence that evaluations when the foundation of use is adequately
prepared. Patton states that utilization-focused evaluations primary focus are to help “primary intended users select the most appropriate content, model, methods, theory, and uses for their particular situation” (2008, p. 14). I believe the structure of utilization-focused evaluation will allow me to tailor my change plan to the real and specific correlation between after-school performing arts programs and student attendance, while aiding me in remaining value-free, performing competently during my data-based inquiries.
District L implemented an after-school performing arts program in the Fall of 2016 and for this change plan, I have been monitoring student attendance data for both school and participation in the after-school program. In May of 2017, I utilized surveys to gather data to
27
capture a sense of the program's impact on student attendance (Patton, 2008). The data gathered from the programs District L implemented in school year 2016 - 2017 will be used in comparison to the historical data I am analyzing for this change plan.
For this change plan, I organized the data (quantitative and/or qualitative) to identify patterns to interpret and report to stakeholders. I put my emphasis on methodological
appropriateness in order to match the data collection and program design to my equation
questions and the needs of my stakeholders (Patton, 2008). During the interpretation, I asked the two questions posed by Patton (2008): “What do the results mean?” and “What’s the significance of the findings?” Next, I determined whether results showed a positive, neutral, or negative correlation between student attendance and after-school performing arts programs. Finally, I added a plan of action to my analysis to recommend what should be done moving forward to improve student attendance.
Based on the advice from Baxter and Jack (2008), I must do more research on the “internal influencing factors” and “external influencing factors” for student attendance to drive my decision making.
In terms of “data for urgency”, the extremely high truancy rates and low attendance of minorities and children of poverty should be alarming. Likewise, research on the positive correlation between student attendance and how it affects achievement are disheartening. For example, in 2013, fourth grade math scores on the National Assessment of Educational Progress were twelve scale points lower for students with three or more absences in the month before they took the assessment (Blad, 2014). Additionally, data on the lack of performing arts programs available for these students should motivate people to take action to increase student attendance
28
with performing arts programs. Likewise, the attendance data for District L in Figure 3 is a cry for interventions to ensure all stakeholders take ownership of student attendance.
Recruitment
For this change plan, I obtained the historical attendance trend data from after-school performing arts programs, in my program evaluation, that were overseen by a college within a large urban school district within the Midwest. I ensured to maintain the confidentiality of the schools and college by using fictitious names in my program evaluation.
In terms of recruitment for the participants in District L surveys for this Change Plan, I must ensure to utilize a manner that avoids feelings of coercion and/or pressure to complete the survey. The surveys (see Appendices D, E, & F) were presented to students, parents, and teachers in May of 2017; I stressed the anonymous nature of the surveys. I hosted a meeting to speak directly to all survey participants about the purpose and scope of my change plan. All students, parents, and teachers were given the choice of taking the survey, while being assured that their responses will be kept confidential. During the meeting, informed consent was obtained (Appendix G) and once obtained, the survey was provided.
Participants
The key participants for my research study were the students within the multiple schools who have worked with the pARTS college partner to provide after-school performing arts programs for at least the past two years. In addition, I included the students from District L that participated in the after-school performing arts programs. I included descriptive statistics for each school around their attendance trends and participation in the after-school performing arts programs. From District L participants, I was able to gather quantitative and qualitative data. Similar to my program evaluation, this change plan will take a Utilization-Focused perspective
29
(Patton, 2008). I have chosen to do a combination of quantitative and qualitative methodologies on District L’s new after-school performing arts program to enhance the credibility of my findings from my program evaluation (Yin, 2009). I distributed surveys to 127 students, 110 parents, and 57 teachers who participated in District L’s 2016 - 2017 after-school performing arts program.
I selected these schools because of the after-school performing arts programs they have implemented over the past few years. To ensure valid generalization and appropriate test of statistical significance, I must employ a sufficient random sample size from the historical data and the data collected from District L’s program (Patton, 2008). With the qualitative data I gather from my surveys for the after-school performing arts program, I will employ “purposeful samples” of an information-rich case (Patton, 2002). For example, much can be learned from the implementation of an after-school program around how to improve student attendance initiatives within the context of performing arts (Patton, 2008). I believe that in any change plan, power, politics, and ethics are factors that must be considered. Reflecting on my research design, I don’t see how power might be an issue. I integrated findings from my program evaluation and
analyzing data from District L’s after-school program. Therefore, I do not foresee power as a concern. However, I do foresee the areas of politics and ethics possibly being an issue. To guard against unwanted political dilemmas, I took into consideration the following: students, parents, and staff members who have values and perceptions around attendance and their involvement in the proposed change plan which may influence the process. Also, since programs are involved, the allocation of resources to these programs may negatively affect other programs. However, to be financially responsible, schools must regularly analyze how they allocate their funds and how effective their return on investment is for such funds to move their teaching and learning
30
forward. This negative impact can be mitigated by schools taking a proactive approach to be financially responsible for all funds.
In terms of ethical dilemmas, as a researcher, it is my professional responsibility to act morally, honest, and unbiased throughout the entire study. I must regularly adhere to the ethical principles outlined in the Belmont Report (1978) to continuously work at eliminating /
minimizing any ethical dilemmas. The basic ethical principles outlined in the Belmont Report state that as a researcher using any human subjects, I must “respect for persons” by protecting all subjects’ autonomy, be truthful, and allow for informed consent. I must minimize the risks to the research subjects, called “beneficence”; I must ensure “justice” by employing non-exploitative procedures that are administered fairly for all subjects (United, 1978).
Data Gathering Technique(s)
Sagor’s (2005) Chapter 2 opens with the power of purpose statements. A purpose
statement helps researchers stay on track, while remaining close to their evaluation goals. When collecting data, I must constantly reflect on my purpose statement so I do not harm the data. I must also remember the power of words. The word “change” automatically causes undue
discomfort and embarrassment. It is human nature to think, “Did I do something wrong?” and to worry about a light being shined on their shortcomings when they hear the word “evaluation” and of “change” (Sagor, 2005).
To ensure ethical data collection methods while decreasing discomfort/embarrassment to participants, I familiarized myself with the District L’s policy on data collection for students, staff, and families. Then, I obtained consent after clearly identifying the intent of the research, the data collection strategies, the research benefits and risks, and who will have access to the information. I secured all data (personal information and experiences) gathered to maintain
31
confidentiality of all participants, while employing research techniques that are valid and
reliable. Most importantly, I did my best to maintain a positive rapport with participants by being honest about the pros and cons of the research and how it will be reported.
Quantitative Technique(s)
My main data is coming from longitudinal archived data provided to me by pARTS College; this is the data I analyzed for my program evaluation. This data encompasses the number of students in each after-school performing arts program from 8 schools, the types of programs at each school, and student attendance in each program per school for each year. Additionally, I assessed each school's student attendance data from the public domain. I
conducted descriptive statistic methods on this data to see if a correlation exists, and if so, what kind of relationship between student attendance and participation in an after-school performing arts program.
For this change plan, I have gathered similar quantitative data from District L’s after-school performing arts program implemented in after-school year 2016-17. District L’s data consist of the number of students in each after-school performing arts program, the types of programs, student attendance in each program, and the students’ average daily attendance trend data. Similarly, to my program evaluation, I will conduct descriptive statistic methods on this data to see if a correlation exists, and if so, what kind of relationship between student attendance and participation in an after-school performing arts program. Then, I will compare the finds to see if they provide support for the proposed change plan strategies and actions.
Data Analysis Technique(s)
The advantage of using quantitative methods is that I can analyze larger groups of data to have evidence to support my change plan goal and strategies. The quantitative methods used in
32
my program evaluation helped me answer the question about the variance and correlation of student attendance and after-school performing arts programs. I can also dive deeper into
addressing issues of progress, opinions, classification, and/or levels of satisfaction and outcomes with the survey data (James, 2008). For my program evaluation, my primary research question was “To what extent do after-school performing arts programs have a relationship with student attendance?” By utilizing a quantitative paradigm approach to analyze the historical data, I was able to measure the statistical relationships between student attendance and after-school
performing arts programs. Likewise, with Districts L’s quantitative data, I will employ a quantitative paradigm approach to analyze the data.
Within District L, I supervised the implementation of an after-school performing arts program for school year 2016-2017 and I monitored student attendance and participation within the after-school program. Therefore, I will be able to incorporate qualitative methods into this change plan, such as a reflection survey where students, parents, and teachers can reflect on what kind of impact a student's participation in the after-school performing arts program has had on their student attendance. This method allows for insight by the students, parents, and teachers; the degree of the insight is tied to their responses. I must remember, for all willing participants, the ethics of informed consent applies here because I am using their responses as research data (Sagor, 2005). With this method, I must also clearly outline whether and to what extent the reflection data will be used, how results will be reported, and whether any additional permission will be obtained prior to using direct quotes (James, 2008). I plan on conducting a triangulation of both data sets to confirm the validity, credibility, and reliability of the correlation, if one exists.
33 Surveys
Every student who participated in District L’s after-school performing arts programs in the 2016 - 2017 school year was sent a survey to complete (See Appendix D). Additionally, an invitation was extended to all of the parents (See Appendix E) and teachers (See Appendix F) of those students to participate in an online survey. An estimated 120 students participated in the after-school programs and these students were served by an estimated 30 teachers; this includes support teachers, special education teachers, content area teachers and/or grade-level
teachers. All survey questions were formatted using a Likert scale of Strongly Disagree,
Disagree, Agree, Strongly Agree, and Undecided. In addition, each survey had a final question in which participants could provide some specific examples that would help explain their ratings.
My surveys pose minimal potential risks to the students, parents, and teacher participants. The surveys are completely anonymous. The survey data was entered into an Excel file to
conduct descriptive analysis methods and to maintain anonymity among participants. As a result, it will not be possible to identify a participant with their responses.
The last question on each survey is an open-ended response question to allow students, parents, and teachers to provide some specific examples that will help me better understand their ratings.
Risks and Benefits
For my program evaluation, I only utilized quantitative methods. Even though the quantitative methods were able to answer my program evaluation research question, by
identifying, “How is student attendance progressing?”, the biggest disadvantage of this method is that it leaves out the power of the insight gained for the human reflection. Therefore, for this change plan, I will take advantage of a mixed methodology to integrate the power of the human
34
experience data with the quantified evidence, which in turn, will allow me to build a broader understanding of the relationship between student attendance and after-school performing arts programs. Plus, a mixed methodology approach will allow me to understand the context
(changing demographics; economically stable or unstable), understand the process (background that leads to low attendance), and causal relationships (breakdown the complex relationship between student attendance and performing arts programs), while providing data to understand the opinions/attitudes of groups in the school community regarding attendance.
The potential benefits of identifying a positive correlation between after-school performing arts programs and absenteeism are significant. Each year, schools implement interventions to combat student absenteeism. My program evaluation provides research-based evidence for school districts to increase funding for the performing arts to tackle student absenteeism, while this change plan will hopefully provide District L with evidence to either support their school culture paradigm shift so that all stakeholders take ownership of student attendance.
35
SECTION IV: RELEVANT LITERATURE
I will examine research on after-school programs and student attendance, with a focus on performing arts programs adopted by schools. This synthesis of related literature on after-school programs and absenteeism will serve to lay the foundation for this change plan.
Unfortunately, there are limitations with how deep this literature review can go due to the limited amount of available research. The limitations of this literature review are based on the lack of research available on after-school performing arts programs as they relate to student attendance. However, there are endless amounts that focuses on how absenteeism and other variables affect students academically.
After-School Programs
Many after-school programs are funded privately. However, in 2002, the No Child Left Behind Act reauthorized the 21st Century Community Learning Centers, which continues to be the only federal funding source dedicated exclusively to after-school programs. Prior to 2002, this grant centered around the community learning center model. After 2002, the grant shifted its focus to an after-school program model that provides services only to students attending high-poverty, low-performing schools (United States Department of Education, 2016).
In 1918, The Commission on the Reorganization of Secondary Education stressed schools need to expose students to skills they will need as an adult and how this exposure provides students with a more intimate knowledge of skills. They also stated that in order to grow students social and emotional learning skills the curriculum needed to be differentiated (Commission on the Reorganization of Secondary Education, 1918).
36
In 1994, Posner and Vandell studied the correlation between academic performance and attending an after-school program. They found that attending after-school programs was
associated with better social adjustment and academic achievement. They also recognized that despite a student's varied experience in an after-school settings involvement in after-school programs meant more time in academic activities and enrichment lessons and less time playing outside unsupervised than other children (Posner, 1994).
In 2010 Durlak, Weissberg, and Pachan conducted a meta-analysis of after-school
programs focused on the enhancement of the personal and social skills of youth. They concluded that participants of after-school programs demonstrated “significant increases in their
self-perceptions and bonding to school, positive social behaviors, school grades and levels of academic achievement, and significant reductions in problem behaviors” (Durlak, 2010). Furthermore, they found that children and adolescents benefit in multiple ways if after-school programs contained components to foster the social and personal skills (Durlak, 2010).
Many districts across the United States are adopting out-of-school-time programs such as after-school programs or summer school in order to supplement the education of academically low students. Unfortunately, there has been a mixed picture of out-of-school-time program effectiveness based on the research.
Lauver’s 2002 study explored whether a limited funded urban after-school program, in a public school, could make significant gains academically and behaviorally for students. Lauver concluded that the after-school program had a significantly positive effect on students doing homework and on their educational aspirations (Lauver 2002).
37
In 2006, Laure, Akiba, Wilkerson, and more examined research studies on 35 out-of-school-programs to see their impact on at-risk students in reading and/or mathematics. This meta-analysis indicated “small but statistically significant positive effects of [out-of-school-programs] on both reading and mathematics student achievement” (Laure, 2006). Additionally, they found that there was no difference in the out-of-school-programs effectiveness regardless of whether the it occurred after-school or during the summer (Laure, 2006, p. 275).
It is difficult to argue with the fact that increased student time in front of a certified educator/instructor would not be beneficial. Over the past 30 years, there has been an increase in the number of studies that suggest after-school program participation has a strong correlation to increase grades and standardized test scores, especially for low-income students (Hamilton & Klein, 1998; Ohio Hunger Task Force, 1999; Schinke, Cole, & Poulin, 1998).
Over the past 15 years, I have worked in underfunded urban public schools with large populations of low-income and minority students that are in need of more after-school programs to provide additional social emotional learning, academic interventions, and performing arts opportunities. Many urban communities are taking on the challenge of increasing their after-school programs. For example, the Chicago Park District has increased funding for after-after-school performing arts programs (Culture, Arts, Gymnastics, etc.) by 321.5% within six years (Chicago Park District). Many other studies have found a correlation between after-school program participation and the following factors: higher expectations of school achievement, improved attitudes toward school, higher attendance rates, and better work habits, especially for students classified as low-income (Brooks, Mojica, & Land, 1995; Posner & Vandell, 1994; Schinke, Cole, & Poulin, 1998; Witt, 1997).
38 Absenteeism
In December of 2015, the Every Student Succeeds Act (ESSA) became the United States K-12 public education policy and replaced the No Child Left Behind Act. ESSA requires states to report chronic absenteeism. This is a move in the right direction to shine a bright light on student absenteeism, so much that all states now use a measure of chronic absenteeism in the accountability plans. For example, the state of Illinois will begin report subgroups of chronic absenteeism and chronic truancy in October 2018.
The era of accountability has transcended from state assessments to student attendance. Researchers and policymakers will do their part over the next couple of years by increasing the number of studies analyzing the connection between student attendance and academic
achievement. However, more importantly, researchers and policymakers must help define which attendance intervention strategies are most effective for particular schools and students. Future researchers need to study the past to help define what they study moving forward around student absenteeism.
For example, Adelman’s research yielded results showing that high quality teachers are the strongest school-related determinant of student academic achievement, students who are chronically absent/truant reduces the effectiveness of any teacher’s best abilities to provide learning opportunities (2006).
The Economic Policy Institute issued a report in 2018 stating that 19.2% of 8th-graders within 137 schools were chronically absent in 2015; this percentage is a “relatively stable” pattern across grade levels between 2003 and 2015 (Riddell, 2018). Additionally, the report identified that absenteeism rates are significantly impacted by poverty, disability status,
39
23.2% of free- lunch-eligible students, 17.9% of reduced-price-lunch-eligible students, 24.1% of Hispanic English learners, 24% of Native American students and 23% of black students missed three or more days of school in the month (Riddell, 2018). It would be great if future studies dive deeper into the growing populations with these characteristics (poverty, disability status, race/ethnicity, and language status) to combat absenteeism. The Economic Policy Institute’s report is nothing new. Dryfoo’s 28 year old study showed that students absent from school is detrimental to their achievement (Dryfoo, 1990).
Low academic performance, delinquency, and many other high-risk behaviors are related to chronic absenteeism. Over the years, researchers have identified successful interventions to decrease absenteeism, but many of their findings lack specifics on operationalizing chronic absenteeism. Hobbs, Kotlaja, and Wylie cite findings that indicate K - 12 students with the highest rates of absenteeism benefit significantly from interventions, whereas students with fewer absences do not significantly increase their attendance rate (2018).
Absenteeism is an epidemic in the United States. Annually, an estimated 5 to 7.5 million students in the United States are chronically absent (Brown, 2015). Districts are failing to
effectively handle the issue of chronic absenteeism. As a result of the passing of the ESSA law, researchers feel their call to support the publication of chronic absenteeism rates has been heard and that it will force district administration to begin focusing on a problem that has been ignored for too long (Brown, 2015).
Romero’s 2007 study of primary youth found a relationship between reading/math growth and attendance. The study found that negative student outcomes in First Grade were associated with students with high absences in Kindergarten. In addition, the study found that
40
absenteeism in Kindergarten leads to negative outcomes in subsequent years in reading, math, and general knowledge (Romero, 2007).
While districts and schools can take steps to alleviate some of the obstacles that hinder students from attending school, they cannot address all of the impediments alone. The support of the parents, community, and other local agencies is needed. A holistic approach to raise public awareness while also pressuring lawmakers and policymakers to set forth legislation to address absenteeism and the barriers that keep students out of school is greatly needed. States do not have to start from scratch and reinvent the wheel. There are states with the highest attendance rates, like California, that can serve as models to study and adapt.
41
SECTION V: DATA ANALYSIS & INTERPRETATION
Teacher Survey Data
A total of 57 teachers were given the survey. Unfortunately, only 11 of the 57, or 19.3% responded. The survey had 6 questions where teachers responded on a Likert scale on a students’ improvement in math, reading, and attendance.
Figure 7:
In Figure 7, 72.7% of teachers agreed that students who participated in the after-school programs collaborated more frequently with their peers and 27.3% strongly agreed.
42
In Figure 8, a total of 81.8% of teachers felt that a student’s daily attendance improved when they participated in the after-school programs. Only 9.1% were neutral and 9.1% disagreed that a student’s daily attendance improved with participation in the after-school program.
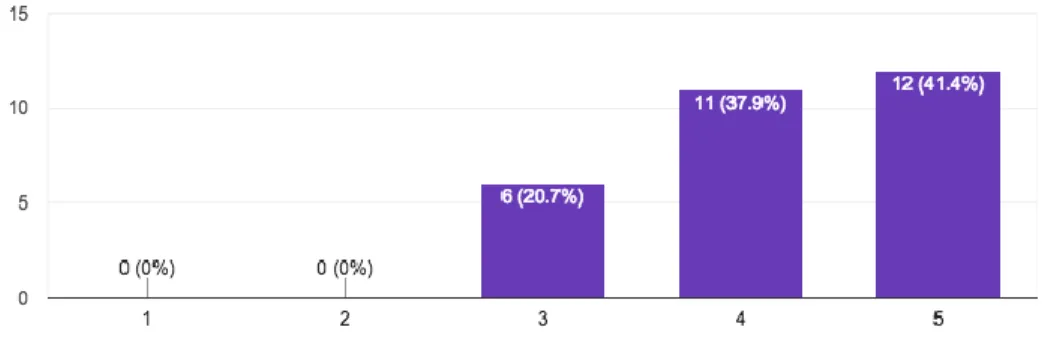
Figure 9:
When looking at academic performance, 81.8% teachers surveyed agreed or strongly agreed that a student’s performance in reading increased as they participated in the after-school programs. The remaining 18.2% were neutral on the impact of participation in the after-school program and its correlation to a student’s reading performance.
Figure 10:
Similar to reading, a high number, 63.7%, of teachers either agreed or strongly agreed that a student’s performance in math increased as they participated in the after-school programs.
43
Figure 11:
Figure 11 has two graphs that focus on students’ social emotional learning. In the first graph, 81.8% of teachers surveyed noticed improved social skills for students that participated in the after-school programs. Additionally, 81.8% of the teachers surveyed felt that students in the after-school program exhibited more persistence in the classroom.
Overall, the teachers surveyed felt that there was a positive correlation between students’ academic / behavioral performance and participation in the after-school program.
Parent Survey Data
A total of 110 parents were given the survey and 29 of the 110, or 26.4% responded. The survey had 12 questions where parents responded on a Likert scale on their child's improvement in academics, behavior, and attendance.
44
Figure 12:
The graph in Figure 12 breaks down the distribution of student grade levels for the parents that completed the survey. A majority of parents that completed the survey had students in 5th - 7th grade.
Figure 13:
Figure 13 shows how 28 out of the 29 parents that completed the survey felt that as a result of participating in the after-school program they child is more interested in attending school.
45
Figure 14:
Not only did the parents feel like their children are more interested in attending school, but Figure 14 shows that parents also noticed that their children appear more engaged and/or interested in learning as a result of participation in the after-school programs.
46
Figure 15 has two graphs that focus on a student’s academic performance. A majority of parents surveyed felt that there was improvement in their child's academic performance as a result of their child participation in the after-school programs. However, 10.4% more parents reported higher improvements in math performance over reading performance.
47
The three graphs in Figure 16 focus on a student’s social and emotional growth as a result of participating in the after-school programs at District L. Parents feel that as a result of their child’s participation in the after-school programs their children are learning how to deal with conflict, how to collaborate with their peers, and are improving their social skills.
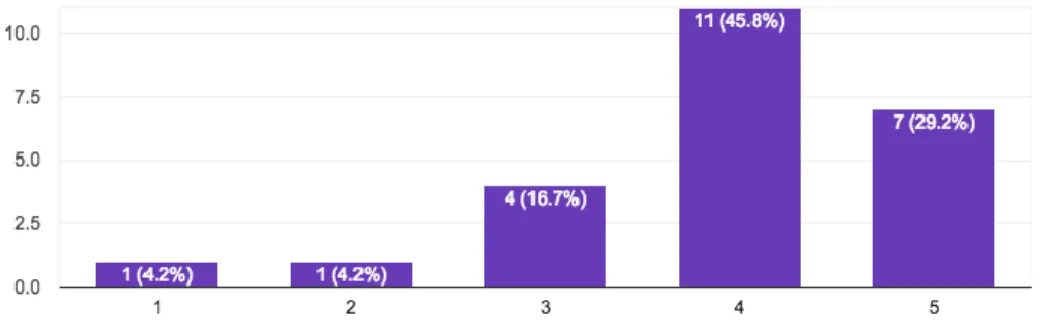
Student Survey Data
A total of 127 students were given the survey and 24 of the 127, or 18.9% responded. The survey had 11 questions where students responded on a Likert scale on their perspective of their improvements in academics, behavior, and attendance.
Figure 17:
The majority of parents that completed the survey reported having children in grades 5th - 7th grade. However, Figure 17 shows that this is the opposite for students who completed the survey, since the majority of them are in grades 1st, 2nd and 4th.
48
Figure 18:
Figure 18 has three graphs that highlight students’ interest in attendance and school. The first graph shows that 18 out of the 24 students that completed the survey reported that they either agree or strongly agree that as a result of their participation in the after-school program they are more interested in attending school. Similarly, the second graph shows a positive
49
correlation between a student’s interest in school and participation in the after-school performing arts program. Lastly, the third graph shows that 75% of students surveyed agree or strongly agree that they are more engaged / interested in learning as a result of participating in the after-school program.
Figure 19:
In terms of academic performance, the graphs in Figure 19 show that 79.1% and 60.8% of students agree or strongly agree that their participation in the after-school performing arts program has helped them understand reading and math, respectively.
50
Figure 20:
District L is located in a low-income community with a high crime rate and many
latchkey children. A majority of the students surveyed, 83.3%, identified that by participating the after-school performing arts program they have a safe place to spend their time after-school.
51
In terms of student social and emotional growth, the graphs in Figure 21 show that 79.2% of students feel that participation in the after-school programs help them enjoy school more. More importantly, the graphs also highlight that as a result of participation in the after-school program 70.9% are prouder about their school work.
Attendance Data
Figure 22: Attendance Data for the First Semester
In the 2016 - 2017 school year, District L implemented an after-school performing arts program. The scatter plot in Figure 22 compares the data for the after-school program attendance to the student first semester attendance. A total of 93 students participated in the program during the first semester. For the first semester, the average student attendance for the after-school program was 88.17% and for these same students, their school attendance was 93.98%. In order to analzye how close the attendance data fits to a regression line, the trend line is displayed in Figure 22 and the coefficient of determination for is 𝑅2 =0.021.
In order to visualize how close the data fits to a regression line the data points from Figure 22 were used to calculate the coefficient of determination 𝑅2. The closer 𝑅2 is to 1.0, the
52
better the fit of the regression line resulting in the line passing through all of the points. In the first semester the statistical measure of 𝑅2 is low. This low 𝑅2 measure is problematic in predicting precisely the relationship between Student School Attendance and Student After-School Program Attendance.
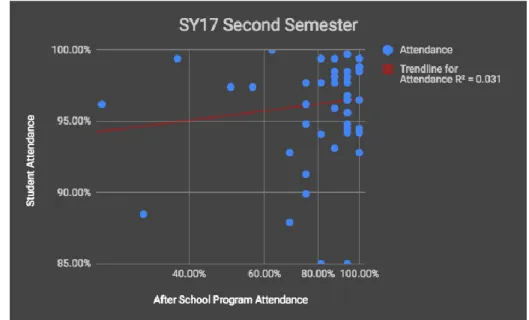
Figure 23: Attendance Data for Second Semester
Figure 23 shows the scatter plot data for the second semester. A total of 50 students participated in the program during the second semester. For the second semester, the average student attendance for the after-school program was 84.06% and for these same students, their school attendance was 95.94%. The trend line is displayed in Figure 23 and the coefficient of determination for is 𝑅2 =0.031.
The scatter plot for the second semester shows how not many points fit on the regression line, resulting in the statistical measures of 𝑅2 to be low and means that the model does not explain the variability of the response data around its mean. This low 𝑅2 measures are problematic in predicting precisely the relationship between Student School Attendance and Student After-School Program Attendance.
53
The correlations could be low for multiple reasons. I do not want to speculate, but one must take into consideration the weather during the winter months and how that relations to student attendance in the after-school programs. Perhaps more students stayed for after-school programs so they would not have to walk home; or students might have not stayed after school because it gets colder in the evening. Regardless of the reason for the low correlations, the coefficient of determination findings makes it difficult to determine the relationship between Student School Attendance and Student After-School Program Attendance.