Measurements Based Performance Evaluation of 3G Wireless
Networks Supporting m-health Services
Katarzyna Wac
∗1,2, Richard Bults
1, Aart van Halteren
1,
Dimitri Konstantas
1,2, Victor Nicola
11
University of Twente, EWI/INF, P.O.Box 217, 7500 AE Enschede, The Netherlands
2University of Geneva, CUI, 24 rue General Dufour, 1211 Geneva 4, Switzerland
ABSTRACT
The emergence of 3G networks gives rise to new mobile services in many different areas of our daily life. Examples of demanding mobile services are mobile-healthcare (i.e. m-health) services allowing the continuous monitoring of a patient’s vital signs. However, a prerequisite for the successful deployment of m-health services are appropriate performance characteristics of transport services offered by an underlying wireless network (e.g. 3G). In this direction, the EU MobiHealth1 project targeted the evaluation of 3G networks and their ability to support demanding m-health services. The project developed and trialled a patient monitoring system, evaluating at the same time the network’s performance. This paper presents measurements based performance evaluation methodology developed and applied to assess network performance from an end-user perspective. In addition, it presents the (selected) speed-related evaluation (best-case scenario) results collected during the project. Our measurements show the dynamicity in the performance of 3G networks and phenomena negatively influencing this performance.
Based on the evaluation results, we conclude that in-spite of certain shortcomings of existing 3G networks, they are suitable to support a significant set of m-health services. A set of recommendations provide a road map for both operators and service developers for design and deployment of m-health services.
Keywords: m-health service, performance evaluation methodology, 3G, measurements
1. INTRODUCTION
Monitoring patients with chronic diseases outside a hospital offered by health institutions is on a growing scale. However, nowadays’ remote monitoring systems address mainly elderly patients and a limited number of chronic diseases. If a mobile (i.e. with an active life) patient requires measurements of various vital signs (e.g. blood pressure, ECG, heart rate) at regular intervals, he has either to visit the hospital or take the measurements at home using different devices. As a result, in most cases either the measurements are not taken at the required intervals or the patient is obliged to visit the hospital and stay there for some time to undergo a series of regular measurements. This then results in high costs for the hospital and healthcare insurers and loss of work hours and morale of the patient. As mentioned in [1], remote monitoring of patients may be a solution to reduce health care costs and increase productivity and the quality of life not only of working patients. The number of current attempts for realization of patients’ remote monitoring systems given in literature (e.g. mobile telemedicine systems indicated in [2] or [3]), indicates an urgent and increasing need for “e-health2” services delivery.
The utilization of various modern information and (tele) communications technologies (ICT) will play a significant role in the realisation of any remote health care service. A significant proportion of the health demands of future health care models will be satisfied through (private or public) broadband wireless networks, e.g. 2.5/3G networks. The application of these networks and the related technology (e.g. mobile terminals: Personal Digital
∗ [email protected]; phone +41 22 379 76 63; fax +41 22 379 77 80; www.unige.ch 1
The MobiHealth project was supported by the Commission of the European Union in the 5th research Framework under the project number IST-2001-36006.
2 E-health is an emerging field in the intersection of medical informatics, public health and business, referring to health services and information delivered or enhanced through the Internet and related technologies [5].
Assistants, smartphones) and services can be categorized as mobile based health services, or in short m-health3 services. One of the major characteristics of m-health systems is the geographical distribution of system components, which are interconnected by a (data oriented) transport system (i.e. telecommunication system). These transport system are typically hybrid systems that consist of wireless and wired communication technologies. As a result, the characteristics of the underlying transport system should be taken into account during the design, implementation and operation of m-health services [4]. Particularly the interactivity of the delivered m-m-health services strongly depends on the delay characteristics of the underlying transport system. This requirement makes it necessary to have a clear understanding of the behaviour and performance characteristics of the overall hybrid transport system.
Performance evaluation can contribute to the understanding of the behaviour of complex transport systems. Gradually along the development of technology, there are attempts for performance evaluation of transport systems like e.g. high throughput wired networks [6], then wireless LANs [7] and 2/2.5G [8, 9] networks. However, the performance characteristics of the emerging wireless transport systems, like 3G networks, are relatively unknown. At this moment, only simulation-based results are available [10, 11] to asses the performance of the 3G networks.
MobiHealth is a European project that has explored the capabilities of 2.5G and 3G broadband wireless networks to support emerging m-health services. For patients and healthcare professionals the project developed a generic m-health service platform for ambulatory monitoring (i.e. collecting) of a patient’s vital signs over 2.5G and 3G networks. In addition, a wearable Body Area Network (BAN) was developed, consisting of sensors and actuators worn by a patient. Details of MobiHealth system and services can be found in [12]. The system was evaluated in nine trials each with different healthcare cases and patient groups in four different European countries (the Netherlands, Spain, Sweden, and Germany) [13].
The system works as follows. Sensor system (i.e. patient’s vital signs) data is transmitted over a short-range wireless link (intra-BAN communication) to the Mobile Base Unit (MBU4), which processes the data and relays it to a mobile operator network (i.e. 3G network). The operator forwards the data to the Internet, and the data finally arrives at the MobiHealth Back-End system (BEsys5) in an enterprise network (e.g. healthcare service provider LAN). Health-care professionals access the BEsys from a workstation within the enterprise network, to control the behaviour of the BAN and in addition, access the measured data (i.e. patient’s vital sign) real-time or offline.
The MobiHealth’s underlying transport system is based on the TCP transport protocol and therefore provides a reliable service [14]. This transport system is a hybrid system that offers a transport service provided by different transport sub-systems. Each sub-system is responsible for a section of the ‘end-to-end’ communication path used between
MobiHealth system components. Figure 1 presents the decomposition of the communication path.
Since MobiHealth services were to be used for patients with a critical health condition, the performance of the underlying transport service is of vital importance to the success of developed services. It was therefore necessary to study the behaviour of the underlying transport service, and more specifically the behaviour of the 3G network regarding the speed6, accuracy7, and dependability8 of the data delivery, in a quantitative way in order to determine the impact and limitations posed on the overall performance of the MobiHealth services. It needs to be emphasized, that there were no MobiHealth service transport delay requirements defined in the project; the aim of the project was a feasibility study.
Towards this target, we developed a performance evaluation methodology, based on a methodological approach for performance evaluation of computer systems by R. Jain [15], and collected data measuring the performance of the transport system used in the project. Although for the m-health monitoring service the uplink communication direction is of vital importance, we nevertheless conducted the performance evaluation for both uplink and downlink directions.
3
M-health services i.e. mobile based health (care) services, are e-health services based on the deployment of wireless mobile telecommunication technologies
4
central controlling unit of a BAN 5
security, control, management, and data storage sub-system 6
Time interval used to transport data from a source to a destination. 7 The degree of correctness with which a service is performed. 8
The degree of certainty with which the service can be used regardless of speed or accuracy. Fig.1. MobiHealth system ‘end-to-end’ communication path
We must note that due to several reasons (e.g. commercial advantages, technical restriction, etc), the operators are very reluctant to disclose any information related to their 3G network performance or allow access to internal parts of their (core) network. Therefore, our experience on the 3G based transport system’s behaviour presented in this paper is from an end-user’s point of view, not from a 3G network provider’s point of view.
In addition, the performance of a transport system depends on many 3G network-related issues, like the network availability, user mobility, and the number of concurrent users. It must be emphasised that our measurements and data collection for the transport system’s performance evaluation were done during the 3G networks transition phase from pre-commercial to commercial service (between July 2003 and April 2004). In addition, most of the time we were the only (single) user in the coverage area of the 3G network (i.e. the network was unloaded, there was no other traffic) and our measurements were done at a fixed geographical position. Our results are therefore considered as benchmark (best-case scenario) performance characteristics for 3G based transport systems.
In this paper, we present the performance evaluation results for the delay performance characteristics of a 3G based transport system. We observed high delays variations (i.e. jitter), which have major negative influence on the performance of the transport system as a whole. Since we had no measurement probes inside the 3G based transport system, we can only speculate on possible jitter sources. We attribute the observed delay variations to the inherent mechanisms of the different communication subsystems, ranging from the physical layer mechanisms (like delays due to 3G bearer (re)assignments) all the way up to high-level protocol mechanisms (e.g. protocol recovery from lower level communication errors). The performance evaluation of the bottleneck and scalability characteristics of the 3G based transport system was presented in the Master Thesis report [17]. Our performance evaluation results can be used for the design and optimisation of m-health services.
2. EXPERIMENTAL
METHODS
In this section, we present details on our methodological approach for measurements-based performance evaluation of one alternative MobiHealth transport system. In subsequent sections, we provide the methodology overview and details on methodology execution (i.e. preparation and execution of experiments).
2.1 Overview of the Methodology
To derive the performance characteristics of a 3G based transport system, we performed precise and methodologically based measurements on the system. The systematic approach for performance evaluation of computer systems by R. Jain [15, 16], has been selected as a methodology basis and was further developed towards our requirements for the performance evaluation activity. The systematic approach answered the question regarding the performance characteristics of 3G wireless networks as a transport sub-system for m-health services and defined the steps needed to get these characteristics. The methodology consists of three phases: preparation, execution and evaluation. The preparation phase defines the goals of the measurements activities. In addition, a conceptual model of a selected transport system and services are derived, and the performance characteristics of interest and a mechanism to apply
measurement data (i.e. workload) in a controlled way, are described. The execution phase consists of the identification
of distinct measurement experiments, their design (i.e. measurement instrumentation), and execution (that is collection of data during the experiments). In the evaluation phase, we evaluate the performance characteristics of the transport system based on the measurement results. In the rest of this section, we present the (selected) outcomes of the preparation phase followed by a presentation of the methodology’s execution phase details. Section 3 of this paper describes the evaluation results.
2.2 Methodology Preparation Phase
We made the following assumptions for the evaluation of the MobiHealth system with an ‘end-to-end’ communication path as shown in Figure 1. First, the MBU is the only entity in the BAN able to communicate with the BEsys; i.e. the MBU is the only IP entity. Therefore, the intra-BAN communication is considered outside of the scope of the performance measurements. Hence, the MBU is directly connected to the mobile operator’s network. Because only the moment that the BAN data arrives and is stored at the BEsys is of vital importance9, the communication between the end-user host and the BEsys is considered outside the scope of the performance measurements. Figure 2 presents the simplified view on the MobiHealth transport system.
9
As a further decomposition of the MobiHealth transport system, we provide a layered architectural view on the overall MobiHealth system (Figure 3). Each layer corresponds to the service offered at the border of this layer, i.e., at the service interaction point (Service Access Point, SAP). The MBU and the BEsys are situated at the MobiHealth application layer, and both entities provide m-health service end-user functionality. The MobiHealth transport system as a whole can be represented as a black box, which provides a particular transport service (to the application layer). From an application layer (i.e. transport service user) level, it is of no interest how the transport system delivers its service, as long as it delivers the service at a certain (sometimes pre defined) quality level. Hence, the transport system is a “black box” providing a specified service set (at the SAPs).
In our performance evaluation activity, we are interested in the performance characteristics of the transport service provided at the MobiHealth transport system’s boundary. The transport service can be further decomposed. Figure 4 presents the decomposition of the transport service according to the Internet Protocol Stack.
The MobiHealth transport system delivers a reliable transport service to the MobiHealth MBU and BEsys (at the TCP_SAP). We assume the TCP protocol realises this service. TCP uses the (lower level) network layer datagram service provided by the IP protocol (at the IP_SAP). IP uses the (lower level) data link and physical level services to transport the datagrams. These lower level services are the Point-to-Point (i.e. PPP) data link service (at the PPP_SAP) plus 3G service (at the DL_SAP) at the MBU side, or just the Ethernet service at the BEsys side. Summarizing, the transport service is a composition of several lower-level services and the characteristics of these services are of importance to the overall
performance characteristics of the MH transport system.
For the MobiHealth system’s user, the speed-related, and particularly the delay and jitter (i.e. delay variation), transport system’s performance characteristics are of major importance. We define the delay in the MobiHealth system as the round-trip time interval for the transport of the m-health service data between (the TCP_SAP at) the MBU and (the TCP_SAP at) the BEsys. Specifically, the delay was defined as the time interval needed to transport the (patient’s vital sign) data from the MBU to the BEsys, followed by the transport of the (system response) data from the BEsys to the MBU. This data exchange sequence constitutes the basic element upon which the complete m-health service is provided, and we call it the m-health Service Element (SE). We call the round-trip time, i.e., (total) time interval for the SE execution the SE delay. The SE delay is a statistical random variable and it consists of the uplink and the downlink (transport) delay components.
The m-health service data are exchanged between the MBU and the BEsys in messages10. We refer to a message transported from the MBU and received by the BEsys as the Mssgsend, and to a message transported
from the BEsys and received by the MBU as the Mssgrecv. An Mssgsend and an Mssgrecv can have different sizes and
content. One execution of the exchange of (temporally ordered) Mssgsend and Mssgrecv between the MBU and BEsys is
then execution of the SE. Figure 5 presents a time sequence diagram for the transport of messages exchanged between the MBU and the BEsys, which also shows the uplink and downlink delays.
10
A message is an application level Service Data Unit (SDU) Fig.2. MobiHealth transport system
Fig.3. MobiHealth layered architecture
The SE delay, as indicated in Figure 5, is the time elapsed between the request and the confirmation events in the system, minus the processing time (between
indication and response
events) at the BEsys. The SE’s uplink delay component (i.e. uplink
delay) is the time elapsed
between request and
indication events, while for
the SE’s downlink delay component (i.e. downlink
delay) the time elapsed
between the response and the confirmation events. We define SE delay and its components as follows:
SE delay = uplink delay + downlink delay
SE delay = (Trecv, BESys – Tsend, MBU) + (Trecv, MBU – Tsend, BESys)
uplink delay
uplink delay = (Trecv, BESys – Tsend, MBU)
downlink delay
downlink delay = (Trecv, MBU – Tsend, BESys)
The jitter is defined as the variation of delay between the successive (identical) messages under transport [14].
2.3 Methodology Execution Phase
Having defined the system boundaries and performance characteristics of interest for the MobiHealth system we proceed in taking extensive measurements and data collection. The set of measurements we took consisted of 11 different test cases, which were executed between July 2003 and 1 April 2004 in the Netherlands at the University of Twente. In total more than 3 GB of data has been transported during measurements under different conditions and hours. Figure 6 presents the setup of the measurements concerning the transport delay defined in Figure 5.
The measurements were performed at a stationary position, i.e., there was no mobility involved, neither soft/hard intra- or inter-system handovers.
To be as realistic as possible, the data used for the measurements were pre-recorded data (i.e. vital sign data) produced by the MobiHealth system. Java based application were emulating the MBU and BEsys at both ends, comprising what we call the evaluation
system. The evaluation system was
deployed on both computer systems taking part in the measurements activity (Figure 6). The evaluation system was non-invasive, i.e. outside the transport system (network) under the study. The evaluation system generates the required data and measures the relevant transport system characteristics. For this, it
Fig.5. Time sequence diagram for a transport of SE
includes a workload generator and measurement module. The workload generator interacts at the boundary of the network by generating stimuli and reacting to stimuli from the network. The measurement module measures the transport system’s reaction to the stimuli. It does not interact with the transport system and has minimal (negligible) influence on the behaviour of the transport system. The evaluation systems on both end-node computer systems have their actions synchronized in time (by means of out-of-band clock synchronization via NTP).
As mentioned above, the data generated by the workload generator are reproduced/recreated from real MobiHealth data. As a result, the workload generated to the transport system consists of different message sizes for uplink and downlink. We generated 20 different message sizes for uplink and 20 different message sizes for downlink. The uplink message sizes (Mssgsend) range from 174 Bytes to 8122 Bytes, while the downlink message sizes (Mssgrecv) range from 174 Bytes
to 48208 Bytes. Therefore, in total we examined 400 (SE’s) different combinations of Mssgsend and Mssgrecv sizes (we
combined each Mssgsend size with each Mssgrecv size). We believe that this (relatively high) number of possible
combinations of message sizes, with the (adequate) message sizes granularity11, was suitable to disclose the behaviour of the transport system.
For each individual SE, we repeated the delay measurement 500 times (i.e. 500 observations), which constitutes one
sample, needed to get statistically sound data. For each SE execution, the sample’s raw data has been recorded
separately. Statistical calculations were performed on a sample to obtain the average (i.e. mean) uplink, downlink and SE delays, their jitter and the accuracy of the average delay for a 95% confidence interval.
3. EVALUATION
RESULTS
From the collected raw data for the 400 executed SEs, we discarded 9% of them, mainly due to data ambiguousness caused by clock synchronization problems. Therefore, in our further discussion on measurement results we consider only the successfully executed SEs, which were 360 out of the 400. Nevertheless, this fact has no effect on the overall results and derived conclusions.
The first characteristics we measured and verified were the uplink and downlink transport system capacities. Specifically we deduced the available service nominal capacity to be 64 kbps for the uplink and 384 kbps for the downlink. What we also verified was that the transport service capacity correlates to the volume and rate of transported data. The transport system reacts to changes in the volume and rate of the data being transported by assigning a bearer (i.e. the data-carrying channel of a 3G network). The capacity of the assigned 3G bearer determines the capacity of the transport system observed by the transport service user.
The 3G-based transport subsystem supports two bearers for uplink and four for downlink direction (Figure 7). The uplink link has bearer capacities for 0-16 kbps (i.e. common bearer) and 16-64 kbps (i.e. dedicated bearer 1). The downlink link has bearer capacities for 0-16 kbps (i.e. common bearer), 16-64 kbps, (dedicated bearer 1), 64-128 kbps (i.e. dedicated bearer 2) and 128-384 kbps (i.e. dedicated bearer 3).
Based on a quantitative analysis of SEs’ raw data results, we deduce that the volume and rate of data transported by the transport system’s uplink and downlink cause the changing behaviour (i.e. bearer assignment) of the 3G transport subsystem, and therefore the change in the observed overall transport service capacity. For any standalone request for data transport, the transport system by default assigns the common bearer in both directions, and then it may assign dedicated bearer(s) ‘matching’ the data traffic offered to transport (i.e. the transport system has a “learning” behaviour). The bearer assignment behaviour is always gradual, i.e., the transport system always assigns a contiguous bearer (to the current one) in both the uplink and/or downlink. We refer to the moment of the (new) bearer assignment as the
bearer assignment event.
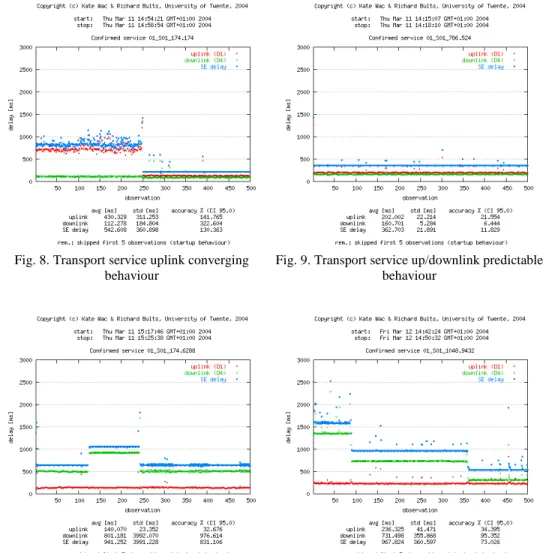
The bearer assignment behaviour is considered to be normal if it converges to an adequate dedicated bearer and this bearer is going to be used for the remaining part of a data transfer (Figures 8, 9 and 11 provide example raw data, where this behaviour was observed). This behaviour is validated for 99.8% of the executed performance measurements. Only the behaviour exhibited in Figure 10 shows an alternating behaviour of the downlink between two contiguous bearers. The detailed explanation of Figures 8, 9, 10 and 11 we give in the following paragraphs.
11
Messages were uniformly distributed in a given message range Fig.7. Transport system uplink
Figures 8 to 11 represent examples of (raw) sample data of different SEs. On the horizontal axis there is an observation number (1 to 500) within the sample, while on the vertical axis, the corresponding value of delay in milliseconds can be read. For each observation, the delay measurement points are given separately: for uplink (red colour), downlink (green colour) and total SE delay (blue colour). The delay measurement points represent 500 consecutive observations, in the order as they have been measured. As a result, there are three “lines” distinguishable in the delay plot area, meaning
trends of the equivalent delay. In each figure, informational data is given above the delays’ plot area. “Start” and “stop”
labels indicate the plotted sample’s measurements timeframe. Below the plot area, there is delays’ statistical data for this sample, i.e. average uplink, downlink and SE delays, their jitter and the accuracy of the average delays for a 95% confidence interval.
Figure 8 (SE: Mssgsend
size 174 Bytes and Mssgrecv size 174 Bytes)
presents the converging behaviour of the transport system. For the first few observations, the transport system assigns the common bearer for uplink and downlink. After these few observations, the downlink has been assigned with the dedicated bearer 1, which remains for the rest of the data under transport. For the uplink, for observations 1 to about 250, the transport system has assigned the common bearer. Only after (about) 250 observations, the transport system assigns the dedicated bearer 1 for the uplink. Important finding based on Figure 8 is, that the usage of a common bearer has a negative impact on the delay variation.
From Figure 9 (SE: Mssgsend 786 Bytes and
Mssgrecv 524 Bytes) we
deducted that both links have been assigned with the dedicated bearer 1 after the few first observations. Both links display predictable delay behaviour and as a result have a low variance. This is desired converging behaviour of the transport system.
From Figure 10 (SE: Mssgsend 174 Bytes and Mssgrecv 6288 Bytes) we observe the downlink’s alternating behaviour.
Initially both links have been assigned with the dedicated bearers (dedicated bearer 1 in uplink, bearer 2 in downlink) after the few first observations. The downlink has been assigned with the dedicated bearer 2 (observations 10 to about 120), then reassigned with the dedicated bearer 1 (observations about 120 to about 240) and then reassigned back to the dedicated bearer 2 (observations about 240 to 500). While the downlink has been assigned with the dedicated bearer for all observations, it behaves accurately.
Fig. 8. Transport service uplink converging behaviour
Fig. 9. Transport service up/downlink predictable behaviour
Fig. 10. Transport service downlink alternating behaviour
Fig. 11. Transport service downlink converging behaviour
Figure 11 (SE: Mssgsend 1048 Bytes and Mssgrecv 9432 Bytes) presents the transport system behaviour with the
downlink converging behaviour. Both links have been assigned with the dedicated bearer 1 after the few first observations. The bearer’s assignment starts from the dedicated bearer 1 (observations 10 to about 80), and through dedicated bearer 2 (observations about 80 to about 360) and it converges to the dedicated bearer 3 (observations about 360 to 500).
The above Figures present the individual raw data results for selected SEs. During our measurements, we have successfully collected raw data for 360 SEs in the format as in Figures 8 to 11. Now we present the measurement results in conclusive graphs, i.e. graphs holding the combined results of all SEs’ measurements. In order to do that, for each SE we took the statistical values for the uplink, downlink and SE delay and used it to compose the conclusive graphs. It is important to note that the conclusive graphs are provided with the average delay figures regardless the variance of this delay. Moreover, in order to facilitate the analysis of the transport the system’s delay behaviour, we present the system’s uplink and downlink behaviour in separate conclusive graphs.
3.1 Transport system’s uplink average delay and jitter behaviour
In this section, we present the transport system’s uplink average delay (and jitter) behaviour as a function of Mssgsend
size i.e. message size transported in the uplink direction. In order to derive this function, we used uplink statistical data of selected SEs. Our selection criterion for SEs was that it consists of an arbitrary Mssgsend size and Mssgrecv size fixed
at 524 Bytes. Because in our measurement activity we have 20 different Mssgsend sizes, this way we selected 20 SEs for
further analysis. We motivate our choice by the fact that for the support of m-health services we need to understand mainly the uplink behaviour of the transport system. Hence, for the selected group of SEs we give an uplink delay function in relation to Mssgsend size. The delay function has as an argument 20 Mssgsend sizes. The result of the delay
analysis is as follows.
Figure 12 presents the transport system’s uplink average delay and its variation behaviour as a function of Mssgsend size. The horizontal axis gives the values of the Mssgsend size (in Bytes). The vertical axis presents the
corresponding average uplink delay in milliseconds. The vertical (red) line indicates the jitter for each delay measurement point and should be interpreted as a range of the possible delay values for this point.
Copyright (c) Kate Wac & Richard Bults, University of Twente, 2004
Transport system uplink average delay vs uplink message size
8122 7860 7336 6812 6288 5764 5240 4716 4192 3668 3144 2620 2096 1572 1310 1048 786 524 349 174 0 200 400 600 800 1000 1200 1400 1600 1800 174 786 1572 3144 4716 6288 7860
uplink message (MSSGsend) size [Bytes]
tr anspor t syste m upli nk ave rage d elay [m s]
We deduct from the figure that the uplink average delay increases linearly with the Mssgsend size. This is expected
behaviour. From Figure 12, we can also see that the transport system’s uplink jitter is significant for all Mssgsend sizes.
This is unwanted behaviour.
3.2 Transport system’s downlink average delay behaviour
In this section, we present the transport system’s downlink average delay behaviour as a function of Mssgrecv size i.e.
the message size transported in the downlink direction. Contrary to the uplink analysis, in order to derive this function we used downlink statistical data of all SEs. However, to facilitate the data presentation we decided to group SEs of the same message size characteristics. Our selection criterion for a group of SEs was that the group comprises SEs characterized by: fixed Mssgsend size and arbitrary Mssgrecv size. Because in our measurement activity we have 20
different Mssgsend sizes, we had 20 groups of SEs for further analysis. Moreover, because in our measurement activity
we have 20 different Mssgrecv sizes, each SEs’ group numbers exactly 20 SEs. For each group of SE we can present its
statistical data separately and give a separate downlink delay function in relation to Mssgrecv size. Therefore, having 20
different groups of SEs, we distinguished 20 different delay functions with arguments of 20 different Mssgrecv sizes.
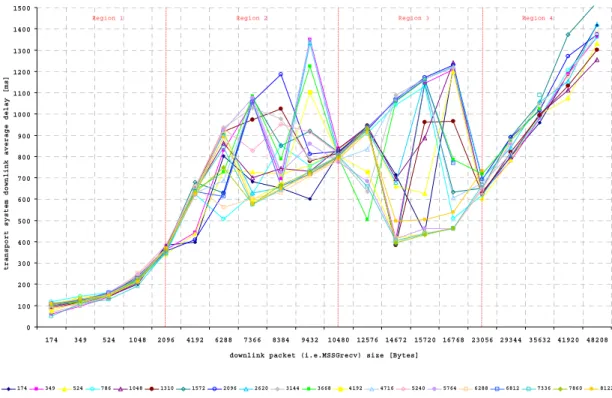
Figure 1312 presents the transport system’s downlink average delay behaviour as a function of Mssgrecv size. There are
20 functions distinguished; each of them has a fixed Mssgsend size. The horizontal axis gives the values of the Mssgrecv
size (in Bytes). The vertical axis presents the corresponding average downlink delay in milliseconds.
Copyright (c) Katarzyna Wac & Richard Bults, University of Twente, 2004
Transport system downlink average delay vs downlink message size
0 100 200 300 400 500 600 700 800 900 1000 1100 1200 1300 1400 1500 174 349 524 1048 2096 4192 6288 7366 8384 9432 10480 12576 14672 15720 16768 23056 29344 35632 41920 48208
downlink packet (i.e.MSSGrecv) size [Bytes]
t r a nsp or t sys te m dow nl in k a v e r a ge de la y [ m s ]
Region 1 Region 2 Region 3 Region 4
uplink message (i.e.MSSGsend) size [Bytes]
174 349 524 786 1048 1310 1572 2096 2620 3144 3668 4192 4716 5240 5764 6288 6812 7336 7860 8122
Fig.13. Transport system downlink average delay behaviour versus Mssgrecv size
The downlink average delay is a complicated function of the Mssgrecv size. Particularly, Mssgrecv size does influence the
transport system’s downlink delay behaviour but the delay does not increase linearly with the Mssgrecv size as observed
in the uplink behaviour.
There are 20 functions presented in the figure, and based on them we put forward the hypothesis on the transport system behaviour. According to us, the transport system’s downlink delay behaviour may be characterized by four different
delay behaviour regions depending on Mssgrecv size.
The first region (Region 1) relates to small messages up to and including Mssgrecv size of 2096 Bytes. In this region, the
delay increases linearly with the message size and the delay value is very much predictable for all functions.
The second region (Region 2) relates to Mssgrecv sizes bigger than 2096 Bytes and smaller than 10480 Bytes. In this
region, the delay is highly variable. For a Mssgrecv equal 10480 Bytes, the delay value is very much predictable for all
functions.
The third region (Region 3) relates to Mssgrecv size bigger than 10480 Bytes and smaller than 23056 Bytes. In this
region, the delay is highly variable. For a Mssgrecv equal 23056 Bytes, the delay value is predictable for all functions.
The fourth region (Region 4) relates to Mssgrecv sizes bigger than 23056 Bytes. In this region, the delay increases
monotonically with a message size and the delay value is predictable for all functions.
Further analyses of the findings on the variability of the transport system’s downlink delay behaviour, we involve the transport system’s bearer (re)assignment behaviour presented at the beginning of this section. Generally, the experienced delay behaviour of the transport system always depends on the transport system capacity. In our case, the transport system capacity directly depends on the capacity of the assigned bearer. Therefore, we put forward the hypothesis of an association of the identified delay behaviour regions with the bearer(s) assigned within the transport system. We believe that the volume of data offered for transportation has a direct influence on the bearer assignment mechanism, and therefore our hypothesis is as follows. In Region 1, transported messages are relatively small, and the transport system assigns the common or dedicated bearer 1 for their transport. In Region 2, transported messages are bigger and the transport system assigns dedicated bearer 1 or dedicated bearer 2 for their transport. In Region 3, transported messages are relatively large and the transport system assigns dedicated bearer 2 or dedicated bearer 3 for their transport. Finally, In Region 4 transported messages are large and the transport system assigns dedicated bearer 3 for their transport. This hypothesis is in line with our previous conclusion that volume of data transported causes the bearer (re)assignment. Because there are four bearers, we believe that for each of them there is a threshold of size of data transported, which causes the assignment of a next (contiguous) bearer. The threshold is associated with the (maximum) boundary capacity of the current bearer. This threshold is then the (minimum) boundary capacity of the next (contiguous) bearer. We observed that for common bearer this threshold is very low, whenever we have started the data transmission, dedicated bearer 1 was assigned after a few observations.
Regarding the volume threshold, we think that when the volume of data transported is “far” from this threshold, then the transport system is forced to use the actual bearer; the probability of assignment of another (contiguous) bearer is low. We believe that this situation takes place for three distinctive Mssgrecv sizes: 2096 Bytes, 10480 Bytes, and 23056
Bytes, where transport system is forced to assign correspondingly: the dedicated bearer 1, 2 or 3. This situation also takes place for messages from region 1, where small data volume is forced to be transported under the assignment of dedicated bearer 1 and for messages from region 4, where large data volume is forced to be transported under the assignment of dedicated bearer 3 with the highest capacity.
When the volume of data transported by transport system is “close” to the bearer’s threshold, then the transport system may assign a contiguous bearer, we observe high randomness of bearer assignment for data transport. This situation takes place for messages from Region 2 and Region 3.
4.
CONCLUSIONS AND RECOMMENDATIONS
In April 2004, we completed the performance measurements and MobiHealth trials. These measurements have been used to evaluate the suitability of 3G networks as a transport system for m-health services. Our results were based on the observed behaviour of the 3G network and its effects on the operation of the m-health services. In general, we can say that the existing 3G network has significantly better performance characteristics than 2.5G [9], and it can be used for health services that improve existing health care services. Nevertheless, if we want to provide more advanced m-health services, the existing 3G network might not be adequate.
The first result concerns the 3G bandwidth and transmission delays. For the test cases of the MobiHealth project the bandwidth offered by 3G networks is, in principle, sufficient. However, in the future more sophisticated and demanding m-health services will be developed, requiring higher bandwidth. For example, in the tele-trauma scenario [13] the monitoring service will require the transmission of the patient’s vital sign data together with audio/video signals in real-time from the scene of the accident. Nevertheless, the support of bandwidth demanding m-health services
will be hindered by the restrictions imposed from the 3G’s asymmetric capacity; i.e. the downlink link capacity is (much) higher than the uplink, while the reverse would be beneficial to m-health services.
Current 3G networks implement support for the standard producer-consumer paradigm (i.e. a mobile service user is the information consumer receiving more data from the network than this user generates). However, in the m-health services’ domain the consumer-producer paradigm is inverted: the mobile end-user (i.e. patient) is a producer of information, transmitting high quantities of data to the hospital. Mobile network operators and manufactures of 3G terminals should consider this fact in order to allow for a better support of forthcoming m-health services. However according to the Corollary of Moore's Law: As you increase the capacity of any system to accommodate user demand,
user demand will increase to consume system capacity [18].
Another problem we observed concerns the mechanism/policy of bearer (re)assignment within the 3G network. Generally, during data transport, the 3G bearer assignment is done gradually i.e. the network is “learning” about the traffic to be transported. Data transport always starts from the common bearer (which supports low bandwidth) and then gradually, based on the traffic volume, the network assigns a higher bearer (which supports higher bandwidth). The exact conditions, under which the bearer assignment takes place, are not clear to us. We observed bearer changes when the offered load was increasing, but we also observed random bearer changes when the offered load was stable. This bearer change mechanism/policy might cause a problem for the m-health service when the service offers bursty traffic to the transport system. Consequently, the service has to buffer data before the network assigns the adequate bearer (i.e. a bearer that handles the traffic offered) since the available bandwidth is the one offered by the lower bearer. At the end of the burst, the 3G network will assign a lower bearer (after a certain delay) and in the next burst cycle, the situation of the bearer assignment will be repeated. A bearer assignment mechanism may also cause a problem in case the m-health service offers a fixed amount (i.e. at a constant rate) traffic to the transport system. In this case, adequate service buffering capacity is of importance due to the (initial) gradual assignment of the dedicated bearer(s). We recommend m-health service developers to consider these two scenarios when designing a new service. In addition, we would like to explore the possibility to negotiate QoS profiles that ‘reserve’ a particular dedicated bearer for transportation of m-health related data.
We give two additional important notes regarding the finding on the 3G network asymmetry and bearer assignment behaviour. Firstly, the m-health service(s) designers should know the policy of a bearer assignment mechanism. When operators disclose this information, the service can then be deployed such that it benefits from the performance characteristics of the underlying transport system. The second note is that during service operation, there should be a programmable interface (API) available between the service and the transport system. Ideally, the service should have access to communication control information on the actual capacity of the underlying transport system, e.g. the 3G bearer currently assigned. Operators and manufactures should consider this fact in order to allow for a better support of forthcoming m-health services.
We need to emphasize, that the exact delay requirements for the monitoring service were not defined in frame of the MobiHealth system. For our trials the experienced delay of a few tenths or hundreds of milliseconds (or even a few seconds) was a tremendous improvement compared to the delay of many hours (i.e. patient coming the next day to the hospital) which is the case for many health services today. However, the delay variation problems of the 3G network needs to be resolved in order to support highly interactive m-health services. The high jitter, as observed during our measurements, has a major effect in the degradation of the overall transport system’s delay performance characteristics. We attribute the observed delay variations to the inherent mechanisms of the different communication subsystems (within the transport system), operational at different protocol stack layers. Because we did not have measurement probes on these layers, we can only speculate on possible jitter sources. We believe, that one of the mechanisms that results in jitter, is a variable propagation delays over the wireless transmission medium. Within the higher-layers, the jitter may be caused by the TCP retransmission mechanism together with (unnecessary) reduction of the sending rate due to the non-congestion-based message loss. Another possible reason can be delays due to the unpredictable overall-system events like resource problems or intermediary system (processing) delays, which seem to have no pattern in their behaviour. Summarizing, the jitter has a significant negative influence on the performance characteristics of the system. Due to the high jitter, the average end-to-end delay is much higher than is expected. We strongly recommend further study on sources of delay variation within the transport system.
For the m-health service, fulfilment of the reliability requirement is critical to its success. However, some services do not require 100% system reliability. Moreover, there is a trade-off between the system’s reliability and the performance. The study on this trade-off in the context of m-health service is essential. In our measurements and MobiHealth trials, we ensure the reliable service delivery by means of a TCP-based underlying transport service. As we have explained above, the reliable service delivery may result in system performance degradation i.e. significant delay
variation. The observed delays may include TCP retransmission(s) time(s) due to the data loss in transport sub-systems. Therefore, the possibility to use an unreliable UDP-based underlying transport service can be of interest to explore. A study of accuracy- (i.e. data corruption probability) and dependability-related (i.e. transport system availability, data loss probability) performance characteristics of the (UDP-based) transport system is an essential subject for future research. With these study results, it will be possible to investigate further m-health services and determine which reliability requirements can be met by means of a UDP-based transport system.
A very important issue noticed during the measurements and the MobiHealth trials execution is the limited power capacity of the existing 3G terminals. The battery of the used 3G terminals lasted for only about 2 hours, which most probably will not be acceptable for future m-health service provisioning, where e.g. 24 hours battery life is expected.
Finally, our measurements are benchmark performance characteristics results. In [17] we present in-depth analysis on the system bottleneck and scalability performance characteristics. As future work we recommend repetition of the measurements on a loaded (i.e. background traffic) 3G based transport system. These measurement results can be used for a further study on the influence of other users on the performance characteristics experienced by a single user.
REFERENCES
[1] The Possibilities of Wireless Healthcare, White Paper, Air2Web, Inc., http://www.air2web.com/
[2] S.Tachkara, X.H.Wang, R.S.H.Istepanian, Y.H.Song, Mobile E-Health; The Unwired Evolution of Telemedicine.
Telemedicine and E-Health Journal, Vol.9, No.3, 2003, pp.247-257
[3] A.van Halteren, D.Konstantas, R.Bults. K.Wac, N.Dokovsky, G.Koprinkov, V.Jones and I.Widya, MobiHealth:
Ambulant Patient Monitoring Over Next Generation Public Wireless Networks, e-health: Current Status and Future Trends, G.Demiris (Ed.), IOS Press, Amsterdam, (to appear in 2004).
[4] N.Dokovsky, A.van Halteren, I.Widya, BANip: enabling remote healthcare monitoring with Body Area Networks, FIDJI, International Workshop on scientiFic engIneering of Distributed Java applIcations, Luxembourg, November 27-28, 2003
[5] G.Eysenbach, What is E-health? Journal of Medical Internet Research 2001
[6] L.Cortell, Active end-to-end high throughput application & network performance measurements,
DARPA/NSF/DoE NGI PI meeting, Washington USA 2002
[7] 802.11 Wireless LAN performance, White Paper, Atheros, Inc., http://www.atheros.com
[8] T.Wierlemann, T-Mobil: Performance of TCP/IP and its Application Protocols over Narrowband Bearers with
high Latency, 1998
[9] J.Korhonen, O.Aalto, A.Gurtov, H.Laamanen, Measured Performance of GSM HSCSD and GPRS, In Proceedings of the IEEE Conference on Communications, Helsinki, Finland, 2001
[10] N.Zhang, Simulation-based investigation of TCP file transfers over UMTS, University College London, UK 2003 [11] J.Antoniou, A System Level Simulator for the Performance Evaluation of Enhanced UMTS networks, 2002
[12] D.Konstantas, A.van Halteren, R.Bults, K.Wac, I.Widya, N.Dokovsky, G.Koprinkov, V.Jones, R.Herzog, Mobile
Patient Monitoring: the MobiHealth System, proceedings of International Congress on Medical and Care Compunetics, NCC, The Hague, June 2-4, 2004
[13] A.Alonso, Detailed description of trial scenarios, MobiHealth Deliverable 1.3, February 2003
[14] J.Kurose, K.Ross, Computer Networking, A Top-Down Approach Featuring the Internet, Addison Wesley, 2001 [15] R.Jain, The Art of Computer Systems Performance Analysis: Techniques for Experimental Design, Measurement,
Simulation, and Modelling, John Wiley & Sons, New York, 1991
[16] F.Hoeksema, J.van der Veen, B.van Beijnum, Measurements, A Methodical Approach to Performance
Measurement, Experiments: Measure and Measurement Specification, University of Twente, CTIT, July 1997
[17] K.E.Wac, R.G.A.Bults, Performance evaluation of a Transport System supporting the MobiHealth BANip:
Methodology and Assessment, University of Twente, the Netherlands (to appear in October 2004)
[18] P.Ferguson, G.Huston, Quality of Service: delivering QoS on the Internet and in corporate networks, John Wiley & Sons, 1998.