WebProphet: Automating Performance Prediction for Web Services
Zhichun Li§Ming Zhang† Zhaosheng Zhu‡Yan Chen§Albert Greenberg†Yi-Min Wang† §Northwestern University†Microsoft Research‡Data Domain Inc.
Abstract
Today, large-scale web services run on complex sys-tems, spanning multiple data centers and content dis-tribution networks, with performance depending on di-verse factors in end systems, networks, and infrastructure servers. Web service providers have many options for improving service performance, varying greatly in feasi-bility, cost and benefit, but have few tools to predict the impact of these options.
A key challenge is to precisely capture web object de-pendencies, as these are essential for predicting perfor-mance in an accurate and scalable manner. In this pa-per, we introduceWebProphet, a system that automates performance prediction for web services. WebProphet
employs a novel technique based on timing perturba-tion to extract web object dependencies, and then uses these dependencies to predict the performance impact of changes to the handling of the objects. We have built, deployed, and evaluated the accuracy and effi-ciency of WebProphet. Applying WebProphet to the Search and Maps services of Google and Yahoo, we find
WebProphetpredicts the median and95thpercentiles of
the page load time distribution with an error rate smaller than 16% in most cases. Using Yahoo Maps as an exam-ple, we find thatWebProphetreduces the problem of per-formance optimization to a small number of web objects whose optimization would reduce the page load time by nearly 40%.
1 Introduction
Software vendors and service providers are increasingly delivering services to users through the Internet. Large-scale web services, such as maps, search, and social net-working, have proliferated, attracting hundreds of mil-lions of users worldwide. On the client side, these services heavily leverage Asynchronous Javascript and XML (AJAX) to provide a seamless and consistent user experience across devices and form factors. Behind the
scenes, significant amounts of data and computation are provided by servers in the cloud.
Many web services are extremely complex, since they aim to match or even exceed the rich user experience of-fered by traditional desktop application. For instance, the “driving directions” webpage of Yahoo Maps comprises about 110 embedded objects and 670KB of Javascript code. These objects are retrieved from many differ-ent servers, sometimes even from multiple data cdiffer-enters (DCs) and content distribution networks (CDNs). These dispersed objects meet only at a client machine, where they are assembled by a browser to form a complete web-page. Since service providers lack object-level measure-ments obtained from clients, it is hard for them to as-sess and study user-perceived performance. Moreover, there exist a plethora of dependencies between different objects. Many objects cannot be downloaded until some other objects are available. For instance, an image down-load may have to await a Javascript downdown-load because the former is requested by the latter. These multiple fac-tors make it highly challenging to understand and predict the performance of web services.
The performance of web services has direct impact on user satisfaction. Poor page load times (PLT) result in low service usage, which in turn may undermine ser-vice income. For instance, a study by Amazon reported roughly 1% sales loss as the cost of a 100 ms extra de-lay. Another study by Google found a 500 ms extra delay in display search results may reduce revenues by up to 20% [16]. Even worse, users may simply abandon a ser-vice provider for another offering, as switching barriers are often low.
Ideally, service providers would like to predict the effects of potential optimizations before actual deploy-ment. Yet it is seldom clear what benefits various pos-sible options for improvement might bring a service provider – whether optimization to the object structure of the page, or optimizations in the manner in which content is placed and delivered over the Internet.
User-perceived PLT is affected by the loading time of web ob-jects and their dependencies. The loading time of each individual object is further affected by a variety ofdelay factors, including DNS lookup time, network round trip time (RTT), server response time, and client execution time.
One compelling way to predict performance is to first measure the PLT through experiments on the service it-self (e.g., A/B tests [16] by varying a given property of the service), and then to extrapolate estimates using some form of regression. However, such experiments can be difficult to setup and expensive to sustain. It is not un-common for such experiments to run for days or even weeks, limiting the capacity for adding additional ex-periments. Furthermore, it is extremely challenging to sweep the space of all possible scenarios since the num-ber of scenarios grows exponentially with the numnum-ber of objects and delay factors. Without detailed knowledge of object dependencies, it is difficult to decide how many distinct scenarios need to be measured to attain accurate predictions.
Existing approaches for performance prediction gen-erally fall into two broad categories: provider basedvs.
end-system based. In the first category, WISE [23] pre-dicts performance based on server logs collected at the service provider’s data centers. As a result, this approach has limited visibility into some client-side factors that are crucial for user-perceived PLT, such as page render-ing time, object dependencies, and multiple data sources (crossing data centers and content providers). In the sec-ond category, Link Gradients [10] proposes to predict end-to-end response times of untested system configura-tions, assuming the effects of change in individual fac-tors are completely independent of each other. While this assumption may hold in small-scale enterprise ap-plications, it is inapplicable to complex web services in which inter-component dependencies are prevalent.
To overcome these challenges and shortcomings, this paper presentsWebProphet, a tool that predicts the im-pact of various optimizations on user-perceived PLT of web services. First,WebProphetaims to be applicable to a diverse set of web services. Second,WebProphetaims to automatically produce accurate predictions. Given the number of web services and the churns in their im-plementations, a tool that involves manual effort can be overly burdensome and error prone.
WebProphetconsists of a measurement engine, a de-pendency extractor, and a performance predictor. The dependency extractor employs a novel algorithm to in-fer dependencies between web objects by perturbing the download times of individual objects. Our key observa-tion is the delay of an individual object will be propa-gated to all of its dependent objects. While others have noticed that timing perturbation can convey information
(in particular, [20] uses such techniques to transmit data covertly), we are the first to apply it to systematically discovering web object dependencies. Given the depen-dency graph of a webpage, the performance predictor im-plements a simple and yet accurate method to simulate the page load process of a web browser. It can make fast and accurate PLT prediction under any combination of changes in objects and delay factors. It can also predict the statistical properties (e.g., median or 95th-percentile) of a PLT distribution under a hypothetical scenario.
We appliedWebProphetto four widely-used web ser-vices: Maps and Search of Google and Yahoo. We verified that our system successfully extracts the depen-dency graphs for all these services, even though some of the complex webpages comprise over 100 objects. We used WebProphetto predict PLT on real, popular web browsers using controlled experiments and the Planet-Lab testbed. Our evaluation shows that the predictions of
WebProphetare highly accurate, with error rates mostly under 16%. This is quite promising given the inher-ent noise (e.g., different loss conditions) in these ex-periments. We then applyWebProphetto finding cost-effective optimization strategies for real applications. For instance, Yahoo Maps contains 110 objects and has a median PLT of 3.987 seconds measured from Northwest-ern University. By simply optimizing the client execu-tion time of 14 objects and moving 5 static objects from Yahoo data centers to the Akamai CDN, the median PLT of Yahoo Maps can be cut by nearly 40%.
We continue to discuss the problem formulation and present an overview ofWebProphetin§2. We describe
dependency extraction in§3 and performance prediction
in§4. The implementation is covered in§5. In§6 and§7,
we show the results of dependency extraction and per-formance prediction respectively. We demonstrate how
WebProphethelps to optimize the PLT of Yahoo Maps in§8. We evaluate the systems performance in§9.
Fi-nally, we review the related work in§10 and conclude in §11.
2 Problem Context
Many web services are delivered to users in form of web-pages that can be rendered by a browser. Sophisticated webpages may contain many static and dynamic objects arranged hierarchically. To load a page, a browser typ-ically first downloads a main HTML object that defines the structure of the page. Next, it may download a Cas-cading Style Sheets (CSS) object that describes the pre-sentation of the page. The main HTML object may em-bed many Javascript objects that are executed locally to interact with a user. As the page is being rendered, an HTML or a Javascript object may request additional
ob-Load Time of Object i 1C l ien t D el ay N et D el ay 5S er v er D el ay TC P 3-W A Y D ata Tr an s fer 3R TT 4P ack et Los s 2D N S del ay P ag e Load Time Object D ep en den cy
Figure 1: The page load time decomposition. jects, such as images and Javascripts. This process con-tinues until all relevant objects are loaded.
We define page load time (PLT) as the time between when the user triggers the page starting to load and when all the objects in the page are loaded. Sometimes, users do not care about all the objects in a page. For instance, a page may contain invisible images, advertisements, or user tracking services. Moreover, a user action may only trigger a few new objects to be loaded after the initial page load. Accordingly, we could also define PLT as the time to load a subset of objects in a page that are relevant to user-perceived performance. Note that there is a subtle difference between when objects are loaded and when objects are perceived by the user. While the latter is more directly related to user satisfaction, it is also harder to define and measure precisely. Therefore, we choose to focus on the former in this paper.
As illustrated in Figure 1, we may decompose the loading time of each object into client delay, network de-lay, and server delay. The client delay is due to various browser activities such as page rendering and Javascript execution. The network delay can be further decomposed into DNS lookup time, TCP three-way handshake time, and data transfer time. TCP handshake time and data transfer time are influenced by network path conditions such as RTT and packet loss. The server delay is pro-duced by various server processing tasks such as retriev-ing static content or generatretriev-ing dynamic content.
Service providers have many different options to im-prove the PLT of a webpage. For instance, they may upgrade the back-end infrastructure to reduce server re-sponse time for dynamic objects. They may use a CDN service to reduce the network delay for static objects. They may also optimize the implementation code to re-duce the client execution time for computation-intensive objects. While optimizing for an individual object or de-lay factor (or for a combination of multiple objects or delay factors) will bring some benefits, they may also in-cur significant costs in development and management. It is economically infeasible for a service provider to op-timize for every object/delay factor, and is often unclear where to find the biggest bang for the buck. Our goal is
Controller Measurement Engine Web A g en t P r o x yWeb P D G s P a c k et T r a c es N ew S c en a r i o I n p u t T r a c e A n a l y z er O bj ec t T i m i n g I n f o r m a t i o n P a g e s i m u l a t o r R es u l t s
D ep end enc y Ex trac to r
P erf o rmanc e P red ic to r W eb A g ent
Figure 2: System architecture.
to build an automated system that can accurately predict the PLT improvement under any combination of changes in object and delay factor. A service provider can easily use our system to narrow down the optimization strate-gies that could bring the most benefits.
For a web service,WebProphetpredicts PLT based on a performance model extracted from client-side obser-vations. Compared to server-side techniques [23], our approach can take into account a few important factors that are visible only at the client. First, a modern web-page usually contains many objects which have depen-dencies between each other. As a result, the PLT cannot be estimated simply based on the page size and TCP-level characteristics such as RTT, packet loss, and con-gestion window size. In fact, the dependencies will deter-mine when an object can be loaded and which objects can be loaded in parallel. Second, many webpages comprise sophisticated HTML and Javascript objects to provide a rich user experience. Nonetheless, HTML rendering and Javascript execution may introduce significant client de-lay. Third, the objects in a page may come from multiple data centers and CDN nodes. For example, Yahoo Maps uses both the Akamai CDN and Yahoo data centers to deliver page content. Though the client side is the ideal place where we can measure the user-perceived PLT ac-counting for all these effects end-to-end, existing client browsers lack the measurement hooks needed.
As shown in Figure 2, WebProphethas three major components. Given a webpage, thedependency extrac-torinfers the dependencies between objects by perturb-ing the download times of individual objects. The mea-surement enginecontrols multiple automatedweb agents
which can drive a full-featured web browser (Firefox 3) to load the page. The measurement engine also collects one packet trace for each page load. Using the extracted dependency graph and the packet trace in a baseline sce-nario, theperformance predictorestimates the PLT in a new scenario by simulating the page load process.
The PLT of a webpage will not be a constant due to the variations of network latency, server response time, and load on the client.WebProphetcan predict the statistical properties (e.g., median or 95th-percentile) of the PLT
distribution under a new scenario. For this purpose, we first collect a reasonably large number of page load traces in a baseline scenario using a web agent. Then, for each of these traces, we run performance prediction to obtain the PLT in the new scenario, and therefore produce the PLT distribution in a new scenario.
Currently, we do not explicitly consider the effect of packet loss in our model. In other words, we assume the same loss condition in the baseline and new scenarios. Differences in loss conditions can change the number of round trips involved in loading an object, which in turn lead to prediction errors (§4.1). The impact of packet
loss on PLT can be highly variable, and highly depen-dent on factors such as network transients, TCP conges-tion states, and specific TCP loss recovery mechanisms. In spite of this limitation, as shown in§7, WebProphet
attains high prediction accuracy in both controlled and real-world experiments under normal loss conditions.
3 Dependency Extraction
In this section, we first present an overview of depen-dency relationships between web objects and describe the types of dependencies that we aim to discover. We then explain the details of our dependency extraction al-gorithm based on timing perturbation.
3.1 What are dependencies?
Modern webpages may contain many types of objects, including HTML, Javascript, CSS, and image. These embedded objects are downloaded via separate requests on potentially multiple TCP connections instead of all at once. For instance, the main HTML object may con-tain a Javascript object whose execution will lead to ad-ditional downloads of HTML and image objects. We say one objectdependson the other if the former can-not be downloaded until the latter is available. De-pendencies between objects can be caused by a num-ber of reasons. Common ones include: i) The em-bedded objects in an HTML page will depend on the HTML page; ii) Since many objects are dynamically requested during Javascript execution, these objects de-pend on the corresponding Javascript; iii) The download of an external CSS or Javascript object may block the download of other types of objects in the same HTML page [22]; iv) Object downloads may depend on certain events in Javascript object or web browser. For instance, a Javascript object may download imageBonly after
im-ageAis loaded.
Given an objectA, its dependent objects usually
can-not be requested before A is completely downloaded.
However, there are exceptions. Today’s browsers ren-der an HTML page in a streamlined fashion, by which
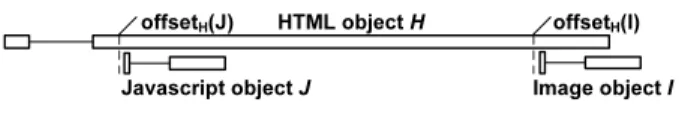
we mean the HTML page can be partially displayed even before its download finishes. For example, if an HTML page has an embedded image, the image can be downloaded and displayed in parallel with the down-load of the HTML page. The image downdown-load may start once the tag<img src=... /> (identified by a byte offset in the HTML page) has been parsed. We call an HTML object astream object. We use depen-dencyoffsetA(img)to denote the offset of the last byte
of<img src=... /> in the stream object A. We
observed this streamlined processing behavior in major browsers including IE, Firefox and Chrome.
Given an objectX, we usedescendant(X)to denote
the set of objects that depend onXand useancestor(X)
to denote the set of objects that X depends on. By
definition, X cannot be requested until all the objects
inancestor(X) are available. Among the objects in
ancestor(X), we are particularly interested in objectY
which is the last to become available. We callY thelast
parentofX. IfY is a stream object, itsavailable-time
is when the dependencyoffsetY(X)has been loaded.
IfY is a non-stream object, its available-time is when Y is completely loaded. In §4.1, we will explain how
to use the available-time ofY to estimate the start time
ofX’s download. Essentially, this will allow us to
pre-dict the PLT of a webpage. WhileX only has one last
parent in one particular page load, its last parent may change across different page loads due to variations in the available-time of its ancestors. We useparent(X)to
denote the subset of the objects inancestor(X)which
may be the last parent ofX.
Given a webpage, we use aparental dependency graph (PDG)to encapsulate the parental relationship between objects in the page. AP DG = (V, E)is a Directed
Acyclic Graph (DAG) and includes a set of nodes and directed links. Each node is a web object. Each link
Y ←XmeansY is a parent ofX.
3.2 How to extract dependencies?
WebProphetextracts the dependencies of a webpage by perturbing the download of individual objects. Our key observation is the delay of an individual object will be propagated to its descendants. While conceptually sim-ple, the major challenge is to extract the stream parent of an object and the corresponding dependency offset. Sup-pose an object X has a stream parentY. To discover
this parental relationship and the dependency offset, the available-time ofoffsetY(X)must be later than that of
all the other parents ofX in a particular page load. This
requires the ability to control the download of not only each non-stream parent ofX as a whole but also each
see in§7.4, correctly extracting stream parents and
de-pendency offsets is critical for accurate PLT prediction.
Discovering ancestors/descendants: Given a webpage
and its embedded objects, we discover the descendants of each object iteratively. In each round, we reload the page and delay the download of an objectX forτ
sec-onds. Here,Xis an object which has not been processed
andτ is much greater than the normal loading time of
any object. The descendants ofXare the objects whose
download is delayed together withX for at leastτ
sec-onds. We repeat this process until the descendants of all the objects are discovered. Note that the order by which we delay each object has no influence on the final result. Our approach for dependency extraction makes two assumptions. First, we assume the dependencies of a webpage do not change during the discovery process. This may not hold in practice. When a page is reloaded, there could be some minor changes in the new page. For instance, there could be parameter changes in the Uni-versal Resource Identifier (URI) of certain objects. We tackle this problem by matching similar URIs in differ-ent rounds according toedit distance. Moreover, there could be object changes due to reasons such as new ad-vertisements. We find such changes tend to have limited impact on the overall structure of the page or the PDG. This is because the number of affected objects is small and they usually do not have any descendants. In§7, we
will show that our prediction results are highly accurate in spite of minor changes in webpages.
The second assumption we make is that the artificially injected delay will not change the dependencies in the page. Among the pages we studied, we found only one exception in the “driving directions” webpage of Google Maps. There are two JavascriptsA.jsandB.jswhich have the same parent main.js. We use A and B
to represent the names of these two Javascripts, given their original names are very long. Whenmain.jsis severely delayed,A.jsandB.jssometimes are com-bined into one single Javascript named AB.js. This probably reflects the fact that main.js attempts to adapt when it detects poor download speed. We iden-tified this application behavior because it leads to in-consistencies in the extracted dependencies of the page. Among the applications we studied, only Google Maps exhibits this behavior which is handled with a simple heuristic. In the future, we plan to devise a more sys-tematic solution to deal with such behavior.
Extracting non-stream parents: Given a non-stream
objectX and its descendantZ, we observe thatXis the
parent ofZ if and only if there does not exist an object Y which is the descendant ofX and the ancestor ofZ.
On the one hand, if suchY exists, the available-time ofY
will always be later than that ofX. This is becauseXis a
non-stream object andY cannot be downloaded untilX
offsetH(J) H T M L ob j ec t H offsetH(I) Ja v a sc r i p t ob j ec t J Im a g e ob j ec t I
Figure 3: Stream parent example.
is available, which impliesXcannot be the parent ofZ.
On the other hand, ifY does not exist, we can imagine a
scenario whereX is delayed until all the other ancestors
ofZ are available. This is possible because none of the
other ancestors ofZ depend onX. This impliesX may
indeed be the parent ofZ. Based on this observation,
AlgorithmExtractNonStreamParenttakes the set of objects and the set of descendants of each object (in-ferred from the previous step) as input and computes the parent set of each object.
ExtractNonStreamParent(Object, Descendant) For X in Object For Z in Descendant(X) IsParent = True For Y in Descendant(X) If (Z in Descendant(Y)) IsParent = False Break EndIf EndFor
If (IsParent) add X to Parent(Z) EndFor
EndFor
Extracting stream parents and dependency offsets:
The method described above may not be useful for dis-covering the stream parent of an object. We illustrate this with an example in Figure 3. A large HTML ob-jectH contains a JavascriptJ and an imageI. J andI
are embedded in the beginning and the end ofH
respec-tively (offsetH(J)< offsetH(I)). Because the URI of I is defined inJ,Icannot be downloaded untilJ is
exe-cuted. This causesIto depend on bothH andJwhileJ
only depends onH. According to the previous method, H cannot be the parent ofI sinceJ is the descendant of H and the ancestor ofI. Nonetheless, when the
down-load of H is slow, J may have been downloaded and
executed beforeoffsetH(I)becomes available. In this
case,Hbecomes the last parent ofI.
Given a stream objectHand its descendantI, we use
the following method to determine whetherHis the
par-ent ofI. We first reload the whole page and control the
download ofH at an extremely low rateλ. IfH is the
parent ofI, all the other ancestors ofI should have been
available by the time offsetH(I) is available. We can
then estimate offsetH(I)withoffsetH(I)0, where the
latter is the offset ofH that has been downloaded when
the request ofI starts to be sent out. offsetH(I)0 can
be directly inferred from network traces and is usually a bit larger thanoffsetH(I). This is because it may take
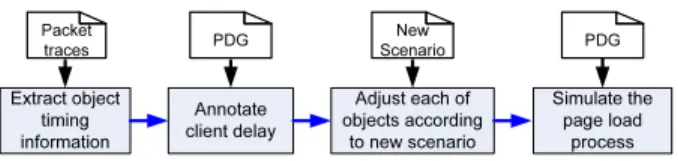
Extract object ti m i n g i n f orm ati on S i m u l ate th e p ag e l oad p roces s A n n otate cl i en t d el ay A d ju s t each of objects accord i n g to n ew s cen ari o PDG Pa c k e t t r a c e s N e w S c e n a r i o PDG
Figure 4: Performance prediction procedure. some extra time to requestI afteroffsetH(I)is
avail-able. SinceH is downloaded at an extremely low rate,
these two offsets should be very close.
GivenoffsetH(I)0, we perform an additional parental
test to determine whetherHis the parent ofI. We reload
the whole page again. This time, we control the down-load ofH at the same low rate λas well as delay the
download of all the known non-stream parents ofI byτ.
LetoffsetH(I)00be the offset ofHthat has been
down-loaded when the request ofI is sent out in this run. If
offsetH(I)00−offsetH(I)0 τ ×λ, this indicates the
delay ofI’s known parents has little effect on whenI is
requested. Therefore,Hshould be the last parent ofI.
The choice of λreflects the trade-off between
mea-surement accuracy and efficiency. A smaller λallows
us to estimateoffsetH(I)more accurately but leads to
longer running times. The parameterτ directly affects
the accuracy of parental tests. If τ is too small, the
results may be susceptible to noise in experiment, in-creasing the chance of missing true parents. If τ is
too large, we may mistakenly infer a parental relation-ship becauseoffsetH(I)00−offsetH(I)0is bounded by
sizeH−offsetH(I)wheresizeHis the page size ofH.
In our current system, we useλ=sizeH/200bytes/sec
andτ = 2seconds. This means the HTML objectHwill
take 200 seconds to transfer. We will study the accuracy of dependency extraction in§6.
Discussion: We currently infer the timing information
from the packet trace of a page load (§4.1). One alternate
approach is to extract dependencies through some com-bination of static and dynamic program analysis. In fact, it is quite straightforward to parse an HTML object to extract its dependencies. However, extracting the depen-dencies of Javascript objects requires extensive browser instrumentations. Since the PDG of a page may vary de-pending on how the page is rendered by a browser, we will have to instrument each type and each version of the major browsers. In comparison, our trace-based ap-proach can more easily work with different browsers.
4 Performance Prediction
In this section, we describe our methodology for predict-ing performance under hypothetical scenarios. Given the PLT of a webpage in a baseline scenario, we aim to pre-dict the new PLT when there are changes in thedelay
fac-request rep l y
Response time
Req u est tr a nsf er time Repl y tr a nsf er time
Tf H TTP r e q u e s t
s t a r t Tl H TTP r e p l y e n d
Figure 5: Decomposition of an HTTP activity.
tors(including client delay, server delay, RTT, and DNS lookup time) of any objects in the page. The basic idea is to develop a model that can simulate the page load process of a browser under any hypothetical scenarios. In practice, the page load process can be very complex, since it also relates to browser behavior and parameters, web objects dependencies, versions of TCP and HTTP protocols, and network conditions. The key challenge is to keep the model simple and yet accurate. This requires us to provide the right level of abstraction in the model which captures the most fundamental characteristics of webpages and browsers.
Figure 4 illustrates the overall flow of performance prediction inWebProphet. We first infer the timing infor-mation of each object from the packet trace of a page load in a baseline scenario. Based on the PDG of the page, we further annotate each object with additional timing infor-mation related to client delay. We then adjust the object timing information to reflect the changes from the base-line scenario to the new one. Finally, we simulate the page load process with the new object timing informa-tion to estimate the new PLT. We will explain the first three steps in§4.1 and leave the details of the last step in §4.2.
4.1 Acquiring object timing information
Inferring basic object timing information: We infer
web objects and their timing information from the packet trace of a page load collected on the client side. This makes our approach easily deployable since it does not require any instrumentation in browsers or applications. We identify three types ofactivitiesin the trace:
• DNS: the time used for looking up a domain name. • TCP connection: the time used for establishing a
TCP connection.
• HTTP: the time of loading a web object. As
illustrated in Figure 5, an HTTP activity can be further decomposed into three parts: (i) Request
transfer time: the time to transfer the first byte to the last byte of an HTTP request; (ii) Response
time: the time from when the last byte of the HTTP request is sent out to when the first byte of the HTTP reply is received. This includes one RTT plus server delay; (iii) Reply transfer time: the
time to transfer the first byte to the last byte of an HTTP reply.
In addition, we infer the RTT for each TCP connec-tion. The RTT of a TCP connection should be quite stable since the entire page load process usually lasts for only a few seconds. We also infer the number of round-trips involved in transferring an HTTP request or reply. Such information allows us to predict HTTP trans-fer times when RTT changes. We will provide the details of packet trace analysis in§5.3.
Adding client delay information: When the last
par-ent of an objectX becomes available, the browser will
not issue a request forX immediately. This is because
the browser needs time to do some additional process-ing, e.g., parsing HTML page or executing Javascript. For objectX, we use theclient delayto denote the time
from when its last parent is available to when the browser starts to request it. When the browser loads a sophisti-cated webpage or the client machine is slow, client delay may have significant impact on PLT. We infer the client delay of each object by combining basic object timing information with the PDG of the page. Note that when the browser starts to request an object, the first activity can be DNS, TCP connection, or HTTP depending on the current state and behavior of the browser.
Many browsers limit the maximum number of TCP connections to a host,e.g., six in IE 8 and Firefox 3. This can cause the request for an object to wait for available connections even when it is ready to be sent. Therefore, the client delay we observe in a trace may be longer than the actual browser processing time. To overcome this problem, when collecting the packet trace in a baseline scenario, we set the TCP connection limit of the browser to a large number, for instance, 30. This helps to elimi-nate the effects of connection waiting time. Nonetheless, we will still predict the PLT in a new scenario under the default TCP connection limit of the browser (§4.2). Adjusting object timing information according to
new scenario: So far, we have obtained the object
tim-ing information under the baseline scenario. We need to adjust the timing information for each object according to the new scenario. Letserverδbe the server delay
dif-ference between the new and the baseline scenario. We simply addserverδ to the response time of each object
to reflect the server delay change in the new scenario. We use similar methods to adjust DNS activity and client de-lay for each object. RTT change (rttδ) needs some
spe-cial handling. Suppose the HTTP request and response transfers involvemandnround-trips for objectX. We
will add(m+n+ 1)×rttδ to the HTTP activity ofX
andrttδ to the TCP connection activity if a new TCP
connection is required for loadingX. Our assumption
is that the number of round-trips involved in loading an object is the same in the baseline and new scenarios. Our
results in §7 confirm the validity of this assumption in
PlanetLab experiments. This assumption could be vio-lated if bandwidth becomes the bottleneck,e.g., in DSL link. Further research is needed to deal with such scenar-ios.
Discussion on object & DNS cache: Besides the four
delay factors mentioned above, the PLT of a page in a new scenario will also be affected by the object and DNS cache. To handle cached objects and DNS names in a new scenario, we collect page load traces with the same set of cached objects and DNS names in a baseline sce-nario. We will explain how to control object and DNS cache in §5.1. SupposeΨis the PDG of a page when
no object is cached. When an objectxis cached,Ψwill
transform into a new PDGΨ0 wherexis removed and
each of its childrenxcis directly connected with each of
its parentsxp. Accordingly, the client delay of(xc, xp)
in Ψ0 will include the cache lookup time ofx and the
client delay of(x, xp)and(xc, x)inΨ. Hence, there is
no need to explicitly consider the timing information of
xinΨ0.
Our current approach can only predict the PLT under the same caching state. Given a page withnobjects, we
will need to measure2nbaseline scenarios to handle all
the possible caching states. To reduce the measurement overheads, we could explicitly model the timing infor-mation of a cached object xin three cases: i) TTL has
not expired: xis directly looked up from cache; ii) TTL
has expired butxhas not changed: x is revalidated and
then looked up from cache; iii) TTL has expired andx
has changed: xis revalidated and downloaded from the
server. To predict the PLT under any caching state, we simply need to extend our model to include the cache lookup time and the number of round trips involved in the revalidation of each object. We can use a small con-stant to represent the former and perform controlled ex-periments to measure the latter. The details are out of the scope of this paper.
4.2 Simulating page load process
We now describe our methodology for predicting PLT based on object timing information. The key challenge here is object downloads are not independent from each other. The download of an object may be blocked be-cause its dependent objects are unavailable or bebe-cause there are no TCP connections ready for use. To tackle these problems, we simulate the page load process by taking into account the constraints of browser and PDG.
Browser behavior: We studied a few popular browsers
including IE, Firefox and Chrome. They share a few important features. Presently, they all use HTTP/1.1 ei-ther with HTTP pipelining disabled by default or without pipelining support at all. This is because HTTP
pipelin-Case I II III IV V
First web object of a domain Y Y N N N
Cached DNS name N Y - -
-Available TCP connections - - Y N N
Max # of parallel connections - - - N Y
Involved activities in Figure 6 a b c b d
Table 1: Five possible cases for loading an object.
HTTP time (c) w i t h o u t D N S an d T C P t i m e (b) w i t h T C P t i m e (a) w i t h bo t h D N S an d T C P t i m e HTTP time TC P time C l ien t
D el a y D N Stime TC P time HTTP time Tr HTTP r eq u es t r ea d y Tp l a s t p a r en t a v a il a b l e Tf Tl Tf Tl Tr Tf Tl Tr Tp Tp HTTP time (d) w i t h T C P w ai t i n g t i m e Tf Tl Tp TC P w a itin g time Tr C l ien t D el a y C l ien t D el a y C l ien t D el a y
Figure 6: Four cases of activities for loading an object. ing has not been widely supported by proxies and may have head-of-line blocking with the presence of dynamic contents [1],e.g., one slow response in the pipeline will block other subsequent responses. Given the fact, we do not consider the effect of pipelining in this paper. More sophisticated techniques might be needed to model pipelining if it becomes widely-used in the future. With-out pipelining, HTTP request-reply pairs do not overlap with each other within the same TCP connection.
In HTTP/1.1, a browser uses persistent TCP connec-tions which can be reused for multiple HTTP requests and replies. The browser attempts to keep the number of parallel connections small. It opens a new connection only when it needs to send a request but all the existing connections are occupied by other requests or replies. A browser is configured with an internal parameter to limit the maximum number of parallel connections with a par-ticular host. Note that the limit is applied to a host instead of to an IP address. If multiple hosts map to the same IP address, the number of parallel connections with that IP address can exceed the limit.
Loading an object may trigger multiple activities in-cluding looking up a DNS name, establishing a new
TCP connection, waiting for an existing TCP connec-tion, and/or issuing an HTTP request. Table 1 lists the five possible cases and the conditions of each of these cases. A “-” in the table means the corresponding con-dition does not matter. The activities involved in each case are illustrated in Figure 6. For instance, in Case V, a browser needs to load an object from a domain with which it already has TCP connections. Because all the existing TCP connections are occupied and the number of parallel connections has reached the maximum limit, the browser has to wait for the availability of an existing connection to issue the new HTTP request (Figure 6(d)).
PredictPLT(ObjectTimingInfo, PDG) Insert root objects into CandidateQ While (CandidateQ not empty)
1) Get earliest candidate C from CandidateQ 2) Load C according to conditions in Table 1 3) Find new candidates whose parents
are available
4) Adjust timings of new candidates 5) Insert new candidates into CandidateQ Endwhile
Simulating page load: Given a webpage, Algorithm
PredictPLTtakes the timing information of each
ob-ject and the PDG as input and simulates the page load process. The PLT is estimated as the time when all the objects are loaded. For each object X, the algorithm
keeps track of four time variables: i)Tp: whenX’s last
parent is available; ii)Tr: when the HTTP request forX
is ready to be sent; iii) Tf: when the first byte of the
HTTP request is sent; and iv)Tl: when the last byte
of the HTTP reply is received. Figure 6 illustrates the position of these time variables in four different scenar-ios. In addition, the algorithm maintains a priority queue
CandidateQwhich contains the objects that can be
re-quested. The objects in CandidateQare sorted based
onTr.
5 Implementation
As illustrated in Figure 2, the implementation of
WebProphetcomprises three major components. In this section, we will describe each of them in more detail. The whole system is implemented with roughly 11,000 lines of code in Python, Perl, Javascript and Bro’s policy language [18].
5.1 Measurement engine
The measurement engine includes a set of web agents
which are currently deployed at multiple PlanetLab sites. These web agents allow us to measure the PLT of a web-page under diverse client, server, and network condi-tions. A centralized controller is used to maintain the
continual operation of the agents and perform upgrade when a new version of agent software becomes available. The controller can upload script snippets to an agent to control the interaction between the agent and a webpage. It also retrieves and stores the packet traces from the agents logged bytcpdump. The controller is written in Perl and Python with 1,300 lines of code.
The web agent needs to meet a few requirements. First, it should be able to interact with a webpage au-tomatically. As mentioned in§2,WebProphetrequires a
potentially large number of page load traces in a baseline scenario to predict the statistical properties (e.g., median or 95th-percentile) of the PLT distribution in a new sce-nario. Second, it should behave like a full-featured web browser in order to simulate user interaction with sophis-ticated web 2.0 applications,e.g., Google Maps. This is especially important for correctly measuring the user-perceived PLT of these complex applications. Third, it should provide support for setting object and DNS cache, which will affect the PLT (§4.1). We need to
con-trol the web agent to cache the same set of objects and DNS names in the baseline and new scenarios. Fourth, it should be able to adjust the parallel TCP connection limit,e.g., to a large number, to eliminate the impact of connection waiting time (§4.1).
Existing web measurement tools cannot meet our re-quirements. Simple web clients (e.g., wget, curl, and lynx) do not execute the Javascripts in the pages. Web form automation tools [3, 5, 7] and KITE [4] (an auto-mated web measurement tool developed by Keynote) do not provide control for object/DNS cache or TCP con-nection limit. This prompts us to develop our own web agent, which uses Jssh plug-in to take full control of the Firefox 3 browser. Through the XPCOM [8] interfaces of Firefox, we use Javascript to call the internal APIs of Firefox. These internal APIs supports object and DNS cache control, TCP connection limit adjustment, and user input simulation. The user inputs from mouse and key-board can be simulated as DOM [6] events.
We developed a set of script snippets to automate the interactions with multiple complex web services, such as Google/Yahoo Search, Google/Yahoo Maps, Gmail, Hotmail, Flickr,etc.The script snippet for each web ser-vice comprises only about 10 to 150 lines of code, de-pending on the complexity of the service. We believe it is quite easy to create new script snippets for other ser-vices too. The web agent, excluding the service-specific script snippets, is implemented in Javascript and Python with 1,100 lines of code. The whole automation part of the web agent has no measurable effects on PLT since it incurs very little overhead.
5.2 Dependency extractor
To extract the PDG of a web page, we setup a web agent to go through a web proxy running on the same host. The web proxy is modified from a simple proxy writ-ten in Python. We exwrit-tended the proxy with the support of delaying the download of any specified object, which is required for discovering the descendants of the object (§3.2). We also added the functionality of controlling the
download speed of a stream object, which is required for discovering stream parent and dependency offset (§3.2).
Given a webpage, we first obtain the list of its embed-ded objects by loading it once. The proxy will cache all the objects observed in the first round for future use. This reduces the measurement overhead imposed on the origin servers. We then subsequently control the download of one object during each page reload and record the timing information of object download. Finally, we extract the PDG according to the procedure described in§3.2. The
dependency extractor and web proxy include 2,800 lines of code in Python.
5.3 Performance predictor
The performance predictor comprises a trace analyzer
and apage simulator. The trace analyzer extracts ba-sic object timing information (described in§4.1) from
packet traces in pcap format. It leverages Bro [18], a network intrusion detection system, to parse DNS, TCP, and HTTP protocol information. We write programs us-ing Bro’s policy language to recover timus-ing information,
e.g., DNS lookup time, TCP handshake time, and HTTP transfer and response times.
We estimate the RTT of a TCP connection using the time between the SYN and SYN/ACK packets. This is because many web services have relatively short TCP connections (e.g., a few seconds) and the RTT is usually quite stable in such time scale. We could use other exist-ing techniques [12, 24] to estimate RTT for web services that involve long TCP connections. We infer the num-ber of round trips involved in an HTTP transfer based on the TCP self-clocking behavior [24] — the packets in the same TCP send window are very close to each other while the packets in two adjacent send windows are at least one RTT apart. We compute the server delay by subtracting one RTT from the time interval between two adjacent send windows. Using this method, we find Google and Yahoo Search process user query in a stream-lined fashion. The server will return partial results to users while additional results are being generated. This causes some extra delay to the reply packets in multiple different round trips. Our method can handle such cases well, leading to high prediction accuracy reported in§7.
The page simulator combines the basic object timing information and the PDG to infer the client delay of each
object. It then adjusts the timing of each object accord-ing to the specifications in the new scenario. Finally, it simulates the page load process (§4.2) and outputs the
predicted PLT. The trace analyzer and page simulator in-clude 6,200 lines of code written in Python and Bro’s policy language.
6 Results of Dependency Extraction
We now characterize and validate the PDGs of Google/Yahoo Search and Maps extracted by
WebProphet. Google/Yahoo Search are two of the most popular web services and their PDGs are relatively easy to validate. In contrast, the PDGs of Google/Yahoo Maps are much more complex. In fact, Yahoo Maps has the most complicated PDG in terms of the number of objects and dependencies among all the web services we studied (including Amazon.com, Flickr, and Google Docs).
In this paper, we only present the results on the cases where there is no cached object. This is common for ac-cessing webpages in which most contents are dynamic. For instance, Yahoo performance team found 40 to 60% of Yahoo users have an empty cache when visiting Ya-hoo [22]. Our approach also works when some objects are cached and we omit those results here due to lack of space.
Figure 7: The PDG of Google Search.
HTML
C S S I m a g e I m a g e I m a g e I m a g e I m a g e
J a v a s c r i p t
Figure 8: The PDG of Yahoo Search.
Google/Yahoo Search PDG:Figure 8 illustrates the
in-ferred PDGs of Google/Yahoo Search for the search key-word “mapouka”. The Google Search page has one
#H T M L =1 #J S =1 #H T M L =1, #J S =1, #I M G =17 #J S =1 #J S =1, #I M G =2 8 #J S =1 #J S =3 #I M G =1 #I M G =8
Figure 9: The simplified PDG of Google Maps. HTML and several images while the Yahoo Search page has one HTML, one CSS, and a few Javascripts and im-ages. The Google Search page is simpler than that of Yahoo. The former has not only a fewer number but also fewer levels of dependencies. This could be one of the factors that cause the PLT of Google Search to be smaller (§7). The PDGs for different keywords have
similar structure. Some keywords may lead to an extra Javascript object or a different number of images in the PDG of Google Search. Because the Search pages are not very complicated, we are able to verify that the PDGs produced byWebProphetare the same as those extracted through manual code analysis.
Google/Yahoo Maps PDG: We study the PDG of the
driving direction pages of Google/Yahoo Maps. We use a pair of addresses of the Whole Foods stores in Arkansas, USA. The full PDGs of Google/Yahoo Maps are too complex to read,e.g., Yahoo Maps has a total number of 110 objects and 172 dependencies. Instead of showing the full PDGs, we simplify them by merging the objects that share the same sets of parents and children into a single node. The two simplified PDGs are shown in Fig-ure 9 and 10. Each node carries a label which describes the number of objects of certain type. For instance, la-bel “#HTML=1,#JS=1,#IMG=17” means this node cor-responds to 1 HTML, 1 Javascript, and 17 image objects in the full PDG.
Apparently, the PDGs of Maps are significantly more sophisticated than those of Search. They include more Javascripts for user interactions and more images for map tiles. The PDG of Yahoo Maps is even more complex than that of Google Maps, as the former comprises a larger number and more levels of dependencies. The PDGs for different address inputs are quite similar. The main differences are in the map tile images.
The Javascripts of Google/Yahoo Maps are not only large (536KB and 670KB respectively) but also obfus-cated. It is difficult for us to validate the extracted PDGs via manual code analysis. Instead, we verify their cor-rectness in an indirect manner. First, we use our de-pendency extractor to obtain the “approximate” PDGs of Google/Yahoo Maps. Then we construct our own
web-#H T M L =1 #C S S =2 #J S =1 #J S =1 #J S =1 #J S =1 #I M G =1 #I M G =2 #I M G =2 #J S =5, #I M G =3 #J S =1 #J S =1 #I M G =1 #I M G =4 #J S =1 #J S =1 #J S =1 #H T M L =2, #I M G =6 5 #I M G =1 #I M G =10 #H T M L =1 #I M G =1 #I M G =1
Figure 10: The simplified PDG of Yahoo Maps. pages which exactly match the “approximate” PDGs in the number of objects, the types of objects, and the de-pendencies between objects. After that, we attempt to infer the PDGs of the constructed pages as if we know nothing about the “approximate” PDGs. We find the inferred PDGs exactly match the “approximate” PDGs. Although this does not prove that we have extracted the real PDGs of Google/Yahoo Maps, it at least sug-gests that we can correctly handle webpages as com-plex as Google/Yahoo Maps. Moreover, in§7, we will
show thatWebProphetcan accurately predict the PLT of Google/Yahoo Maps under various hypothetical scenar-ios using the “approximate” PDGs.
7 Prediction Accuracy
In this section, we evaluate the PLT prediction accuracy ofWebProphetfor Google/Yahoo Search and Maps. We first conduct controlled experiments by manipulating the DNS delay, RTT, and server delay for all the objects or a subset of the objects in a webpage. We then conduct real-world experiments in which every delay factor of every object changes simultaneously. We find that ignor-ing object dependencies may lead to significant errors in the PLT prediction for complex webpages. Finally, we show that identifying stream parent and dependency off-set is particularly important for accurate PLT prediction for simple webpages.
Supposetbandtnare the PLT in the baseline and new
scenarios and tp is the PLT predicted byWebProphet.
We could have usederrr = abs(ttpn−tn), the relative
er-ror betweentp andtn, to evaluate the prediction
accu-racy. However, we finderrrmay not be the right metric
because it tends to be small whenabs(tb−tn)<< tn.
Therefore, we chooseerrc=abs(1−ttnp−−ttbb)as our
eval-uation metric. It represents the relative error of predicted PLT change compared to the actual PLT change between
the baseline and new scenarios. For instance, suppose
tb = 5,tn = 4, andtp = 4.2seconds. The prediction
error will be 5% measured inerrrvs. 20% measured in errc. As mentioned in§2, the PLT of a webpage may
not be a constant under a given scenario. In this paper, we focus onerr50
c anderrc95which are computed based
on the median and 95th-percentile in the baseline, new, and predicted PLT distributions. These two metrics help to quantify whetherWebProphetcan make accurate pre-diction both for the normal case and for the extreme case. In the following experiments, we consider the scenar-ios where a web service provider is interested in predict-ing the PLT reductions as a result of certain optimiza-tions to the service. To evaluate the prediction accuracy in each of the experiments, we collect two set of page load traces in the baseline scenario. The first set, col-lected with normal TCP connection limit, is for produc-ing the baseline PLT distribution. The second set, col-lected with a large TCP connection limit, is for infer-ring the object timing information in the baseline sce-nario (§4.1). Thereafter, this object timing information
is used to generate the predicted PLT distribution in the new scenario. We also collect one set of traces in the new scenario, from which we can extract the actual new PLT distribution for validation purpose. Each of the three sets contains 500 page load traces, which provides enough samples for computingerr95
c anderrc50. We only present
the results based on one random keyword for the Search services and one random pair of addresses for the Maps services. The results of using other keywords or pairs of addresses are similar.
Before presenting the results, we discuss two problems that may cause the predicted PLT to deviate from the ac-tual PLT. First, there could be slight differences between the times when the three set of traces are collected. These time differences may lead to differences in the client, server, and network conditions under which the traces are collected. The resulting “prediction error” is actu-ally due to the limitations of our validation methodology rather than due to the limitations of our approach. Sec-ond, as mentioned in§2, we currently do not explicitly
consider packet loss in our model. Any loss behavior differences between the baseline and new scenarios may also lead to prediction error. As shown in the following results,WebProphetcan attain high prediction accuracy in spite of these two problems.
7.1 Controlled experiments
In the controlled experiments, we evaluate the accuracy of our performance prediction under various RTTs, DNS lookup times, and server response times. Figure 11 de-picts the setup of our experiments located at Northwest-ern University. We run a web agent to collect the packet
0 10 20 30 40 50 100 150 200 250 300
Prediction error (err
c 50) RTT changes (ms) Google search Yahoo search Google map Yahoo map (%) (a) RTT 0 10 20 30 40 50 100 150 200 250 300
Prediction error (err
c
50)
DNS response time changes (ms) Google search Yahoo search Google map Yahoo map (%) (b) DNS lookup time 0 10 20 30 40 50 100 150 200 250 300
Prediction error (err
c
50)
server response time changes (ms) Google search
Yahoo search Google map Yahoo map (%)
(c) Server response time
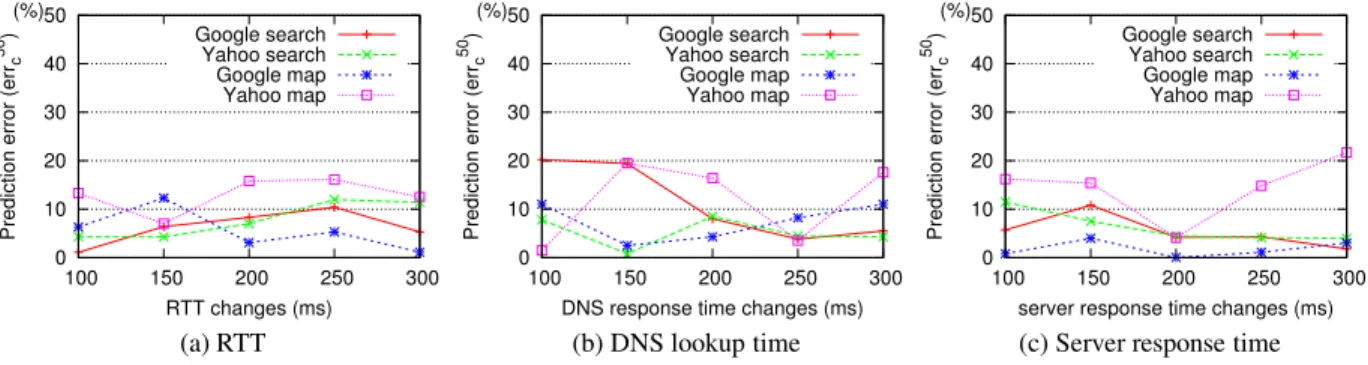
Figure 12: The prediction errors under different injected delays of RTT, DNS lookup time, and server response time.
Figure 11: Setup of controlled experiments. traces of page loads. The controlled gateway is used to inject extra delays during page loads. The normal gate-way does not manipulate any traffic. We configure the routing table on the web agent to forward the traffic to the controlled gateway or to the normal gateway to cre-ate the baseline and new scenarios respectively. Since we currently do not have a precise way to inject client delays, we simply keep the web agent lightly-loaded all the time. This ensures client delays are roughly the same in all the controlled experiments. In the next section, we will show thatWebProphetcan achieve high prediction accuracy even when client delays change.
We usenetemto inject extra RTT and DNS lookup times on the controlled gateway. netem is a network emulator in Linux which can add queuing delay to each traversing packet. To inflate RTT, we simply forward web traffic to the controlled gateway while forwarding the DNS traffic to the normal gateway. We may in-flate DNS lookup time in a similar way. Unfortunately,
netem cannot be used to inject extra server response
time because it can only add queuing delay to every packet. Instead, we develop our own tool based on
libpcapandlibdnetto inflate server response time.
Our tool can identify and delay the packets that corre-spond to the HTTP requests from the agent to the web server for certain amount of time. In effect, this extra delay will be considered as part of the server response time (§4.1). Note that this may trigger TCP timeout on
Service t50 b t 50 n t 50 p err 50 c err 95 c Indeperr 50 c Gsearch 0.74 0.21 0.23 3.8% 15.9% 1.2% Ysearch 1.04 0.26 0.24 3.2% 2.2% 13.0% Gmap 4.10 2.12 2.01 5.5% 11.0% 49.7% Ymap 6.19 3.99 4.03 1.7% 1.2% 85.5%
Table 2: Changing RTT and DNS lookup time together. the web agent. Our tool will intercept and drop all the related retransmitted packets.
Manipulating one delay factor at a time: In the first
group of experiments, we evaluate the prediction accu-racy when we change one delay factor for all the objects across a certain range. We inject five different delay val-ues (100, 150, 200, 250, and 300 ms) to create the base-line scenarios. These values reflect the real delay differ-ences observed from different PlanetLab sites (e.g., those in Asiavs.those in the US) to our server at Northwestern University. We use the scenario without any injected de-lay as the new scenario that we aim to predict. Figure 12 (a)-(c) illustrate theerr50
c for the four web services as we
change RTT, DNS delay, and server delay. Among the to-tal of 60 experiments, 50% of them haveerr50
c ≤6.1%,
90%err50
c ≤16.2%. The maximumerr50c is 21.7%.
Manipulating RTT and DNS delay together:Next, we
evaluate the accuracy of performance prediction when multiple delay factors change simultaneously. We in-flate both RTT and DNS delay by 100 ms for all the objects to create the baseline scenario. We still use the scenario without injected delay as the new scenario. Ta-ble 2 shows the prediction error for the four applications.
t50
b ,t50n andt50p are the median PLT of the baseline, new,
and predicted scenarios.WebProphetcan accurately pre-dict not only the median PLT but also the 95th-percentile PLT. The maximumerr50
c anderr95c are only 5.5% and
15.9% respectively.
Manipulating only a subset of objects:So far, we have
changed the delay factors for all the objects simultane-ously. In fact,WebProphetcan make accurate
predic-DC err50 c err 95 c Akamai 16.0% 11.8% Y DC1 6.5% 9.7% Y DC2 14.8% 6.0%
Table 3: Inflating the RTT to different DCs. tion when we change the delay factors for any subset of objects. When visiting Yahoo Maps from Northwestern University, the web agent will download objects from Akamai CDN and two Yahoo data centers (Y DC1 and
Y DC2). In the following experiments, we create three
baseline scenarios by injecting 100 ms extra RTT to the objects from Akamai CDN,Y DC1, or Y DC2
respec-tively. We still use the scenario without injected delay as the new scenario. Our setup is to simulate the case in which the owners of Yahoo Maps want to predict the new PLT if they could reduce the RTT from users to one of their DCs or Akamai CDN. The results in Table 3 show that the prediction errors are reasonably small in all the three experiments.
7.2 Real-world experiments
In the controlled experiments, we changed the delay fac-tors by the same amount for a set of objects. In this sec-tion, we conduct experiments on PlanetLab to demon-strate the effectiveness ofWebPropheteven when each delay factor of each object changes by a different amount simultaneously. The PlanetLab nodes in the US normally experience smaller PLT when accessing Google/Yahoo Search and Maps than those in Asia and Europe. For each of the four web services, we pick one international node as the baseline scenario. We use a node at North-western University as the new scenario. This is to sim-ulate the case where the service owners want to predict the new PLT if they could optimize their services for in-ternational users in certain way. To predict the new PLT, we replace the timing information of each object in the baseline scenario with the timing information of the same object in the new scenario and then run the page load simulation.
Table 4 shows the locations of the baseline scenario and the prediction errors. Both err50
c and errc95 are
within 10.7% for all the four services. We find the pre-diction errors in the PlanetLab experiments are gener-ally smaller than those in the controlled experiments. Since we directly use the object timing information in the new scenario for PLT prediction in the PlanetLab exper-iments, the prediction results are no longer affected by the trace collection time differences between the baseline and new scenarios. This suggests our model does capture sufficient level of detail for accurate PLT prediction.
Service Baseline New err50
c err 95 c No-streamerr 50 c Gsearch Singapore US 2.0% 10.7% 21.2% Ysearch Japan US 6.1% 0.3% 258.7% Gmap Sweden US 1.2% 1.8% 1.2% Ymap Poland US 0.7% 1.3% 0.1%
Table 4: The results in the real-world experiments.
7.3 Importance of modeling object
depen-dencies
One alternate approach for performance prediction is to measure the PLT under a range of values for each de-lay factor of each object and then make predictions by extrapolating from these measured PLTs through some form of regression. This may not be feasible for com-plex webpages with many embedded objects. For in-stance, even if we measure the PLT only under two differ-ent values for each delay factor of each object in Yahoo Maps, we will end up measuring the PLT in2440
scenar-ios, when considering all the possible combinations of four factors each for 110 objects. Without detailed do-main knowledge, it is difficult to decide how many dis-tinct scenarios indeed need to be measured for accurate prediction.
One way to reduce the number of measured scenar-ios required for prediction is by assuming independence among every delay factor of every object. Letxi (i = 1...n) be the delay factors of all the objects that impact
the PLT of a webpage. Under this assumption:
f(dx1, dx2, ..., dxn) = n
X 1
fi(dxi)
Here,dxidenotes the change of delay factorxi. fi(dxi)
is a function that describes the PLT change when onlyxi
changes.f(dx1, dx2, ..., dxn)is a function that describes
the PLT change when all thexi’s change simultaneously.
In essence, this equation says the PLT change caused by eachxi is independent from the PLT changes caused by
other delay factors. If this assumption holds, the number of measured scenarios required for prediction will be-come linear to the number of delay factors, significantly reducing the measurement overheads. Recently, Chenet al. developed a latency prediction tool based on similar assumption [10].
In the following, we study to what extent such inde-pendence assumption affects the prediction accuracy. We use the same baseline scenario as that of Table 2 in§7.1,
in which both RTT and DNS delay are inflated by 100 ms for all the objects. We still use the scenario without injected delay as the new scenario. For each web ser-vice, we divide the objects in the page into three groups (G1, G2, and G3) and subsequently measure the PLT
changeδiwhen we only change the delay factors for one
groupGiat a time. We then predict the PLT change
be-tween the baseline and new scenarios by taking the sum ofδi’s. As shown in column “Indeperr50c ” of Table 2,
the prediction errors are significantly higher than those ofWebProphetfor Google/Yahoo Maps. In particular for Yahoo Maps,err50
c is as high as 85.5%. The
pre-diction errors are smaller for Google Search because its webpage has very simple dependencies. Since eachδi
is directly measured instead of being predicted by any model, the prediction error should be close to zero when the delay factors are indeed independent. The results of the experiment highlight the importance of capturing ob-ject dependencies for accurate PLT prediction.
7.4 Importance of identifying stream
par-ent
One of the key steps in our PDG extraction is to iden-tify stream parents and dependency offsets (§3.2). We
now evaluate the importance of identifying stream par-ents in prediction accuracy. We use the same baseline and new scenarios as those in the PlanetLab experiments in§7.2. The only difference is that we ignore all the
de-pendencies on stream parents in the PDGs when we make predictions. As shown in column “No-Stream err50c ”
in Table 4, the prediction errors without stream parents are much higher than those with stream parents for the Search services. Nonetheless, the prediction errors are roughly the same for the Maps services. This is because the HTML objects account for a significant portion of the Search pages. In contrast, most of the objects in the Maps pages are non-stream ones,e.g., Javascripts and images.
8 Usage Scenarios
As illustrated in the previous sections, the PLT of a com-plex webpage may depend on the delay factors of many objects. The owner of the page often faces the challenge of finding a cost-effective way to improve service per-formance from a huge number of possible optimization strategies. SinceWebProphetcan make fast and accurate prediction under the changes of any delay factor and/or object, it provides the service owner an easy way to nar-row down the strategies that could bring the most benefit. Because Yahoo Maps has the most complex webpage and the largest median PLT (measured from Northwest-ern University) among all the four services, we use it as an example to demonstrate the power of WebProphet. Though we cannot directly validate the effect of these changes, the experiments described in§7 provide a
ba-sis for trust in the predictions. Suppose the owners of Yahoo Maps are considering three methods to optimize the median PLT: i)OP Trtt: reducing the RTT of certain
static objects by moving them from Yahoo data centers to the Akamai CDN; ii)OP Tserver: reducing the server
re-sponse time by half for certain dynamic objects; and iii)
OP Tclient: reducing the client execution time by half
for certain objects. Since the Yahoo Maps page contains about 110 objects including roughly 74 static objects and 36 dynamic ones, it could be too costly to optimize for all of them. Hence, we seek to identify a small set of
candidate objectswhose optimization would lead to sig-nificant PLT reduction.
In this paper, we use a simple greedy-based algorithm to search for those candidate objects. In the future, we could also leverage other more sophisticated search al-gorithms (such as simulated annealing) to obtain better results. Our search algorithm considers one of the opti-mization methods (OP Trtt,OP Tserver, orOP Tclient)
at a time. It starts with a list of all the objects and the original object timing information extracted from the page load trace that corresponds to the median of the baseline PLT distribution. At each step, it greedily picks the candidate object whose optimization will lead to the largest PLT reduction among all the remaining objects. It then removes the new candidate object from the list and updates its timing information according to the opti-mization method. This process terminates when the PLT reduction resulting from the optimization of a new can-didate object becomes negligibly small.
After evaluating 2,176 hypothetical scenarios, we identify 5 candidate objects forOP TserverandOP Trtt
respectively. We also identify 14 candidate objects for
OP Tclient. The predicted PLT reductions by applying OP Trtt,OP Tclient, andOP Tserver are 14.8%, 26.6%,
and 1.6% respectively. Apparently,OP Tserverdoes not
seem to be promising, since it can only reduce PLT slightly. The PLT can be further reduced by 40.1% by combiningOP TrttandOP Tclienttogether. Therefore,
by simply optimizing the client execution time of 14 ob-jects and moving 5 static obob-jects to Akamai CDN, we predict that the median PLT of Yahoo Maps can be cut from 3.99 to 2.39 seconds.
9 Systems Evaluation
We now evaluate the systems overhead of dependency extraction and performance prediction. The dependency extraction process includes two steps: 1) subsequently control the download of each object during a page load; and 2) extract the PDG from the recorded timing infor-mation of object download (§3.2). Step 2 is relatively
simple. The running time is dominated by step 1 because we need to reload a page many times and artificially de-lay the download of one object during each page load. Given a page withnobjects andmstream objects, we