Portland State University
PDXScholar
Civil and Environmental Engineering Faculty
Publications and Presentations Civil and Environmental Engineering
8-2015
Improved Safety Performance Functions for Signalized
Intersections
Karen Dixon
Texas A & M University - College Station
Christopher Monsere
Portland State University, [email protected] Raul Avelar
Texas A & M University - College Station
Joel Stephen Barnett
Portland State University, [email protected] Paty Escobar
Texas A & M University - College Station
See next page for additional authors
Let us know how access to this document benefits you.
Follow this and additional works at:https://pdxscholar.library.pdx.edu/cengin_facPart of theCivil and Environmental Engineering Commons, and theTransportation Commons
Citation Details
Dixon, Karen, Chris Monsere, Raul Avelar, Joel Barnett, Paty Escobar, and Sirisha Kothuri. Improved Safety Performance Functions for Signalized Intersections. FHWA-OR-RD-16-03. 2015.
Authors
Karen Dixon, Christopher Monsere, Raul Avelar, Joel Stephen Barnett, Paty Escobar, and Sirisha Murthy Kothuri
IMPROVED SAFETY PERFORMANCE
FUNCTIONS FOR SIGNALIZED
INTERSECTIONS
Final Report
IMPROVED SAFETY PERFORMANCE FUNCTIONS FOR
SIGNALIZED INTERSECTIONS
Final Report
SPR 756
by
Karen Dixon, Texas A&M Transportation Institute Chris Monsere, Portland State University Raul Avelar, Texas A&M Transportation Institute
Joel Barnett, Portland State University Paty Escobar, Texas A&M Transportation Institute
Sirisha Kothuri, Portland State University Yi Wang, Portland State University
for
Oregon Department of Transportation Research Section
555 13th Street NE, Suite 1 Salem OR 97301
and
Federal Highway Administration 400 Seventh Street, SW
Technical Report Documentation Page 1. Report No.
FHWA-OR-RD-16-03
2. Government Accession No. 3. Recipient’s Catalog No.
4. Title and Subtitle
Improved Safety Performance Functions for Signalized Intersections
5. Report Date -August 2015-
6. Performing Organization Code
7. Author(s)
Karen Dixon, Texas A&M Transportation Institute Chris Monsere, Portland State University
Raul Avelar, Texas A&M Transportation Institute Joel Barnett, Portland State University
Paty Escobar, Texas A&M Transportation Institute Sirisha Kothuri, Portland State University
Yi Wang, Portland State University
8. Performing Organization Report No.
9. Performing Organization Name and Address Oregon Department of Transportation Research Section
555 13th Street NE, Suite 1 Salem, OR 97301
10. Work Unit No. (TRAIS)
11. Contract or Grant No. SPR 756
12.Sponsoring Agency Name and Address Oregon Dept. of Transportation
Research Section and Federal Highway Admin. 555 13th Street NE, Suite 1 400 Seventh Street, SW
Salem, OR 97301 Washington, DC 20590-0003
13.Type of Report and Period Covered
Final Report
14.Sponsoring Agency Code 15. Supplementary Notes
16.Abstract
For this effort, the research team developed new safety performance functions (SPFs) for signalized intersections in Oregon. The modeling dataset consisted of 964 crashes from a total of 73 intersections that were randomly selected based on the presence of a traffic signal (identified through the crash data records). The SPFs were developed using a Poisson-lognormal Generalized Linear Mixed model framework for total crashes and severe injury crashes (coded as KAB). Three SPFs were developed: 1) an SPF for total crashes, which relies on both major and minor AADTs to predict the expected number of crashes; 2) an SPF for KAB crashes, whose predictions derive from both AADTs as well as from the speed limit on the major road; and (3) a severity model to predict the proportion of KAB crashes to be used in combination with the SPF for total crashes. The research analyses determined that the speed limit variable significantly improved the quality of the SPFs and severity model, and as expected, suggests increasing severity with speed differentials. The models were validated spatially and temporally based on additional sites and using an additional year of data. The models all performed well during the validation; however enhanced models to improve model reliability were developed based on the larger dataset. As part of the model development, this research also explored a variety of rules to identify crashes as intersection-related based on the crash geo-location (including the common 250 feet rule). Crashes were manually classified from the combined data available from the geo-location of crashes, the geometric database, and the various fields in the Oregon crash database. These classifications were then compared to a number of rule options for classifying them as intersection crashes. The analysis revealed that the best performing rule is to use crashes that were geo-located within 300 feet of the centerline intersection at signalized locations plus crashes where the crash report indicates that they were associated with a traffic control device (i.e. traffic signal). Finally, this research effort developed models to estimate to estimate minor road AADT for use in safety analysis where this exposure information is not available. These models were developed from data from 66 intersections with known minor and major AADT volumes and validated with data from another 25 intersections. Significant model variables included major AADT, number of approach lanes, functional class, presence of a two-way left-turn lane, and parallel road AADT.
17. Key Words 18. Distribution Statement
Copies available from NTIS, and online at
http://www.oregon.gov/ODOT/TD/TP_RES/
19. Security Classification (of this report)
Unclassified
20.Security Classification (of this page)
Unclassified
21. No. of Pages 174
22. Price
iii
SI* (MODERN METRIC) CONVERSION FACTORS
APPROXIMATE CONVERSIONS TO SI UNITS APPROXIMATE CONVERSIONS FROM SI UNITS
Symbol When You Know Multiply By To Find Symbol Symbol When You Know Multiply By To Find Symbol
LENGTH LENGTH
in inches 25.4 millimeters mm mm millimeters 0.039 inches in
ft feet 0.305 meters m m meters 3.28 feet ft
yd yards 0.914 meters m m meters 1.09 yards yd
mi miles 1.61 kilometers km km kilometers 0.621 miles mi
AREA AREA
in2 square inches 645.2 millimeters squared mm2 mm2 millimeters squared 0.0016 square inches in2
ft2 square feet 0.093 meters squared m2 m2 meters squared 10.764 square feet ft2
yd2 square yards 0.836 meters squared m2 m2 meters squared 1.196 square yards yd2
ac acres 0.405 hectares ha ha hectares 2.47 acres ac
mi2 square miles 2.59 kilometers squared km2 km2 kilometers squared 0.386 square miles mi2
VOLUME VOLUME
fl oz fluid ounces 29.57 milliliters ml ml milliliters 0.034 fluid ounces fl oz
gal gallons 3.785 liters L L liters 0.264 gallons gal
ft3 cubic feet 0.028 meters cubed m3 m3 meters cubed 35.315 cubic feet ft3
yd3 cubic yards 0.765 meters cubed m3 m3 meters cubed 1.308 cubic yards yd3
NOTE: Volumes greater than 1000 L shall be shown in m3.
MASS MASS
oz ounces 28.35 grams g g grams 0.035 ounces oz
lb pounds 0.454 kilograms kg kg kilograms 2.205 pounds lb
ACKNOWLEDGEMENTS
The research included in this report was sponsored by the Oregon Department of Transportation (ODOT). The project team would like to thank the research staff at ODOT and the members of the Technical Advisory Committee for their oversight and guidance in the performance of this research effort.
DISCLAIMER
This document is disseminated under the sponsorship of the Oregon Department of
Transportation and the United States Department of Transportation in the interest of information exchange. The State of Oregon and the United States Government assume no liability of its contents or use thereof.
The contents of this report reflect the view of the authors who are solely responsible for the facts and accuracy of the material presented. The contents do not necessarily reflect the official views of the Oregon Department of Transportation or the United States Department of Transportation. The State of Oregon and the United States Government do not endorse products of
manufacturers. Trademarks or manufacturers’ names appear herein only because they are considered essential to the object of this document.
EXECUTIVE SUMMARY
This Final Report documents a research effort to develop improved safety performance functions (SPFs) for signalized intersections in the State of Oregon. In particular, this research effort focused on the relationship between the physical characteristics of the signalized intersection, the crash history at each location, and the approach speed (represented by speed limit). In additional to developing SPFs for signalized intersection crash prediction for total crashes and severe injury crashes, the research also included an estimation procedure for minor road annual average daily traffic (AADT) values. The research team also re-assessed and ultimately developed a reliable procedure as to how to define an intersection-related crash.
Chapter 1 introduces the project and reviews the specific objectives of this research effort. Chapter 2 of this report includes a literature review summarizing the many known factors that influence crashes at signalized intersections as well as current estimation procedures for crashes and AADT values. Chapter 3 then presents an overview of the site selection and final sites selected for the SPF development and validation activities. Chapter 4 reviews the method developed for estimating minor road traffic volumes, and Chapter 5 similarly presents the analysis method and findings for defining intersection-related crashes and then developing SPFs for total and severe injury crashes. The report concludes with Chapter 6 (summary of findings), Chapter 7 (references), and Appendices A - D.
TABLE OF CONTENTS
1.0 EACH CHAPTER HEADING USES STYLE HEADING 1 ... 1
2.0 LITERATURE REVIEW ... 3
2.1 CALIBRATION OF HSM MODELS ... 3
2.2 DEPENDENT VARIABLES ... 4
2.2.1 Spatial Level of Aggregation ... 4
2.2.2 Crash Type ... 5 2.2.2.1 Angle Crashes ... 5 2.2.2.2 Left-Turning Crashes ... 6 2.2.2.3 Rear-End ... 6 2.2.2.4 Crash Severity ... 6 2.3 INFLUENCING FACTORS ... 7 2.3.1 Traffic Characteristics ... 7 2.3.1.1 Volume ... 8 2.3.1.2 Vehicle Type ... 8 2.3.1.3 Functional Classification ... 8
2.3.2 Traffic Control and Operational Features ... 8
2.3.2.1 Speed Limit ... 9
2.3.2.2 Lighting ... 10
2.3.2.3 Signal Head Visibility ... 11
2.3.2.4 Presence of Advanced Warning Signs ... 11
2.3.2.5 Traffic Signal Phasing ... 11
2.3.3 Geometric Characteristics ... 12 2.3.3.1 Approach Lane ... 12 2.3.3.2 Distance / Spatial... 13 2.3.3.3 Land Use ... 13 2.3.4 Other ... 14 2.3.4.1 Driver Characteristics ... 14 2.3.4.2 Environmental ... 14 2.4 MODELING TECHNIQUES ... 15 2.4.1 Negative Binomial ... 15 2.4.2 Probit ... 15
2.4.3 Generalized Additive Model ... 15
2.4.4 Generalized Estimating Equations ... 16
2.4.5 Logit ... 16
2.4.6 Multilevel ... 16
2.5 ESTIMATING MINOR VOLUMES ... 17
2.5.1 Travel Demand Modeling ... 17
2.5.2 Geospatial Methods ... 17
2.5.3 Regression Methods ... 17
2.5.3.1 Ordinary Least Squares ... 17
2.5.3.2 Geographically Weighted Regression ... 18
2.6 SUMMARY OF LITERATURE FINDINGS ... 18
3.0 DATA AND DATA COLLECTION ... 21
3.3 DATA COLLECTION FOR MINOR ROAD AADT ESTIMATION ... 33
4.0 ESTIMATING MINOR VOLUMES ... 35
4.1 DATA ... 35
4.1.1 Average Annual Daily Traffic ... 35
4.1.2 Functional Class ... 36
4.1.3 Land Use and Demographic ... 36
4.1.4 Network ... 36
4.2 MODELING APPROACH ... 37
4.3 RESULTS ... 39
4.3.1 Descriptive Statistics... 39
4.3.2 Models to Estimate Total Minor Entering Volume (AADT) ... 41
4.3.3 Models to Estimate Minor Volume by Leg ... 44
4.4 REVIEW OF AADT MODEL VALIDATION ... 47
4.5 SUMMARY ... 48
4.5.1 Sample Application ... 49
5.0 SAFETY ANALYSIS FOR SIGNALIZED INTERSECTIONS ... 51
5.1 MATCHING CRASHES AND INTERSECTIONS... 51
5.1.1 Investigating a Threshold for Distance from Intersection for Crash Classification in Oregon ... 51
5.2 METHODOLOGY ... 52
5.2.1 Manual Classification of Intersection Crashes ... 53
5.2.2 Manual Classification of Intersection Related Crashes ... 54
5.2.3 Statistical Analysis on Distance, Speed Limit and Max IFA for Intersection Crash Classification .... 56
5.2.3.1 Developing Screening Rules based on Statistical Models ... 57
5.2.4 Evaluation of Crash Screening Methods using the Validation Subset ... 58
5.2.4.1 Measures of Effectiveness ... 58
5.2.4.2 Classic Crash Screening Method Validation Analysis ... 59
5.2.4.3 Leave-One-Out Cross Validation Analysis ... 60
5.2.5 Summary of Evaluation of IR Screening Methods ... 62
5.3 SPF DEVELOPMENT ... 63
5.3.1 Statistical Methodology for Initial Model Development ... 63
5.3.1.1 Implications of Selected Statistical Methodology for Crash Prediction ... 64
5.3.1.2 Dataset Characteristics ... 65
5.3.2 Initial SPF for Total Crashes ... 68
5.3.3 Initial SPF for KAB Crashes ... 73
5.4 INITIAL PROBABILITY-BASED SEVERITY MODEL ... 78
5.5 SPF VALIDATION OVERVIEW ... 81
5.5.1 Temporal Transferability ... 82
5.5.2 Spatial Transferability ... 82
5.5.3 Spatial Temporal Transferability ... 83
5.6 DEVELOPING ENHANCED SPF MODELS ... 83
5.6.1 Characteristics of Assembled Dataset for Model Updates ... 83
5.6.2 Enhanced SPF for Total Crashes ... 84
5.6.2.1 Fit Assessment ... 85
5.6.3 Enhanced Probability-Based Severity Model ... 87
5.7 EXAMPLE PROBLEMS APPLYING SPFS ... 88
5.7.1 Example Use of Total Crash Model ... 88
5.7.2 Example Use of the Crash Severity Model ... 89
5.8 SUMMARY OF WORK ... 90
APPENDICES
APPENDIX A: SUPPLEMENTAL TABLES AND EXAMPLE DATA COLLECTION APPENDIX B: AADT CONVERSION METHODOLOGY
APPENDIX C: AADT MODEL VALIDATION
APPENDIX D: PREDICTIVE METHOD VALIDATION
APPENDIX E: INTERSECTION SITE INFORMATION (SEPARATE DOCUMENT APPENDIX F: VALIDATION SITE INFORMATION (SEPARATE DOCUMENT)
LIST OF TABLES
Table 3.1: Preliminary Random Sample of Intersections ... 22
Table 3.2: Region 1 Random Sample of Sites ... 24
Table 3.3: Region 2 Random Sample of Sites ... 25
Table 3.4: Region 3 Random Sample of Sites ... 25
Table 3.5: Region 4 Random Sample of Sites ... 26
Table 3.6: Region 5 Random Sample of Sites ... 26
Table 3.7: Region 1 Validation Sites ... 27
Table 3.8: Region 2 Validation of Sites ... 27
Table 3.9: Region 3 Validation Sites ... 28
Table 3.10: Region 4 Validation Sites ... 28
Table 3.11: Region 5 Validation Sites ... 28
Table 3.12: Site Data and Corresponding Collection Method ... 29
Table 3.13: Location and Geometric Configuration for Intersection #1 ... 31
Table 3.14: Lane Geometry – Intersection #1 ... 32
Table 4.1: Types of Intersection Approaches Minor Volume Models ... 40
Table 4.2: Descriptive Statistics for Minor Volume Models ... 40
Table 4.3: Summary of Categorical Variables for Minor Volume Models ... 41
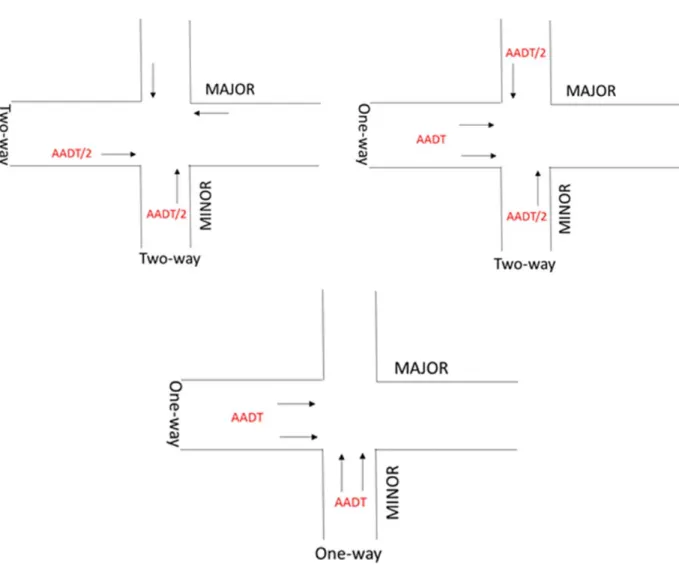
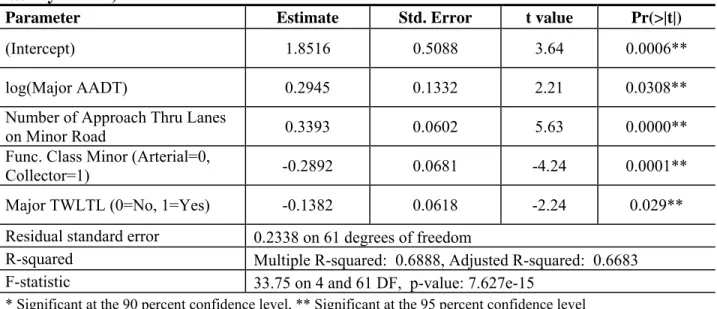
Table 4.4: Model Outputs for Total Minor Entering Volume, Two-way Major and Minor Roads (with Parallel Facility) ... 42
Table 4.5: Model Outputs Total Minor Entering Volume, Two-way Major and Minor Roads (without Parallel Facility) ... 43
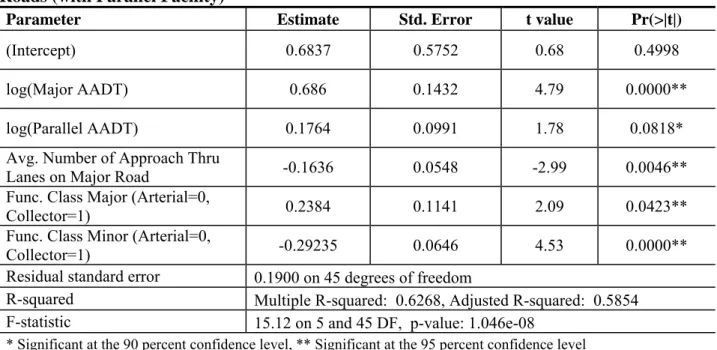
Table 4.6: Model Outputs for Minor Volume Estimation Model By Leg (with Parallel Facility AADT) ... 45
Table 4.7: Model Outputs for Minor Volume Estimation Model By Leg (without Parallel Facility AADT) ... 46
Table 5.1: Predictors included in Probability Models Developed ... 57
Table 5.2: Performance of Screening Methods on Validation Data ... 59
Table 5.3: Performance of Screening Methods using LOOCV ... 61
Table 5.4: Yearly Statistics for Complete Intersection-year Data. Years 2010-2012 ... 66
Table 5.5: Analysis of Deviance for Full and Reduced Models ... 69
Table 5.6: Coefficient Estimates for Reduced Model ... 69
Table 5.7: Analysis of Deviance for Full and Reduced Models ... 74
Table 5.8: AIC, BIC, LogLikelihood and Deviance Comparisons for Mod3 and Mod4 ... 75
Table 5.9: Coefficient Estimates for Recommended KAB SPF ... 75
Table 5.10: Analysis of Deviance for Parsimonious and Extended Models ... 78
Table 5.11: Coefficient Estimates for Initial Probability-Based Severity Model ... 79
LIST OF FIGURES
Figure 3.1: Stratified Random Sample (50 Intersections) ... 23
Figure 3.2: Validation Stratified Random Sample (35 Intersections) ... 27
Figure 3.3: Data Collection Form Photos ... 30
Figure 4.1: Example Parallel Facility AADT ... 36
Figure 4.2: Sample Images Showing GIS Network Information ... 37
Figure 4.3: Adjusted AADT for Use in the Volume by Leg Models ... 39
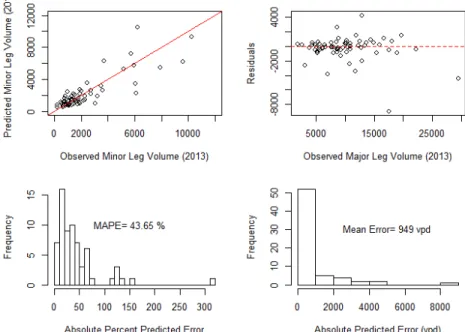
Figure 4.4: Diagnostic Plots for Total Minor Entering Volume (with Parallel Facility AADT) ... 44
Figure 4.5: Diagnostic Plots for Total Minor Entering Volume (without Parallel Facility AADT) ... 44
Figure 4.6: Summary Diagnostic Plots for Minor Volume Estimate by Leg (with Parallel Facility AADT) ... 47
Figure 4.7: Summary Diagnostic Plots for Minor Volume Estimate by Leg (without Parallel Facility AADT) ... 47
Figure 5.1: Sample Sites with Buffers at Various Radii ... 52
Figure 5.2: Sample Sites of various IFA Radii ... 53
Figure 5.3: Sample Site at Low Speed Limit Urban Area ... 54
Figure 5.4: Probability curves from DS mod (left) and SL mod (right) ... 57
Figure 5.5: Performance Comparison of Screening Methods ... 62
Figure 5.6: Correlations Among Variables in Complete Dataset ... 67
Figure 5.7: Scatter Plot of ln(KAB Crashes) and Critical Variables in the Complete Dataset ... 68
Figure 5.8: Q-Q Plot of Intersection Random Effect ... 70
Figure 5.9: Marginal Distribution Fit of Model Parameters Specific to Modeling Data ... 71
Figure 5.10: Marginal Distribution Fit of Model Parameters Projected to the Population ... 71
Figure 5.11: Marginal Distribution of Data and the Two Fits of Proposed SPF ... 72
Figure 5.12: CURE Plots for Major and Minor AADTs ... 73
Figure 5.13: Q-Q Plot of Intersection Random Effect in KAB Model ... 76
Figure 5.14: Marginal Distribution Fit of KAB SPF to Data and Population Projection ... 77
Figure 5.15: CURE Plots for Major SpLim and ModAADT ... 77
Figure 5.16: KAB Proportion of Crashes vs. Severity Model Prediction by Minor AADT ... 80
Figure 5.17: Severity Model Prediction vs Major AADT ... 81
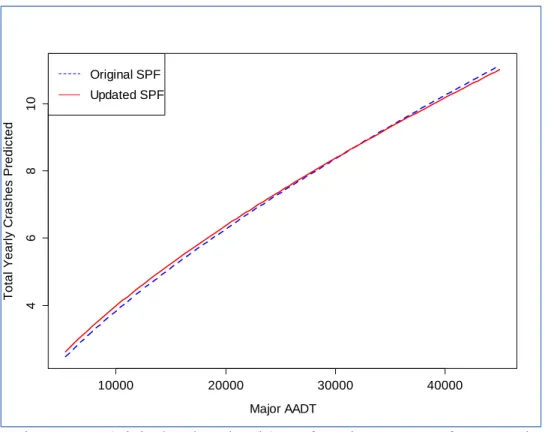
Figure 5.18: Original and Updated SPFs for Minor AADT of 7,000 vpd ... 85
Figure 5.19: Q-Q Plot of Intersection Random Effect in Updated Model ... 86
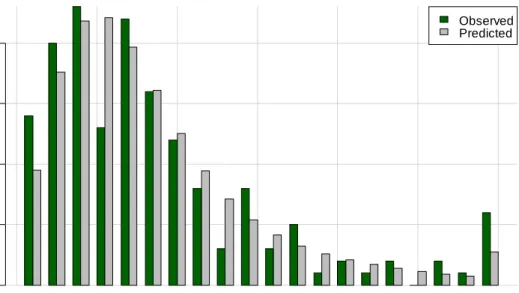
Figure 5.20: Theoretical and Observed Marginal Distributions of Sites by Total Crash Frequencies for Period 2010-2013 ... 86
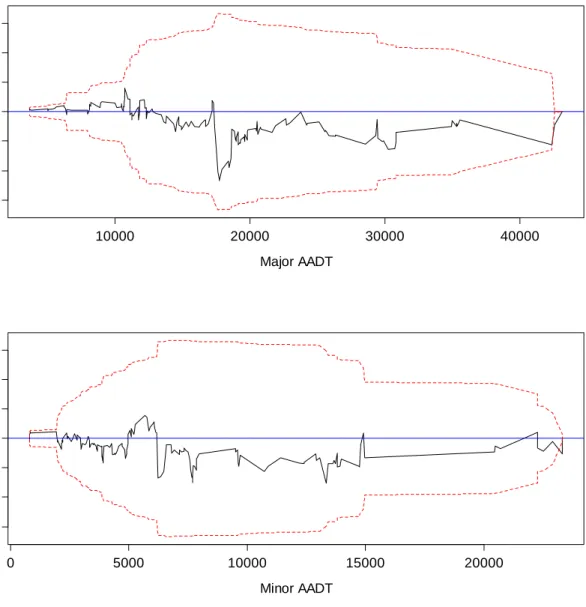
Figure 5.21: CURE Plots for Updated Total Crashes SPF ... 87
1.0
EACH CHAPTER HEADING USES STYLE HEADING 1
The effective identification, prioritization, and application of safety treatments will each require an understanding of the complex interaction between the elements of roadway design,infrastructure, and traffic. This is particularly true in an environment of limited funding, since large scale improvements will be increasingly difficult to implement and lower cost targeted solutions will be more common. Techniques available in the American Association of Highway and Transportation Officials (AASHTO) Highway Safety Manual (HSM) are helping the Oregon Department of Transportation (ODOT) staff complete the analysis needed to identify solutions suitable to address the causes of crashes. Due to the high percentage of crashes occurring at signalized intersections, considerable attention is required for the effective selection of
improvement strategies that will result in the greatest reduction in crashes for dollars invested at these critical locations. ODOT has been researching the data needs and implementing the HSM within current procedures when possible but has identified limitations that affect the reliability of the results when the study site is a signalized intersection.
The HSM includes Safety Performance Functions (SPFs) to assess options for improving the safety of intersections. These are statistically-derived equations that use traffic volumes and other factors to predict crash reductions for various types of improvements. Since the SPFs do not allow for certain features such as turn lanes and lane widths, Crash Modification Factors (CMFs) can then be used to adjust the results of the equations to address these factors. Currently the available safety assessment SPF tools do not explicitly include consideration of approach speeds, yet it is widely accepted that speed affects both the frequency and the severity of crashes. The initial predictive models upon which the HSM procedure is based focused on rural two-lane highways and the approach speed at those intersections was not deemed to be significant. This foundation work then was used to define the SPF format for future models for the first edition of the HSM, so speed was excluded as a critical input variable in subsequent studies where SPFs were developed for other types of facilities.
The question of including speed in the SPF process is frequently raised by the engineering community. The research effort summarized in this Final Report focuses on determining the safety impact of different speed limits at signalized intersections in Oregon.
The research includes three key efforts:
Estimating minor road traffic volumes at signalized intersections (see Chapter 4), Determining if a crash should be identified as intersection-related (see Chapter 5),
The overall objective of this research effort, therefore, is to develop more reliable ways to assess signalized intersection safety in Oregon so that ODOT and other agencies can allocate funding resources towards effective intersection safety configurations for both new and existing facilities. This Final Report summarizes the models developed for this purpose. Chapter 2.0 of this report presents a brief literature review. Chapter 3.0 next addresses the site selection and data collection sampling effort. Chapter 4.0 reviews the minor road AADT estimation analysis. Chapter 5.0 then presents the intersection-related crash evaluation followed by the SPF development. Chapter 6.0 then summarized the findings. Finally, cited references are summarized in Chapter 7.0. The report appendices (Chapters 8.0 through 13.0) include a list of abbreviations used in this report, the key for the data collection form, a review of AADT conversion methodology, an overview of the AADT model validation, a similar overview of the SPF validation, the detailed site
information for the 50 study sites identified for initial SPF development, and the detailed site information for the 35 study sites used for model validation activities.
2.0
LITERATURE REVIEW
A variety of methods have been used to estimate crash frequency at signalized intersections. Most notably, the HSM (AASHTO 2010) provides SPFs derived from negative binomial regression that, once calibrated for local conditions, can be used in any jurisdiction. The first edition of the HSM included four types of signalized intersection SPFs:
Rural Two-Lane Four-Legged Signalized Intersections (R4SG2), Rural Multi-Lane Highway Signalized Intersections (R4SG4),
Urban/Suburban Arterial Three-Legged Signalized Intersections (U3SG), and Urban/Suburban Arterial Four-Legged Signalized Intersections (U4SG).
Each of the HSM signalized intersection SPFs is associated with a set of defined base conditions. Any features that differ from these established base conditions must be considered explicitly through the application of multiplicative CMFs. The R4SG2 models have base conditions that assume no lighting, skew of zero degrees, and no left and right turn lanes that are not stop-controlled. The U3SG and U4SG intersections have base conditions that assume no left-turn lane, no right-turn lane, permissive left turn phase, right turn permitted on red, and no lighting. The R4SG4 does not have specified base conditions. The HSM base condition SPFs are based on data from multiple states and for similar intersections.
The purpose of this literature review is to identify the key decision and predictor variables for generation of jurisdiction specific SPFs for ODOT. A prior report (SPR 667) studied the safety performance of Oregon’s intersections (Monsere et al. 2011). This report included a thorough review of relevant work published prior to 2005. This literature review, therefore, focuses on any research related to intersection safety performance modeling or safety effect estimation published since 2005. The review is organized around the modeling framework. The first section reviews other efforts to calibrate the HSM models. The second section review the various
approaches used to establish candidate dependent variables. This review is then followed by a summary of influencing variables that have been included in the models or analysis. Finally, the review identifies the various statistical approaches that have been used for these studies.
were developed using volume and road characteristics as predictors for total collisions, fatal/injury collisions, and property damage only collisions occurring in 2005 through 2009. Comparison of the calibrated HSM SPFs and the jurisdiction specific SPFs suggested that calibrated HSM SPFs under predicted the crashes for Regina.
Garber et al. (Garber et al. 2010) used negative binomial models to calibrate SPFs developed using Ohio data for the Virginia Department of Transportation. The jurisdiction specific SPFs predicted crash frequency better than the Ohio data generated functions used in the
AASHTOWare software program SafetyAnalyst.
Dixon et al. (Dixon et al. 2012) calibrated the HSM SPFs for both segments and intersections based on the HSM calibration procedures. The authors concluded that the use of severity-based calibration factors were more appropriate due to the current crash reporting procedures in
Oregon. Also, the calibration factor for urban four-lane divided facilities should not be used due to the small available sample size of this type of road segment in Oregon. For SPFs that use proportional adjustments for crash severity and unique CMFs, the Oregon researchers also recommended using locally computed proportions rather than the HSM default values.
2.2
DEPENDENT VARIABLES
The development of SPFs often requires that total crashes be modeled due to sample size issues; however, the literature and practice suggest that improved safety performance models may be feasible if models for specific crash types can be estimated. At intersections, multi-vehicle crashes are the most common crash types (e.g. rear-end and angle crashes) that might merit unique sub-models. The models in the HSM urban and suburban chapter model multiple and single vehicle crashes separately. In the HSM approach, severity and collision-type are estimated with proportioning factors that convert the frequency predictions into severity or collision-type predictions. For modeling purposes, the dependent variable is some form of crash frequency. The majority of studies reviewed total crashes, crash type, and/or crash severity.
2.2.1
Spatial Level of Aggregation
Crash prediction models are typically based on crashes that have been grouped to a common spatial unit (e.g. intersection or approach leg). In the studies reviewed, grouping crashes by intersection helped researchers to capture the influences of various intersection features (Miller et al. 2011; Jonsson et al. 2007; Abdel-Aty and Haleem 2011; Wang and Abdel-Aty 2006; Wang and Abdel-Aty 2007; Wang and Abdel-Aty 2008; Kim and Washington 2006; Yan et al. 2005; Chen et al. 2012a; Mitra and Washington 2012; Qi et al. 2013; Chen et al. 2012b; Yan et al. 2008; Davis and Aul 2007; Souleyrette et al. 2007; Li and Tarko 2011; Bullough et al. 2013; Das and Abdel-Aty 2008; Wang et al. 2008; Li and Lee 2011). Researchers studying advanced warning, speed limit reductions, lane width, and signal visibility used intersection approach as a way of grouping crashes (Potts et al. 2013; Potts et al. 2007; Sayed et al. 2008; Wu et al. 2013; Sharma et al. 2012; Appiah et al. 2011). Two studies involving segments were reviewed: Stephan and Newstead (Stephan and Newstead 2012) studied the natural and built environment along signalized urban arterials and Ma et al. (Ma et al. 2010) examined the severity of crashes along rural two-lane highways. Finally, Wang and Abdel-Aty
2.2.2
Crash Type
Miller et al. (Miller et al. 2011) explored crash causality at intersections using a disaggregated approach to crash prediction. In the study, the researchers used six years of crash data (2000-2005) to mine patterns at 72,218 crashes at more than 6,000 signalized and unsignalized intersections in Virginia. Vehicle speed, driver action, alignment, lighting, weather, traffic control, driver visibility obstruction, volume, shoulder width, and surface conditions were identified as important crash factors in 25 of 51 classification trees. The researchers also generated negative binomial generalized linear models to investigate total crashes, injury crashes, rear-end crashes, and angle crashes concluding that disaggregating by crash type was generally more accurate when compared to models generated using total crashes.
Jonsson et al. (Jonsson et al. 2007) estimated crash prediction models to investigate the effects of traffic and geometry on four different crashes types in rural California: opposite direction, same direction, intersecting (angle), and single-vehicle. Traffic characteristics, geometric features, and crash data from 1993-2002 for 264 four-leg controlled intersections and 378 three-leg stop-controlled intersections resulting in 2,676 crashes were modeled with negative binomial
regression. As a result of the modeling effort, the researchers found that when prediction models are categorized by the defined crash-types, they will have different significant variables for both three-leg intersections and four-leg intersections.
2.2.2.1Angle Crashes
Abdel-Aty and Haleem (Abdel-Aty and Haleem 2011) compared multinomial adaptive regression splines (MARS) and negative binomial regression techniques to estimate angle crash frequency at 2,475 three- and four-legged unsignalized intersections located in six different counties in Florida. The researchers found that significant predictors of angle crashes included the major traffic volume, distance to nearest upstream signal, distance to nearest intersection, median type, percentage of heavy vehicles, size of intersection, and geographic location. In prior work, Wang and Abdel-Aty (Wang and Abdel-Aty 2007) investigated collisions involving two through movement vehicles conflicting at a right-angle. They evaluated a total of 197 signalized intersections located in central Florida and used generalized estimating equations to account for site correlation. The research determined that significant predictors of right-angle crashes were the product of through volumes, number of through lanes, and late night and early morning traffic signal
flashing-mode operations. The research also identified speed limit, skew, yellow and all-red intervals, and the presence of left-turn bay offset as significant pall-redictors of right-angle crashes.
Kim and Washington (Kim and Washington 2006) used a limited-information maximum likelihood estimation approach to account for endogeneity between left-turn lanes and angle crashes using data collected at 155 rural intersections in 38 counties of Georgia. A
2.2.2.2Left-Turning Crashes
Wang and Abdel-Aty (Wang and Abdel-Aty 2008) investigated left-turn crash frequency at 197 four-legged signalized intersections located in Orange and Hillsborough counties in Florida. The researchers assembled and modeled crash data (2000-2005), traffic data, and intersection characteristics in an effort to evaluate the causality of left-turn crashes. The modeling effort for left-turn crash occurrence by pattern type consistently indicated that crash occurrence was related to entering flows of the colliding vehicles, and not the total entering volume at the intersection. Wang and Adbel-Aty determined that for four of the nine crash patterns approach speed limit was a significant predictor of left-turn crash occurrence.
Yan and Radwan (Yan and Radwan 2008) studied 72,912 crashes that occurred during the years 1999 through 2001 in Florida to identify crash risk associated with unprotected left-turn crashes at signalized intersections using logistic regression. Results indicated that type of vehicle (excluding van) and driver age (under the age of 65) had negative effects. Driver-related factors, non-local versus local, driver age (greater than 65 compared to less than 18), alcohol, physical defect, and gender had positive effects on crashes.
2.2.2.3Rear-End
Wang and Abdel-Aty (Wang and Abdel-Aty 2006) used generalized estimating equations (GEE) with a negative binomial link function to investigate the temporal and spatial relationships of rear-end crashes. The Florida researchers collected geometric, traffic exposure, traffic control, and crash data at 208 signalized intersections for the time period of 2001-2003. They performed spatial analysis by grouping 476 intersections along 41 corridors based on density in central Florida and modeling total rear-end crashes from 1999 and 2000. The analysis identified traffic volume, number of turn lanes, number of phases per cycle, speed limits, and higher population areas as items significantly correlated with rear-end crash frequencies.
Yan et al. (Yan et al. 2005) investigated the relationship of rear-end crashes at signalized intersections using multiple logistic regression. Their analysis of 7666 rear-end crashes suggested significant relationships between rear-end crashes and road environmental factors, as well as vehicle type, driver age, driver residence, and gender for both the struck vehicle role and the striking vehicle role. Additionally, they found that driver factors such as alcohol or drug use were significant.
2.2.2.4Crash Severity
Crash severity can be modeled by separate models that estimate frequency (such as in the HSM approaches for some models). In other modeling approaches, the risk factors can be explored using logistic approaches. Savolainen et al. (Savolainen et al. 2011) reviewed 133 previous research efforts describing logit, probit, neural networks, and classification trees used to model crash severity. In their review, the authors concluded that
endogeneity, underreporting, and the correlation effects of multiple injuries within the same crash or within a small period of time are concerns in modeling severity.
In models particular to intersections, Chen et al. (Chen et al. 2012a) used logistic
regression to study severity of injuries to vehicle occupants and intersection crashes using nine years of crash data (n=12,144 crashes) from Victoria, Australia. Chen et al.
identified seven significant independent variables for the prediction of crash severity: driver gender, driver age, speed zone, traffic control, time of day, crash type, and seat belt usage. Sayed et al. (Sayed et al. 2008) conducted a before-and-after study investigating the safety impacts of improved signal visibility at 175 four-legged signalized
intersections. The study sites each had an approach speed of approximately 30 miles per hour (mph) (50 kilometers per hour (kph)). Visibility improvements included increasing the signal lens size, new backboards, addition of reflective tape, and providing additional signal heads. They then used five generalized linear models to predict crash severity based on major and minor average annual daily traffic (AADT). Signal visibility did not have a significant effect on combined fatal and injury crashes. Property Damage Only (PDO), daytime, nighttime, and total collisions each experienced significant decreases in crash frequency.
Anastasopoulos and Mannering (Anastasopoulos and Mannering 2011) compared the use of random parameter logit models with fixed parameter logit models. They predicted crash severity using geometrics, traffic characteristics, socioeconomics, and collision characteristics. The fixed parameters model performed better in predicting crash severity than the random parameters models, though the random parameters predicted within five percent of the fixed parameters.
Finally, Ye and Lord (Ye and Lord 2011) modeled crash severity using multinomial logit (MNL), mixed logit (ML), and ordered probit methodologies to compare the effects of underreporting. Ye and Lord used simulated crash data and the Monte Carlo approach for four years (1998-2001) of observed crashes (26,175 usable records). Results indicated that underreporting occurred in all three model methodologies. The authors recommended using fatalities as the baseline for MNL and ML models, while the ordered probit model should use a descending order from fatal to PDO.
2.3
INFLUENCING FACTORS
The research team reviewed the published literature and identified several safety performance factors to consider. These items include traffic characteristics, traffic control and operational features, geometric characteristics, and select other factors. These items are reviewed in the following sections.
2.3.1.1Volume
A large body of work confirmed a positive relationship between increasing traffic volume and crashes. Specifically related to intersection research, major and minor volumes were most often used as separate independent variables (Li and Lee 2011; Bullough et al. 2013; Davis and Aul 2007; Appiah et al. 2011; Sayed et al. 2008; Jonsson et al. 2007; Kim and Washington 2006; Wang and Abdel-Aty 2006). Other studies included the major volumes or entering volumes only (Abdel-Aty and Haleem 2011; Wang and Abdel-Aty 2007; Wang and Abdel-Aty 2008; Stephan and Newstead 2012; Potts et al. 2007; Sharma et al. 2012; Souleyrette et al. 2007; Li and Tarko 2011; Wang et al. 2008). Several studies that only examined crashes in approach lanes or where crashes were due to turning movements included turning movement counts in the models (Wang et al. 2008; Wu et al. 2013; Potts et al. 2013).
2.3.1.2Vehicle Type
Yan et al. (Yan et al. 2005) used logistic regression to contrast heavy vehicles, light trucks, and vans to the reference category of cars. They observed that all three larger vehicle types were more likely to be involved in rear-end crashes than the more prevalent passenger car. Abdel-Aty and Haleem (Abdel-Aty and Haleem 2011) found that angle crash frequency was predicted to increase with an increase in heavy vehicle traffic. Similarly, Sharma et al. (Sharma et al. 2012) and Wu et al. (Wu et al. 2013) found a positive relationship between heavy vehicles and crash frequency. However, Bullough et al. (Bullough et al. 2013) found that an increase in the percentage of heavy vehicles during daylight hours had a negative effect on crash frequency as did an increase during the nighttime hours.
2.3.1.3Functional Classification
Miller et al. (Miller et al. 2011) compared crash experience based on road functional classification for arterials and roads that were not arterial. The researchers identified a significant positive relationship between principal arterials and total crashes, injury crashes, and angle crashes. Stephan and Newstead (Stephan and Newstead 2012) studied the effects of urban natural and built environments on segment crashes finding that principal arterials were more likely to have a crash than non-principal arterials. Ma et al. (Ma et al. 2010) used multivariate Poisson lognormal methods to expose a positive relationship for collectors on possible injuries, non-disabling injuries, disabling injuries, and fatalities. In comparison, minor arterials were found to have smaller positive effects on crash severity.
2.3.2
Traffic Control and Operational Features
Traffic control and operational features, as identified in the published literature, that have been determined to influence safety performance include speed, lighting, signal head visibility, presence of advanced warning signs, and traffic signal phasing.
2.3.2.1Speed Limit
Speed is an important descriptor of traffic operations that has an effect on crash severity and frequency but this variable is difficult to accurately capture in aggregate models. In particular, the exact speed of the crash involved vehicle is rarely known with certainty. To attempt to capture speed effects, most researchers have used posted speed by
approach. Mitra and Washington (Mitra and Washington 2012) studied 15,245 crashes occurring at 291 intersections in Tuscon, Arizona between 2001 and 2004. Spatial proximity to schools and drinking establishments, weather, and demographic data were used to explore the relationship between crashes and these often omitted variables in crash prediction models. They found that higher posted speed along the minor approach had an increasing effect on crash frequency. Conversely, Mitra and Washington
observed that elevated major road speeds had a significant negative relationship with crash frequency. The authors suggest that tandem effects are likely due to differences between actual and posted speeds, as well as the effects of different design standards of facilities associated with posted speeds.
Das and Abdel-Aty (Das and Abel-Aty 2008) developed models by aggregating crashes by varying the intersection influence area by 50 feet intervals. They determined that speed limit had a positive relationship with crash severity at all modeled influence areas. Yan and Radwan (Yan and Radwan 2008) found left-turn crash occurrence was highest at intersections with a posted speed limit of 45 mph when compared to other speed limits. Davis and Aul (Davis and Aul 2007) concluded that signalized intersections converted from stop-controlled intersections with approach speeds greater than 40 mph experienced a significant increase in rear-end crashes, and a decrease in right-angle crashes.
Souleyrette et al. (Souleyrette et al. 2007) found that implementation of all-red intervals did not have a significant increase in safety benefit for signalized intersections with an approach speed of 30 mph or greater.
Using multivariate Poisson-lognormal techniques, Ma et al. (Ma et al. 2010) found that an increase in the posted speed limit of 10 mph would result in an increase in fatal and disabling-injury types. Intuitively, PDO crashes were found to decrease suggesting an overall increase in severity with an increase of intersection speed.
Abdel-Aty and Haleem (Abdel-Aty and Haleem 2011) included a predictor in the MARS analysis of three-leg and four-leg unsignalized intersections categorizing speed limit as equal to or greater than 45 mph or less than 45 mph. Results indicated that at three-leg intersections speed limits of 45 mph or greater were more likely to result in angle crashes. Wang and Abdel-Aty (Wang and Abdel-Aty 2007) found that an increase in speed limit has an insignificant positive relationship with right-angle crashes. In further work, Wang and Abdel-Aty (Wang and Abdel-Aty 2008) found that speed limit was a significant
likelihood at posted speed limits from 35 mph to 55 mph than intersections with a posted speed limit of 25 mph.
Sharma et al. (Sharma et al. 2012) studied the effect of speed limit reductions in the vicinity of 28 high-speed signalized Nebraska intersections equipped with advanced warning flashers to understand the safety impacts of five and ten mph speed limit
reductions. Quantile regression analysis indicated that a signed 15 mph reduction was not statistically significant. A five mph posted reduction was not statistically significant in reducing crash severity, but was found to have significant decreasing effect of 0.6 crashes per approach.
Wu et al. (Wu et al. 2013) investigated the safety impacts of implemented speed
reductions with advanced flashers on approach to signalized intersections located on 56 major approaches. Nested-logit models were developed using ten years of crash data from 2001 through 2010. Contradictory results were found with a posted static speed reduction on the intersection approach of five mph. Results indicated that the smaller reduction decreased the probability of visible injury, but increased the probability of no injury, possible injury, incapacitating injuries, and fatalities. Reductions of ten mph significantly increased the probability of no injury.
Finally, El-Shawarby et al. (El-Shawarby et al. 2011) studied driver running behavior of yellow and red phases at high-speed intersections. Male drivers were observed to be less likely to proceed at the onset of the yellow phase when compared to female drivers. Also, drivers aged 60 years or older were significantly less likely to clear the intersection with shorter detection distances.
2.3.2.2Lighting
Bullough et al. (Bullough et al. 2013) studied the safety effects of lighting at 5,578 unsignalized and 886 signalized intersections in Pennsylvania. The expected crashes per year for daytime and nighttime were calculated using a negative binomial model with independent categorical variables of signalization, land-use, lighting, skew, speed, access control, depressed median, and paved-left shoulder. Lighting was found to have a
negative relationship to crash frequency, but it was observed that daytime crash frequency increased by five to eight percent. The authors suggest this is due to the presence of light poles near the intersection. Similar results were found by Shankar et al. (Shankar et al. 2010) who used negative binomial models to predict crash frequency with crash data from Minnesota and California at signalized and unsignalized intersections. Results suggest that the presence of lighting had a decreasing effect on crashes for both urban/suburban and rural signalized intersections.
In similar, sometimes parallel, research authors controlled for day and night conditions finding a lower likelihood of crashes at intersections in daylight conditions (Yan and Radwan 2008; Das and Abdel-Aty 2008). Other reviewed studies considered only the presence of lighting, and found that lighting had a negative relationship with crash occurrence (Yan and Radwan 2008; Souleyrette et al. 2007; Jonsson et al. 2007).
2.3.2.3Signal Head Visibility
Souleyrette et al. (Souleyrette et al. 2007) found a positive relationship between total crashes and all configurations other than overhead signals in one direction in a study of the safety impacts of all-red intervals at low speed, urban intersections. Sayed et al. (Sayed et al. 2008) conducted a before-and-after study investigating the safety impacts of improved signal visibility at 175 four-legged signalized intersections with an approach speed of approximately 30 mph (50 kph). Visibility improvements included increasing the signal lens size, new backboards, addition of reflective tape, and providing additional signal heads. Five generalized linear models were used to predict crash severity using major and minor AADT. Signal visibility did not have a significant effect on combined fatal and injury crashes. PDO, daytime, nighttime, and total collisions were all found to have significant decreases in crash frequency.
2.3.2.4Presence of Advanced Warning Signs
Appiah et al. (Appiah et al. 2011) studied the behavior of drivers approaching dilemma zones at intersections with actuated advanced warning system to determine if the system promotes decreases in crash rates over time. The study included 26 system implemented intersections compared to 29 control intersections in Nebraska. The researchers used Bayesian techniques in a before-after study of crash frequency at the high-speed
intersections. The application of the advanced warning system suggested an improvement in safety, especially in right-angle crashes which experienced a 43.6 percent reduction in occurrence at the implemented intersections. In similar research, Wu et al. (Wu et al. 2013) addressed the safety impacts at signalized intersections equipped with advanced warning flashers and speed reductions finding that flashing time of the warning signs was not significant in predicting crashes.
2.3.2.5Traffic Signal Phasing
Various crash prediction studies have included traffic signal phasing and phasing
components. Mitra and Washington (Mitra and Washington 2012) found that the number of signal phases at an intersection have a positive relationship with total intersection crashes. Three of the studies addressed or included left-turn phases. Chen et al. (Chen et al. 2012b) conducted a before and after study investigating the safety impacts of
changing permissive left-turn signal phasing to protective at 68 signalized intersections using negative binomial regression with the GEE technique. Chen et al. determined that no significant decreases in crashes occurred when left-turn phasing was changed to protected/permissive left-turn phasing as compared to permissive-only signal phasing. Davis and Aul (Davis and Aul 2007) studied the safety impacts of different left-turn phases at two major approaches and four minor approaches with an approach speed greater than 40 mph and concluded that a changing of the left-turn phase from
Souleyrette et al. (Souleyrette et al. 2007) explored the safety impacts of all-red intervals on 104 signalized intersections in Minneapolis, Minnesota. The study intersections had an approach speed of 30 mph. They used a generalized linear mixed model to predict crash frequency. Results of the model found no safety benefit with the overall use of all-red intervals but safety benefits were observed at individual sites. Li and Tarko (Li and Tarko 2011) developed multinomial logit models to estimate probability of crashes at signalized intersections along corridors with coordinated phases. Three coordinated systems (encompassing 18 intersections that experienced a total of 1,345 crashes between 2003 and 2006 in Indiana) were the focus of the evaluation. Higher concentrations of arrivals in the first half of the red phase, in the presence of short yellow intervals, and within the first two seconds of green were associated with an increase in the likelihood of rear-end and right-angle crashes. Additionally, variables based on the maximum green were significant for the second-half of green phase arrivals, first half of red phase
arrivals, and traffic for the first two seconds of the green phase while no minimum green phase, or mid-point variables were significant allowing the authors to postulate that signals that reach the force-off may be related to an increase in the likelihood of crashes. Also, right angle crashes are more likely to occur at the beginning of the red phase. Wang et al. (Wang et al. 2008) found that signal coordination also had a positive effect on crashes when modeled at a fixed influence zone of 250 feet and then at a varied influence distance determined by intersection features and furthest crash distance. Finally, Wang and Abdel-Aty (Wang and Abdel-Aty2008) found that late night and early morning yellow flashing operations had a positive effect on right angle crashes.
2.3.3
Geometric Characteristics
Geometric characteristics that influence safety performance include the approach lane features, the intersection influence areas, and the adjacent land use.
2.3.3.1Approach Lane
Potts et al. (Potts et al. 2013) studied 400 intersection approaches in Toronto, Canada evaluating the safety of the channelized right-turn lanes, shared through/right-turn, and conventional right-turn lanes. The research results suggested that all right-turn treatment types exhibited similar safety performance. As part of a larger study, Potts et al. (Potts et al. 2007) studied the safety impact of lane widths on arterial intersection approaches in Minnesota (707 intersections) and North Carolina (635 intersections). They designed a cross-sectional modeling approach using average daily traffic (ADT) and lane width to develop negative binomial models. Results indicated that increasing lane width had a significant negative effect on fatal-injury single and multiple vehicle crashes for three-legged signalized intersections.
Jonsonn et al. (Jonsonn et al. 2007) found that left-turn channelization and number of lanes were significant variables in models predicting same direction crashes for four-leg intersections. Other research controlled for number of lanes as a continuous variable and found that the likelihood of crashes increases with an increase in the number of lanes
In another approach, Wang and Abdel-Aty (Wang and Abdel-Aty 2007) grouped lanes into four different subsets: two and three lanes; four and five lanes; six lanes; and seven, eight, and nine lanes. They observed a negative relationship with right-angle crash occurrence with an increase in the number of lanes. Yan et al. (Yan et al. 2005) also found a negative relationship between roadways with an increasing number of lanes and rear-end crashes. Qi et al. (Qi et al. 2013) investigated a total of 235 crashes at 21
intersections with and without turn lane queue overflow problems in Houston and Austin, Texas. Crash rates at intersections were predicted using negative binomial models. Results indicated that intersections with turn lane queue overflow problems had 35 percent higher predicted rear-end crash rates than intersections without overflow problems. Simulation-based analysis reflected that extension of left-turn lanes would have resulted in a decrease in rear-end crash occurrence.
2.3.3.2Distance / Spatial
Das and Abdel-Aty (Das and Abdel-Aty 2008) used influence areas varying from zero to 200 feet to study the impacts of surface, weather, and traffic conditions on crash severity. Results suggested that the magnitude of effect on crash severity increased with an
increased influence area for roadway width and median width.
Wang et al. (Wang et al. 2008) studied 177 signalized intersections in Florida with the objective of investigating the safety influence area for four-legged intersections. The study intersections had 7,758 observed crashes over a period of 2000-2005. The authors concluded that the influence area varies depending on intersection features (i.e. length of left-turn lane, speed limit, etc.) thus all features should be taken into consideration when determining the influence distance at the intersection. Li and Lee (Li and Lee 2011) used geographically-weighted regression models to estimate crash severity at urban
intersections in Chicago, Illinois. The models incorporated spatial distribution of the intersections by assigning higher weights to decreasing distances between intersections. Li and Lee tested the geographically weighted regression (GWR) models assuming lognormal and negative binomial distributions against global models concluding that GWR models (lognormal) better predict crash severity.
2.3.3.3Land Use
Stephan and Newstead (Stephan and Newstead 2012) studied 141 road segments near strip shopping malls in the Melbourne, Australia metropolitan area to investigate the impacts of complex urban environments on safety. They developed crash prediction models to study the relationship between total number of crashes and segment
characteristics. Results indicated that increasing complexity (measured as traffic density, number of lanes, and higher access densities) had a positive relationship with increased crash risk, defined by the total crashes within each segment. Reduced crash risk was
severity. They observed that crashes on sharper horizontal curves were more likely to result in severe crashes, and increased shoulder widths were more likely to result in less severe crashes. The authors suggested that less complex road designs tend to decrease crash severity.
2.3.4
Other
In addition to the built environment, researchers have studied a variety of other items including driver demographics, socioeconomic characteristics, and the natural environment.
2.3.4.1Driver Characteristics
Chen et al. (Chen et al. 2012a) found that male drivers and lack of seat belt usage were more likely to be involved in fatal crashes in a study of risk factors associated with crash severity at signalized intersections. The research also indicated that drivers age 65 years or older were more likely to be involved in fatal crashes than younger drivers. Yan et al. (Yan et al. 2008) found that crashes involving male drivers were less likely to be involved in left-turn crashes. The researchers also found that ages 56-65 were less likely to be involved in a left-turn crash compared to drivers less than 18 years of age, but less of a decrease in likelihood when compared to drivers of ages 18-55. Drivers 66 years of age or older were more likely than drivers less than 18 years of age of being involved in left-turn crashes.
Wu et al. (Wu et al. 2013) used a nested logit model to examine safety impacts of
dynamic warning message signs at high-speed signalized intersections. Severity level was described by four variables in the upper nest; no injury, lower intermediate injury,
incapacitating injury, and fatal injury. The lower nest further defined ‘lower intermediate injury’ as possible injury and visible injury. Crashes involving at-fault male drivers were less likely to result in crash severity level of lower intermediate injury, specifically visible injury. Additionally, alcohol was found to have a higher likelihood of
incapacitating injury and fatal injury. Das and Abdel-Aty (Das and Abdel-Aty 2008) also found that alcohol had a positive relationship with crash severity.
2.3.4.2Environmental
Yan and Radwan (Yan and Radwan 2008) evaluated factors involved with left-turn crashes at signalized intersections and found that crashes during rainy weather are less likely than during clear weather. The authors suggest that the reported decrease in crash risk was due to more cautious driver behavior.
Jonsson et al. (Jonsson et al. 2007) used type of terrain to model single vehicle crashes at three-leg and four- leg intersections. They determined that when compared to flat terrain, mountainous terrain was found to have a significant positive influence on single vehicle crashes at three-leg intersections while rolling and mountainous terrain had a significant positive influence on single vehicle crashes at four-leg intersections.
Ma et al. (Ma et al. 2010) found that a two degree increase in roadway gradient
contributed to a decrease of 12.41 percent in fatal crashes, but increased disabling (24.88 percent), non-disabling (30.93 percent), possible (27.62 percent), PDO (24.07 percent), and total crashes (24.86 percent). Also, a two degree increase in degree of curvature contributed to an increase in crashes for all severity levels. In comparison, mountainous terrain typically associated with steep gradients and sharp degrees of curvature were found to have a positive relationship on PDO and fatal crash severity levels. In addition, the researchers identified negative but statistically insignificant relationships were found for possible and non-disabling severity levels, but were statistically insignificant.
2.4
MODELING TECHNIQUES
Various methodologies have been explored to improve or account for correlations between variables. Novel approaches, such as generalized additive models, were attempted to apply non-linear modeling techniques to predict crashes. In other research, techniques such as generalized estimating equations, multilevel, probit, and logit techniques were utilized and compared to the state of the practice count models (Poisson and negative binomial techniques).
2.4.1
Negative Binomial
Kweon (Kweon 2011) investigated four-legged signalized intersections with the objective of developing a tool for identifying high-risk intersections by traffic movements and time of day. Using crash data from 2001 through 2004, Kweon developed negative binomial and Poisson model based safety performance functions using crash patterns, flow, and time of day for data at 35 signalized intersections.
Lord and Park (Lord and Park 2008) compared varying and fixed parameters negative binomial approaches on rural three-legged intersections in California. Comparison between the traditional negative binomial models and generalized negative binomial model suggested that generalized negative binomial models can rank some sites as more hazardous when compared to the traditional negative binomial and may not be suitable for empirical Bayes (EB) methods.
2.4.2
Probit
Chiou et al. (Chiou et al. 2013) comparatively fit a bivariate generalized ordered probit (BGOP) with a bivariate ordered probit (BOP) model to two-vehicle crashes at signalized intersections in Taipei, Taiwan. The BGOP was found to predict crash severity better than the conventional BOP. Castro et al. (Castro et al. 2012) used a special case generalized ordered response probit model to estimate crash frequency in Arlington, Texas using a latent continuous variable divided into intervals to account for time-varying and spatial effects.
account for over dispersion. The authors concluded that GAMs can generate statistically interpretable results and offer useful nonlinear modeling techniques.
2.4.4
Generalized Estimating Equations
Wang and Abdel-Aty (Wang and Abdel-Aty 2007, 2008) used GEE to account for correlation in repeated observations. Negative binomial regression and GEE with negative binomial regression were used to model left-turn crash occurrence at signalized intersections to account for site correlation.
2.4.5
Logit
Anastasopoulos and Mannering (Anastasopoulos and Mannering 2011) compared the use of random parameter logit models with fixed parameter logit models. Geometrics, traffic
characteristics, socioeconomics, and collision characteristics were used to predict crash severity. The fixed parameters model performed better in predicting crash severity than the random parameters models, though the random parameters predicted within five percent of the fixed parameters.
Ye and Lord (Ye and Lord 2011) modeled crash severity using MNL, ML, and ordered probit (OP) methodologies to compare the effects of underreporting. Simulated crash data was used using the Monte Carlo approach as well as four years (1998-2001) of observed crashes (26,175 usable records). Results indicated that underreporting occurred in all three model
methodologies. The authors recommend using fatalities as baseline for MNL and ML models, whilst the OP model should use a descending order from fatal to PDO.
2.4.6
Multilevel
Multilevel models have also been used to predict crashes in recent years. Kim et al. (Kim et al. 2007) explored the application of binomial multilevel models using 548 crashes from 91 two-lane rural intersections in Georgia. A multilevel model was developed for each of five crash types (angle, head-on, rear-end, sideswipe-same direction, sideswipe-opposite direction) to study the interactions between observed and environmental factors and the crash type. The authors found that rural intersections can be modeled using a multilevel techniques to overcome the correlation between crashes at each hierarchy.
Huang et al. (Huang et al. 2008) used a Bayesian hierarchical approach to crash prediction to account for the multilevel structure of crash information within datasets. Geographic region, traffic, crash, driver-vehicle, and vehicle-occupant were the proposed levels for the employed methodology. The results demonstrate that accounting for the heterogeneity between the groups is important in crash prediction models and can be accomplished through Bayesian hierarchical methods.
A study in Shanghai, China of 195 signalized intersections within 22 urban corridors was conducted using hierarchical models to predict crashes to account for the correlation between signalized intersections within a corridor. Xie et al. (Xie et al. 2012) suggest that the hierarchical
also suggested that increasing exposure elements at the intersection level as well as increasing average speeds at the corridor level contributed to higher crash occurrence.
2.5
ESTIMATING MINOR VOLUMES
This section provides a comprehensive discussion of the methods used to estimate traffic volumes on roadways that are not traditionally part of counting programs.
2.5.1
Travel Demand Modeling
One approach towards estimating volumes is to employ the four step travel demand modeling processes. Zhong and Hanson (Zhong and Hanson 2009) estimated volumes using TransCAD’s built-in four step model for New Brunswick, Canada and found that traffic assignment to only 65 percent of the network forced overestimated traffic on the roadway network. Wang (Wang 2012) estimated AADT for local roads using parcel-level travel demand analysis with Institute of Transportation Engineering (ITE) trip generation rates, the gravity model for trip distribution, and equilibrium assignment.
2.5.2
Geospatial Methods
Generally, spatial methods approach estimation of AADT values by attaching weights that decrease with an increase in Euclidean or network distance between the measured traffic count and the estimation location. Wang and Kockelman (Wang and Kockelman 2009) used short term program counts to test the ability of Kriging to estimate AADT in Texas. They identified an overall median error percentage of 33 percent with larger errors on low volume roadways and underestimation on high volume roadways. The error was attributed to the non-inclusion of variables such as number of lanes, speed limit, and functional class. Selby and Kockelman (Selby and Kockelman 2011) explored the same data set accounting for speed, number of lanes,
employment per acre, population per acre, and functional class as covariates. While these variables decreased the absolute error within mini-regions, they had limited effect on the high error percentages associated with low-volume counts.
Pulugurtha and Kasam (Pulugurtha and Kasam 2012) investigated the effects of polygon-based network buffers compared to Euclidean distances in Charlotte, North Carolina. Bandwidths of one, one and a half, two, three, four, and five mile distances were compared to similar circular buffers defined by Euclidean radii. Minor thoroughfare volumes were estimated by urban indicator, upstream link speed limit, and rural district indicator. The researchers concluded that negative binomial regression performed better than Poisson, and modeling by functional class performed better than an overall model.
capita income at the county level. The final model contained four variables: location, accessibility, county arterial road mileage, and county population accounting for 75 percent of the variation in traffic volumes.
Xia et al. (Xia et al. 1999) used ordinary least squares (OLS) regression to estimate the volumes of 450 non-state urbanized roads in Florida. The resultant model included number of lanes, functional class, land-use, auto-ownership, proximity to county roads, and service employment. Seaver et al. (Seaver et al. 2000) developed regression models using traffic volumes collected on 1213 local roads in Georgia. They evaluated 45 independent variables covering population demographics, education, transportation, income, employment, farming, and urbanization using principal component analysis and regression. Ultimately they developed two sets of models to account for road-types within and outside of a metropolitan statistical area. Of the three models for rural paved roads outside of metropolitan statistical areas, the prediction R2 values were 0.74, 0.81, and 0.96 with small sample sizes used to calibrated the models (n=17, n=19, and n =22, respectively).
Zhao and Chung (Zhao and Chung 2001) estimated volumes using OLS for roads in Broward County, Florida. The independent variables used were number of lanes, functional class, direct access to expressways, employment within varying Euclidean distances, and accessibility. The Florida researchers generated four models with the best model performance of R2 = 0.818. Dixon et al. (Dixon et al 2012) estimated minor AADT for rural roadways using county and nearest city populations, regional average per capita income, distance to the freeway, functional classification, within a city boundary,
presence of a minor and/or major right turn lane, land-use, centerline, and striped edge lines. The resulting analysis generated two models, one model for rural roadways (R2=0.62), and another for use when estimating minor volumes at minor road four-leg signalized intersections (R2=0.64).
2.5.3.2Geographically Weighted Regression
Zhao and Park (Zhao and Park 2004) developed geographically weighted regression models to estimate AADT in Broward County, Florida. They used five independent variables: number of lanes, population concentration, employment concentration, regional accessibility, whether or not the road that had the count station was directly connected to an expressway. The authors concluded that GWR models predict better than OLS regression due to the ability of the models to better explain the variation in data by accounting for spatial variation in the predictor variables.
2.6
SUMMARY OF LITERATURE FINDINGS
This chapter provided an overview of recent safety research related to the development and calibration of signalized intersection safety performance models. Three critical crash types common to these intersections and as summarized in the literature included angle, left-turning, and rear-end crashes. In addition, much of the literature addressed the development of crash severity models so that the user can better understand what the expected levels of injury may be