© 2017, IRJET | Impact Factor value: 5.181 | ISO 9001:2008 Certified Journal
| Page 759
Study the Effect of FOV in Visible Light Communication
Negar Sendani
1, Roya ghahramani
21,2
Electrical and Electronics Engineering, Istanbul University, Istanbul, Turkey
---***---Abstract -
The inherent characteristics of the white LEDhave made visible light communications a lot of benefits, and this has led to an increase in research on this kind of communication. In this paper, we study and simulation the effect of the field of view on the characteristics of the transfer. We simulate the distributions of received power, SNR and bit error rate performance for different field of view.
Key Words: visible light communication, white LED, indoor, FOV, SNR, BER
1. INTRODUCTION
Energy and the other words saving energy are very important in these centuries, in this context, the development of fast and easy communications and the need for it is clear to everybody. Visible Light Communication (VLC) because of provide both above conditions are considered as a strong candidate for the next generation. Visible light communication is a short range optical wireless communication utilizing white LED in the visible light spectrum range (375 to 780 nm wavelength), so that the LED lights can provide both illumination and communication [1-3]. It can be expressed in a simple statement; that VLC utilized LED as a signal transmitter, air as a transmission medium and appropriate photodiode as a signal receiver component. It was impossible to obtain white LED until 1990 due to the lack of highly efficient blue and green LED. Now, InGaN based highly efficient blue and green LED has become commercially available. By mixing three primary colors (red, green and blue), it is possible fabricate white LEDs [4-6]. VLC has many advantages than the other wireless communication such as use unlicensed and virtually-unlimited light spectrum, high Signal to Noise Ratio (SNR), low cost energy, excellent security properties (VL does not penetrate through walls), no electromagnetic interference with other devices, safe for human health even when the transmitted power is very high and VLC devices can be used in places where RF communication is restricted such as hospitals and airports due to the possible interference of RF to another equipment [9-12]. VLC opened the minds towards Light-Fidelity (LiFi) [13].
2. SYSTEM DESCRIPTION
For simulation, we assume the physical parameters; the dimension to the room is 5 m length, 5 m width and 3 m height. Our VLC scenarios are based on single-source systems, lighting source is an LED panel consisting of 10×10 LEDs, where LED luminaries are located on the
ceiling. Assuming that the light from an LED has a Lambert Ian radiation pattern, and the radiation pattern is given by equation 1:
( )
( ) ( )(1)
Where m is the order of lambert Ian emission, which is related to the transmitter’s semi-angle at half power of an LED Φ1/2 as equation 2 [5]:
m=-
( ) (2)
The frequency response of optical channel is relatively flat near Direct Current (DC). In an optical link, the channel DC gain is given by equation 3 [14, 15]:
( ) ( ) ( ) ( ) ( ), 0≤Ψ≤Ψc
H (0) = (3) 0, Ψ>Ψc
Where d is the distance between the LED source and receiver, A is the physical area of photo-detector, and Ψ is the angle of incidence with respect to the axis normal to the desk plane where the LED is located, is the angle of irradiance, Ts(Ψ) is the gain of an optical filter, and g(Ψ) is
the gain of an optical concentrator.
ΨC denotes the width of the field of vision at a receiver. The
optical concentrator g (ψ) can be given as equation 4 [14]:
( ) , 0≤Ψ≤Ψc
g (Ψ)= (4) 0, Ψ>Ψc
In equation 4, n is a refractive index. The Field Of View (FOV) is an important parameter for defining the image-capturing range from the receiver. In this paper, we consider direct Line Of Sight (LOS) VLC link with no reflection from walls. Thus transmitted pulses are not obstructed and the relation h(t) =H(0) stands [4]. The received optical power pr is derived by the transmitted
optical power pt from each LED as equation 5:
Pr=H (0). Pt (5)
© 2017, IRJET | Impact Factor value: 5.181 | ISO 9001:2008 Certified Journal
| Page 760
( )
(6)
In equation 5, R is Responsivity (A/W), and σ2n is Total noise variance.
The noise power consists of both shot noise and thermal noise.
(7)
P
rB+2qI
bgI
2B
(8)
(9)
In equation 8, q is electronic charge, B, noise bandwidth, Ibg
, background current and I2 is the noise-bandwidth factor
which we set as I2 = 0.5620 [16]. Under typical conditions,
lower noise is achieved if the front-end device is a FET transistor rather than BJT transistor [17]. We assume the use of p-i-n photo detectors in conjunction with FET base trans impedance pre-amplifiers. We neglect FET gate leakage and 1/f noise. Thus at equation 9, two terms represent feedback-resistor noise, and FET channel noise, respectively, K is Boltzmann’s constant, Tk is the absolute
temperature; G is the open-loop voltage gain; A is detector area; η is the fixed capacitance of photo detector per unit area; Γ is the FET channel noise factor; gm is the FET trans
conductance, and I3 =0.0868[18].
3. RESULTS
[image:2.595.341.521.160.314.2]Numerical parameters for the simulation are listed in table 1.
Table -1: Physical parameters
Parameter Value
Transmitted optical power 20[mW]
Semi-angle at half power 70[deg]
Physical area of PD 1.0[cm2]
Gain of optical filter 1.0
Reflective index 1.5
I2, Noise bandwidth factor 0.562
I3 0.0868
Electronic charge, g 1.60217e-19 c
Detector responsivity 0.54[A/w]
Background current IB 5100[μA]
Boltzmann’s constant, K 1.38066e-23
Absolute temperature 295[k]
FET channel noise factor 1.5
Fixed capacitance, η 112
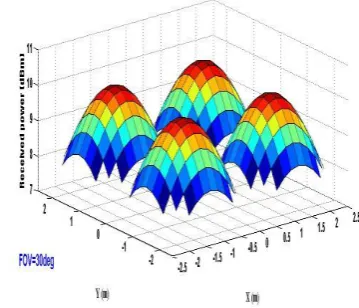
We consider the receiver with FOV=30, and simulation distribution of received power, SNR and BER for VLC at room. Charts 1-3 shows the distribution of received optical power, SNR and BER for the state of a receiver with FOV is 30.
Chart-1: The distribution of received optical power
Chart -2: The distribution of SNR
Chart -3: BER performance
© 2017, IRJET | Impact Factor value: 5.181 | ISO 9001:2008 Certified Journal
| Page 761
Chart -4: The distribution of received optical powerChart -5: The distribution of SNR
Chart -6: BER performance
Charts 7-9 shows the distribution of received optical power, SNR and BER for the state of a receiver with FOV is 90.
Chart -7: The distribution of received optical power
Chart -8: The distribution of SNR
© 2017, IRJET | Impact Factor value: 5.181 | ISO 9001:2008 Certified Journal
| Page 762
In this section, we compare the effect of FOV on the distribution of received power, SNR and BER.
Chart 10 show effect FOV on the distribution of received optical power.
Clearly that with increasing FOV, received optical power decrease.
Chart -10: Effect FOV on the distribution of received optical power
Chart 11 show effect FOV on the distribution of SNR. It is clear that with increasing FOV, SNR decrease.
Chart -11: Effect FOV on the distribution of SNR
Chart 12 show effect FOV on the BER performance. It is clear that with increasing FOV, BER performance is also increasing.
Chart -12: Effect FOV on BER performance
Wide FOV can be captured a large view, if the receiver can distinguish visible light from transmitters within the FOV, all data from transmitters can be received. But better notice that a receiver with a wide FOV is susceptible to more ambient light noise as compared to a receiver with a narrow FOV. We can use from this result for elect best FOV model.
4. CONCLUSIONS
In this paper, we simulation and study effect of field of a view’s receiver at the indoor visible light communication. We showed how to influence FOV, in visible light communication, on the received optical power, SNR distribution at room and beat error rate performance. We can use from this result for architects the light system and receiver location in the room or airbus’s.
REFERENCES
[1] K. Lee, H. Park, “Indoor Channel Characteristics for
Visible Light Communications,”IEEE communications letters, VOL. 15, NO. 2, Februar 2011, pp. 217-219, doi:10.1109/LCOMM.2011.010411.101945.
[2] H. Farahneh, C. Mekhiel, A. KHalifeh, W. Farjow and X.
Fernando, “Shadowing Effects on Visible
LightCommunication Channels,” IEEE, November 2016 , CCECE, Vancouver, BC, Canada, doi:10.1109/CCECE.2016.7726717.
[3] A. Al-Kinani, C-X. Wang, H. Haas and Y. Yang,
“Characterization and Modeling of Visible LightCommunication Channels,” IEEE, May. 2016, VTC, doi:10.1109/VTCSpring.2016.7504160.
[4] T. Komine and M. Nakagawa, “Integrated System of
Power-© 2017, IRJET | Impact Factor value: 5.181 | ISO 9001:2008 Certified Journal
| Page 763
Line Communication,” IEEE, Vol. 49, No. 1, February 2003, pp. 71 – 79, doi:10.1109/TCE.2003.1205458.
[5] T. Komine and M. Nakagawa, “Fundamental Analysis
for
Visible-Light Communication System using LED Lights,” IEEE,Vol. 50, No. 1, February 2004, pp. 100-107, doi:10.1109/TCE.2004.1277847.
[6] Y. Tanaka, T. Komine, S. Haruyama and M. Nakagawa
“Indoor Visible Communication utilizing Plural White
LEDs as Lighting,” IEEE,2001, doi:
10.1109/PIMRC.2001.965300.
[7] H.Q. Nguyen , J.-H. Choi , M. Kang , Z. Ghassemlooy , D.
H. Kim , S.-K. Lim , T.-G. Kang and C. G. Lee, “A MA TLAB-based simulation program forindoor visible light communication system,” IEEE, July. 2010.
[8] E. Sarbazi, M. Uysal, M. Abdallah and K. Qaraqe, “Ray
Tracing Based Channel Modeling for Visible Light
Communications,”IEEE, April .2014,
doi:10.1109/SIU.2014.6830326.
[9] D. Tronghop, J. Hwang, S. Jung, Y. Shin andM. Yoo,
“Modeling and Analysis of the Wireless Channel formed by LED Angle in Visible Light Communication,” IEEE, Feb. 2012, doi:10.1109/ICOIN.2012.6164399.
[10] Y.Li, H. Li and Z. Cai, “Implementation and Analysis of
Visible Light Communication System Using SCM,” IEEE, Oct. 2016, doi: 10.1109/IEMCON.2016.7746306.
[11] A. Mostafa and L. Lampe, “Physical-Layer Security for
Indoor Visible Light Communications,” IEEE,August.
2014, pp. 3342 – 3347,
doi:10.1109/ICC.2014.6883837.
[12] A. Yesilkaya, O. Karatalay, A. Selcuk and Erdal
Panayirci, “Channel Estimation for Visible Light Communications Using Neural Networks,” IEEE,
November. 2016, pp.320 – 325, doi:
10.1109/IJCNN.2016.7727215.
[13] H. Haas, L. Yin, Y. Wang, and C. Chen, “What is LiFi?,”
IEEE, Dec. 2015, pp. 1533 – 1544,
doi:10.1109/JLT.2015.2510021.
[14] J. R. Barry, “Wireless Infrared Communications,”
Kluwer AcademicPress, Boston, MA, 1994.
[15] A. Aldalbahi, M. Rahaim, A. Khreishah, M. Ayyash and
R. Ackerman, “Extending ns3 To Simulate Visible Light Communication at Network-Level,” ICT, May. 2016, doi:10.1109/ICT.2016.7500485.
[16] L. Zeng, D. O. Brien, H. Le. Minh, K. Lee, D. Jung, and Y.
Oh, “Improvement of date rate by using equalization in an indoor visible light communication system,”
ICCSC, May. 2008, pp. 678–682,
doi:10.1109/ICT.2016.7500485.
[17] S. D. Personick, “Receiver design for digital fiber optic
communication system , I and II,” BST, 1973, vol.52, no.6, pp.843-886.
[18] A. J. C. Moreira, R, T, Valadas and A, M. de Oliveira