and inflammation
Valerie A. Gerriets, … , Mari L. Shinohara, Jeffrey C. Rathmell
J Clin Invest. 2015;125(1):194-207. https://doi.org/10.1172/JCI76012.
Activation of CD4+ T cells results in rapid proliferation and differentiation into effector and regulatory subsets. CD4+ effector T cell (Teff) (Th1 and Th17) and Treg subsets are metabolically distinct, yet the specific metabolic differences that modify T cell populations are uncertain. Here, we evaluated CD4+ T cell populations in murine models and determined that inflammatory Teffs maintain high expression of glycolytic genes and rely on high glycolytic rates, while Tregs are oxidative and require mitochondrial electron transport to proliferate, differentiate, and survive. Metabolic profiling revealed that pyruvate dehydrogenase (PDH) is a key bifurcation point between T cell glycolytic and oxidative metabolism. PDH function is inhibited by PDH kinases (PDHKs). PDHK1 was expressed in Th17 cells, but not Th1 cells, and at low levels in Tregs, and inhibition or knockdown of PDHK1 selectively suppressed Th17 cells and increased Tregs. This alteration in the CD4+ T cell populations was mediated in part through ROS, as N-acetyl cysteine (NAC) treatment restored Th17 cell generation. Moreover, inhibition of PDHK1 modulated immunity and protected animals against experimental autoimmune encephalomyelitis, decreasing Th17 cells and increasing Tregs. Together, these data show that CD4+ subsets utilize and require distinct metabolic programs that can be targeted to control specific T cell populations in autoimmune and inflammatory diseases.
Research Article Immunology
Find the latest version:
The Journal of Clinical Investigation
R e s e a R c h a R t i c l eIntroduction
CD4+ T lymphocytes are critical to mediating or suppressing
nor-mal immunity as well as inflammatory or autoimmune diseases. Antigen exposure initially leads to T cell activation, inducing rapid growth and proliferation. Depending on the cytokine environ-ment during activation, CD4+ T cells then differentiate into
effec-tor (Teff) (Th1 and Th17) or Treg subsets. Each of these subsets plays a unique role in the adaptive immune system, with Teffs driving immunity and inflammation while Tregs play an opposing role, suppressing Teffs to limit excessive inflammatory responses (1). The balance between Teffs and Tregs is crucial to providing sufficient immune protection without promoting autoimmunity. Indeed, many autoimmune diseases, including multiple sclerosis and inflammatory bowel disease (IBD), involve an imbalance of Teffs to Tregs or decreased Treg function (2). Th17, in particular, plays a key proinflammatory role in many autoimmune diseases, including experimental autoimmune encephalomyelitis (EAE),
IBD, and graft-versus-host disease (3–5). Identifying character-istics of each T cell population to allow the balance of Teffs and Tregs to be modulated may therefore provide a way to prevent or suppress autoimmunity.
Emerging evidence has suggested that CD4+ T cell metabolism
is highly dynamic and may allow targeting of select T cell popula-tions. T cell activation leads to a demand for biosynthetic precur-sors and adequate energy for effector function (6, 7). This repro-gramming involves decreased lipid oxidation and an increase in glucose uptake and glycolysis as well as amino acid transport and glutaminolysis (8–12). Importantly, metabolic reprogramming of Teffs and Tregs leads to distinct metabolic programs. While Teffs utilize large amounts of glucose and a high rate of glycolysis to support their energetic needs, Tregs can oxidize lipids and are able to expand and function even in the absence of glucose (13, 14). The specific metabolic substrate usage and metabolic programs that are required for activation and differentiation of Teffs and Tregs, however, are uncertain.
Pyruvate metabolism is one regulatory point in glucose metab-olism that may play a central role in the glycolytic or oxidative roles of Teffs and Tregs. Pyruvate dehydrogenase (PDH) catalyzes the conversion of cytosolic pyruvate into mitochondrial acetyl-CoA for oxidative metabolism. PDH is inhibited by PDH kinase (PDHK) to suppress pyruvate oxidation and instead promote its conver-sion to lactate via lactate dehydrogenase (LDH) (15). PDHK has 4 isoforms that are regulated by oncogenic signaling and hypoxia (16, 17). Indeed, cancer cells are also highly glycolytic, and
target-Activation of CD4+ T cells results in rapid proliferation and differentiation into effector and regulatory subsets. CD4+ effector T cell (Teff) (Th1 and Th17) and Treg subsets are metabolically distinct, yet the specific metabolic differences that modify T cell populations are uncertain. Here, we evaluated CD4+ T cell populations in murine models and determined that inflammatory Teffs maintain high expression of glycolytic genes and rely on high glycolytic rates, while Tregs are oxidative and require mitochondrial electron transport to proliferate, differentiate, and survive. Metabolic profiling revealed that pyruvate dehydrogenase (PDH) is a key bifurcation point between T cell glycolytic and oxidative metabolism. PDH function is inhibited by PDH kinases (PDHKs). PDHK1 was expressed in Th17 cells, but not Th1 cells, and at low levels in Tregs, and inhibition or knockdown of PDHK1 selectively suppressed Th17 cells and increased Tregs. This alteration in the CD4+ T cell populations was mediated in part through ROS, as N-acetyl cysteine (NAC) treatment restored Th17 cell generation. Moreover, inhibition of PDHK1 modulated immunity and protected animals against experimental autoimmune encephalomyelitis, decreasing Th17 cells and increasing Tregs. Together, these data show that CD4+ subsets utilize and require distinct metabolic programs that can be targeted to control specific T cell populations in autoimmune and inflammatory diseases.
Metabolic programming and PDHK1 control CD4
+
T cell
subsets and inflammation
Valerie A. Gerriets,1 Rigel J. Kishton,1 Amanda G. Nichols,1,2,3 Andrew N. Macintyre,1,2,3 Makoto Inoue,2 Olga Ilkayeva,3 Peter S. Winter,1 Xiaojing Liu,4 Bhavana Priyadharshini,5 Marta E. Slawinska,6 Lea Haeberli,6 Catherine Huck,6 Laurence A. Turka,5 Kris C. Wood,1 Laura P. Hale,7 Paul A. Smith,6 Martin A. Schneider,6 Nancie J. MacIver,8 Jason W. Locasale,4 Christopher B. Newgard,1,3 Mari L. Shinohara,2 and Jeffrey C. Rathmell1,2,3
1Department of Pharmacology and Cancer Biology, 2Department of Immunology, and 3Duke Molecular Physiology Institute, Duke University, Durham, North Carolina, USA. 4Division of Nutritional Sciences,
Cornell University, Ithaca, New York, USA. 5Department of Surgery, Massachusetts General Hospital and Harvard Medical School, Boston, Massachusetts, USA. 6Novartis Institutes for Biomedical Research,
Autoimmunity, Transplantation and Inflammation, Basel, Switzerland. 7Department of Pathology and 8Department of Pediatrics, Duke University, Durham, North Carolina, USA.
Note regarding evaluation of this manuscript: Manuscripts authored by scientists
associated with Duke University, The University of North Carolina at Chapel Hill, Duke-NUS, and the Sanford-Burnham Medical Research Institute are handled not by members of the editorial board but rather by the science editors, who consult with selected external editors and reviewers.
Conflict of interest: Marta E. Slawinska, Lea Haeberli, Catherine Huck, Paul A. Smith,
and Martin A. Schneider are employees of Novartis Institutes of Biomedical Research. Laurence A. Turka owns equity in, and has a family member employed by, Novartis.
Submitted: March 10, 2014; Accepted: October 30, 2014.
lomics data suggest that PDHK isoform 1 (PDHK1) is an impor-tant modulator of Th17 and Treg metabolism. Indeed, suppression of PDHK1 expression or inhibition with DCA caused ROS accumula-tion and selectively inhibited the survival and proliferation of Th17 cells. DCA was also capable of sup-pressing Th17 cells and CD4+ T cell–
mediated inflammation in both IBD and EAE models. Together, these metabolic data have identified PDH as a key regulatory point in CD4+ T
cell subset fate and show that inhi-bition of PDHK1 leads to selective ROS generation and targeting of Th17 cells in vivo in inflammatory and autoimmune disorders.
Results
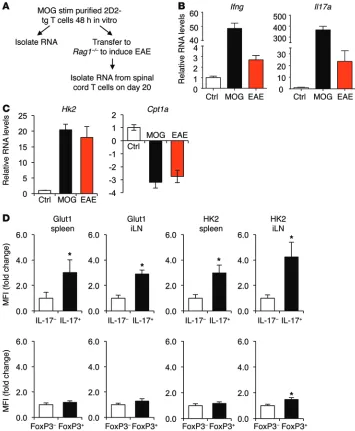
T cells undergo metabolic reprogram-ming toward a glycolytic phenotype in vivo. While T cells undergo a
metabolic reprogramming toward glycolysis in vitro, little is known regarding the metabolism of inflammatory T cell subsets in vivo. The metabolic phenotype of 2D2 TCR transgenic T cells spe-cific for myelin oligodendrocyte glycoprotein (MOG) was, there-fore, observed upon activation and adoptive transfer to induce EAE (Figure 1A). Immunologic and metabolic gene expression was compared between in vitro antigen-activated 2D2 T cells and 2D2 T cells directly isolated from spinal cords of mice with EAE. Ifng and Il17 were sharply induced upon in vitro stimulation and also were significantly elevated in T cells at the disease site in EAE (Figure 1B). Similar to in vitro metabolic reprogramming to glycolytic from oxi-dative metabolism, T cells from the spinal cord of mice with EAE also had elevated expression of the glycolytic gene Hexokinase 2 (Hk2) and decreased expression of the lipid oxidation gene Car-nitine palmitoyltransferase 1A (Cpt1a, Figure 1C). The metabolic profile of in vivo–differentiated T cells was next examined directly by flow cytometry in IL-17–producing or FoxP3-expressing cells in EAE. IL-17–producing cells showed elevated levels of both Glucose transporter 1 (GLUT1) and HK2 proteins in the spleen and inguinal lymph nodes during active EAE disease (Figure 1D). In contrast, neither GLUT1 nor HK2 was elevated in FoxP3-expressing cells. Teffs in inflammatory disease sites in vivo, therefore, appear to be glycolytic, while Tregs utilize a distinct metabolic program. ing PDHK with dichloroacetate (DCA) can suppress glycolysis and
lead to increased oxidative metabolism and production of ROS (15, 18). DCA has also been shown to reduce proinflammatory cytokine production and promote FoxP3 expression in vitro and in several in vivo inflammatory models (19–21), although the mechanisms involved have not been established.
Here, we examine the metabolic programs of each T cell subset in vivo and in vitro to identify distinct metabolic pathways that will allow selective targeting of different T cell populations. We show that Tregs oxidize not only lipids at a high rate, but also glycolysis-derived pyruvate. Teffs require glycolytic metabolism for prolif-eration, differentiation, and survival, while Tregs require oxidative metabolism for these processes. Gene expression and
[image:3.585.45.400.55.486.2]The Journal of Clinical Investigation
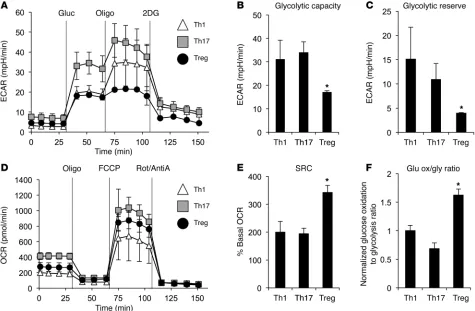
R e s e a R c h a R t i c l erequired to generate ATP. The glycolytic capacity and glycolytic reserve were both severely impaired in Tregs compared with Th1 and Th17 cells (Figure 2, B and C). Therefore, when glucose is the only fuel available, Teffs efficiently perform glycolysis while Tregs are unable to increase their glycolytic capacity.
Mitochondrial and oxidative metabolism can play a key role in supporting T cell activation and proliferation (22, 23). While Tregs have high rates of lipid oxidation (13), mitochondrial oxida-tion of pyruvate has not been previously examined. Mitochondrial oxygen consumption rate (OCR) was therefore measured in each CD4+ subset in media containing glucose. Prior to addition of
met-abolic inhibitors, Tregs had an intermediate level of oxygen con-sumption relative to Teffs, with Th17 cells maintaining the highest basal rate of oxygen consumption (Figure 2D). Oligomycin treat-ment to inhibit mitochondrial ATP production suppressed oxygen consumption in each subset to an equivalently low level, indicat-ing that oxygen consumption was tightly coupled to ATP genera-tion for all T cell subsets. Upon the addigenera-tion of the protonophore carbonyl cyanide 4-(trifluoromethoxy) phenylhydrazone (FCCP) to uncouple oxidative phosphorylation from electron transport and allow maximal respiration, Tregs and Th17 greatly upregulat-ed oxygen consumption. When comparupregulat-ed with the basal rates of
Teffs and Tregs utilize different metabolic pathways and have distinct fuel capacities. Although previous studies (13, 14) and in
vivo analyses here (Figure 1) have identified basic metabolic dif-ferences between Teffs (Th1 and Th17) and Tregs, the underly-ing metabolic features of CD4+ T cell subsets are uncertain. To
examine the detailed metabolic phenotype of the CD4+ T cell
subsets, Teffs and Tregs were differentiated in vitro and oxy-gen consumption and lactate production were measured using an extracellular metabolic flux analyzer. Cells were cultured in the absence of glucose, glutamine, or lipids, and the extra-cellular acidification rate (ECAR), a measurement of lactate production, was determined upon readdition of glucose (Fig-ure 2A). All CD4+ T cell subsets had increased ECAR following
[image:4.585.53.528.56.367.2]glucose addition, although Th1 and Treg had less of an increase than Th17 cells. Oligomycin was then added to block mitochon-drial ATP production and promote maximal rates of glycolysis. Importantly, Th1 and Th17 cells each showed a robust increase in ECAR following oligomycin treatment, but Tregs were largely unchanged. These data indicate that Tregs were performing gly-colysis at maximal rates following glucose addition and have lim-ited capacity to increase this pathway. Teffs, in contrast, generate lactate at a high rate and can further elevate glycolytic rate when
erentially oxidize lipids, but relative glucose oxidation rates in T cell subsets have not been directly tested (13). To measure the fate of glycolysis-derived pyruvate, CD4+ T cell subsets were provided
radiolabeled glucose and glycolytic flux was measured through enolase production of phosphoenolpyruvate and glucose oxida-tion to CO2. The ratio of glucose oxidation to glycolytic flux was higher in Tregs, supporting the conclusion that this subset prefer-entially oxidizes glucose rather than converting pyruvate to lactate (Figure 2F). Together, these data indicate that Tregs utilize mito-oxygen consumption, these data show that Tregs have the greatest
spare respiratory capacity (SRC) of the subsets (Figure 2E). Thus, Tregs have low glycolytic production of lactate and cannot further elevate this pathway, yet have the greatest capacity for mitochon-drial oxidation when glucose is the only available fuel.
These data suggested that Teffs and Tregs may differentially utilize glucose, with Teffs preferentially converting glucose-derived pyruvate to lactate, while Tregs instead oxidize this fuel in the mitochondria. We have previously shown that Tregs
[image:5.585.44.548.51.526.2]The Journal of Clinical Investigation
R e s e a R c h a R t i c l etion of each Teff subset and instead increased Treg proliferation (Figure 3B). Conversely, rotenone did not affect Teffs, but sharply reduced Treg proliferation.
Differentiation of each CD4+ T cell subset is characterized by
induction of specific transcription factors as cells undergo DNA replication and division (1). Given the reliance of Teffs on glycol-ysis and Tregs on mitochondrial metabolism for proliferation, it was possible that the ability of subsets to express these transcrip-tion factors was also metabolically sensitive. Consistent with this notion, 2DG treatment suppressed induction of the Th1-specific transcription factor T-bet in cells cultured under Th1 conditions as well as retinoid-related orphan receptor γ T cell (RORγT), which is required for Th17, in T cells cultured under Th17 con-ditions (Figure 3C). Importantly, this effect was not dependent on cell division, as T-bet and RORγT were inhibited at each equivalent cell-cycle division. Likewise, expression of the T-bet and RORγT transcriptional targets, IFN-γ and IL-17, respectively, chondrial oxidative pathways using both lipids (13) and glucose
as fuels while Teffs have low levels of mitochondrial oxidative metabolism for either fuel and primarily perform aerobic glycoly-sis, converting pyruvate to lactate.
Inhibition of glycolysis or mitochondrial oxidation selective-ly affects Teff or Treg proliferation, differentiation, and survival.
Although extracellular flux analysis revealed that Teffs and Tregs utilize pyruvate through distinct glycolytic or mitochondrial oxi-dative metabolic pathways, the reliance of these subsets on each mode of metabolism was not clear. To determine whether each CD4+ subset required these programs, CD4+ T cell subsets were
labeled with the proliferation indicator dye CellTrace Violet (CTV), differentiated in vitro, and treated with either low-dose 2-deoxyglucose (2DG) or rotenone to inhibit glycolysis or elec-tron transport, respectively (Figure 3A and Supplemental Fig-ure 1A; supplemental material available online with this article; doi:10.1172/JCI76012DS1). 2DG treatment inhibited the
[image:6.585.55.525.60.455.2]were also suppressed by 2DG at each equivalent cell division (Supplemental Figure 1B). Aerobic glycolysis was previously shown to be required for maximal IFN-γ production in activated T cells (22), and 2DG also suppressed IFN-γ production and
[image:7.585.50.544.50.624.2]pro-liferation of T cells activated in the absence of skewing condi-tions (Supplemental Figure 2A). Induction of the Treg transcrip-tion factor FoxP3, however, was not affected by 2DG. In contrast, the electron transport inhibitor rotenone selectively reduced
The Journal of Clinical Investigation
R e s e a R c h a R t i c l eFoxP3 expression in Tregs at each equivalent cell division and only minimally suppressed T-bet and RORγT expression by Th1 and Th17 cells (Figure 3C) or IFN-γ production or proliferation of activated T cells (Supplemental Figure 2A). FoxP3+ natural Tregs
(nTregs) isolated from splenocytes had reduced proliferation, but not cell survival, following rotenone treatment (Supplemen-tal Figure 2, B and C). Importantly, Teffs were not affected by 2DG and rotenone following differentiation, demonstrating that 2DG affects Teff differentiation and cytokine production primar-ily during early activation and subset specification (Supplemen-tal Figure 3, A and B). Likewise, there was no effect of rotenone on FoxP3 expression in differentiated Tregs.
CD4+ subsets may rely on specific metabolic programs, not
only for proliferation and differentiation, but also for survival. Teff and Treg subsets were therefore established in vitro and treated with 2DG or rotenone following differentiation (Figure 3D). Tregs
survived well in the presence of 2DG, as measured by propidium iodide exclusion, and were only moderately affected by glycolytic inhibition (Figure 3E). In contrast, Th1 and Th17 were sensitive to 2DG treatment and showed increased cell death (Figure 3E and Supplemental Figure 3C). Teffs were relatively insensitive to rotenone, and rotenone instead enhanced Th17 relative to vehicle (Figure 3F). Tregs, however, were sensitive to rotenone treatment, with reduced viability (Figure 3F and Supplemental Figure 3C). This effect was not specific to induced Tregs, as reduced prolifera-tion was also observed in rotenone-treated natural Tregs (Figure 3G). Overall, these data suggest that specific metabolic programs of Teffs and Tregs are fundamentally linked to CD4+ T cell
prolif-eration, differentiation, and survival.
Th17 cells and Tregs have distinct metabolic phenotypes. The
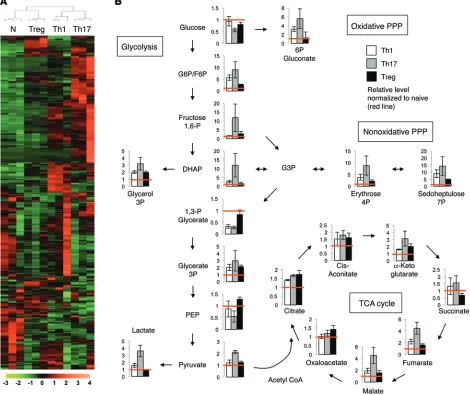
[image:8.585.43.537.55.440.2]dis-tinct metabolic dependencies of Teffs and Tregs suggested detailed metabolic profiling could reveal key regulatory points of CD4+ T
tate compared with Th17 (Supplemental Figure 5A). Acyl-carni-tines were variable between Th17 cells and Tregs, and Tregs had increased C2 and C4-OH carnitine levels relative to Th17 (Supple-mental Figure 5, B and C). These metabolites equilibrate with and reflect acetyl and β-hydroxybutryl CoA species, respectively. We also observed a drop in oleyl-carnitine (C18:1). This fall in a long-chain acyl-carnitine coupled with the rise in C4-OH (hydroxybu-tyrylcarnitine) is consistent with increased fatty acid oxidation (25) and supports the model that Tregs utilize fatty acids to a greater extent than Th17. Together, these metabolic data suggest that each CD4+ T cell subset has a unique metabolic phenotype and point to
specific metabolic distinctions in fuel consumption patterns and dependencies between the Treg and Teff subsets.
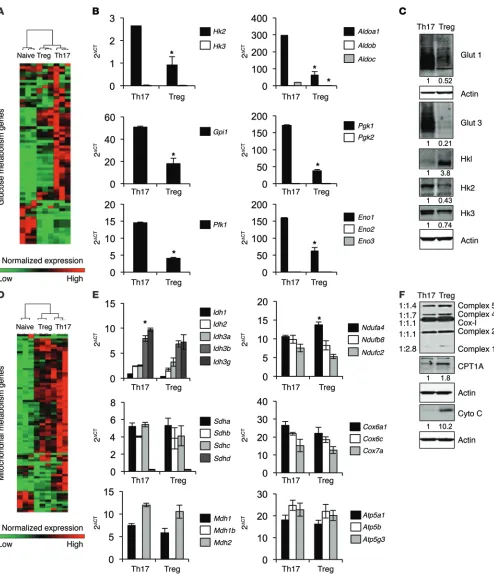
Expression of metabolic genes and select proteins was next determined in Th17 cells and Tregs. Gene-clustering analy-sis showed that Th17 had broadly higher expression of glucose metabolism genes, followed by Tregs and naive T cells (Figure 5A, Supplemental Figure 6, and Supplemental Tables 3 and 4). Specifically, Th17 had higher levels of expression of many glyco-lytic genes compared with Tregs (Figure 5B). Interestingly, CD4+
T cells preferentially expressed a single isoform of each glycolytic gene (Figure 5B). In addition, CD4+ T cells expressed several
glu-cose transporters, including GLUT1 and GLUT3. Expression of GLUT1 protein was elevated in Th17 compared with Tregs, and Tregs did not express detectable levels of GLUT3 (Figure 5C and cell subsets. We therefore examined metabolite levels and
meta-bolic gene expression of Th1 and Th17 cells and Tregs in detail, as the balance of these subtypes is crucial in a variety of inflam-matory settings. Unsupervised clustering of steady-state levels of approximately 400 metabolites measured by high-resolution non-targeted Q exactive–mass spectrometry (QE-MS) metabolomics (24) showed that Teffs and Tregs had broad metabolic differences (Figure 4A and Supplemental Table 1). Importantly, Tregs were dis-similar from Th1 and Th17 cells, which clustered together. A sepa-rate liquid chromatography/gas chromatography–MS (LC/GC-MS) analysis of approximately 200 metabolites found similar results (Supplemental Figure 4 and Supplemental Table 2). Th17 cells and Tregs were the most distinct, and Th17 cells had high levels of early glycolytic and pentose phosphate pathway intermediates (Figure 4B). Late glycolytic intermediates were more similar, although Th17 had high pyruvate and higher still levels of lactate, suggesting preferential pyruvate conversion to lactate. Despite lower levels of pyruvate, Tregs had TCA-cycle intermediates equivalent to those of Th17 cells up to α-ketoglutarate, which may indicate preferential pyruvate oxidation in Tregs and glutamine oxidation by Th17.
Th17 cell and Treg subsets were next examined for levels of amino acids and acyl-carnitines, which are intermediates that reflect lipid oxidation products and available mitochondrial fuels. No clear T cell–subtype patterns were observed with regard to amino acid levels, except that Tregs had elevated levels of
[image:9.585.45.551.54.349.2]The Journal of Clinical Investigation
R e s e a R c h a R t i c l ecells and Tregs (Figure 5E). Additionally, Tregs had elevated levels of many of the electron transport chain proteins as well as higher levels of the fatty acid transporter CPT1A and electron transport chain component cytochrome c compared with Th17 (Figure 5F and Supplemental Figure 7). Together, these data show distinct genetic and metabolite differences that likely mediate the specific metabolic programs and dependencies of Teffs and Tregs.
PDHK is required for Th17, but not Treg, function in vitro. The
finding of distinct substrate utilization patterns suggested that the bifurcation point for pyruvate to lactate or conversion to acetyl-CoA via the PDH complex for mitochondrial oxidation may be an important regulatory node for Th17 and Treg CD4+ subsets. To
[image:10.585.63.515.53.490.2]Supplemental Figures 6 and 7). After uptake, glucose is phosphor-ylated by hexokinase (HK), of which there are 4 isoforms. Surpris-ingly, Tregs expressed primarily HK1 protein, while Th17 mainly expressed HK2 and HK3 (Figure 5C and Supplemental Figure 7). Interestingly, although HK1 protein levels were elevated in Tregs, the RNA levels of HK1–3 were decreased relative to Th17 (Figure 5C and Supplemental Figure 7). Unsupervised clustering of mito-chondrial genes showed that both Th17 cells and Tregs expressed higher levels of mitochondrial metabolism genes compared with naive T cells (Figure 5D, Supplemental Figure 6, and Supplemen-tal Tables 4 and 5). The expression of genes specifically involved in the TCA cycle and electron transport were similar between Th17
Figure 8. PDHK is selectively required for Th17, but not Treg, expansion and function in vivo. (A–C) Rag1–/– mice were injected with naive Teffs
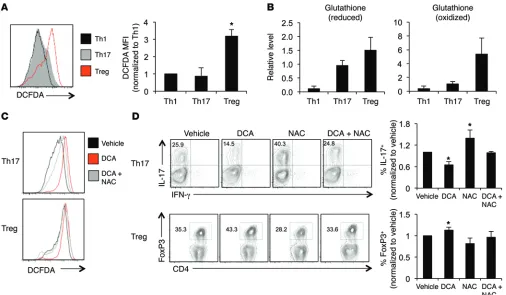
7C). We next tested the effects of DCA-induced ROS by cotreat-ment of Th17 cells and Tregs with DCA and the antioxidant NAC to prevent ROS accumulation. Differentiated T cells treated with DCA showed levels of ROS accumulation similar to those with acute DCA treatment (Supplemental Figure 10A), and 1 mM NAC was sufficient to partially rescue ROS accumulation following DCA treatment (Figure 7C and Supplemental Figure 10B). DCA treatment alone inhibited IL-17 production; however, cotreatment with NAC prevented the decrease in IL-17 (Figure 7D). In contrast, while DCA promoted Tregs, cotreatment with NAC prevented this increase in Tregs. These data suggest that DCA drives glucose oxi-dation and ROS production that Tregs are programmed to manage.
Inhibition of PDHK in vivo differentially affects Th17 cells and Tregs to inhibit the progression of colitis and EAE. In vitro, PDHK
inhibition by DCA treatment does not affect Th1, but has a selec-tive deleterious effect on Th17 function while favoring Treg dif-ferentiation. While DCA has been previously shown to suppress inflammation in arthritis, asthma, and alloreactivity (19–21), the specific effect on the differentiated CD4+ T cell subsets has not
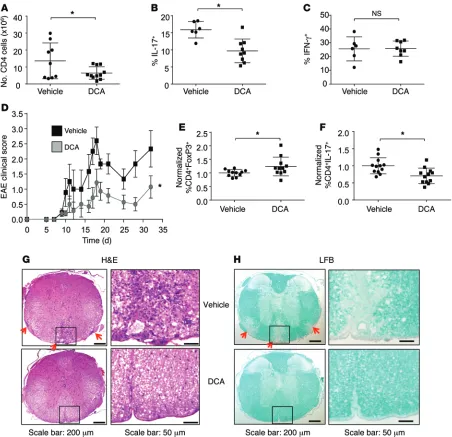
been examined in vivo. We therefore tested the ability of DCA to suppress the Th17-mediated inflammatory diseases. IBD is driven by both Th1 and Th17 and alleviated by Tregs, which allow functional examination of each subset in vivo (31). Naive T cells were adoptively transferred into immunodeficient recipients in the absence of Tregs, and mice were then given normal or DCA-containing drinking water. IBD was initiated upon generation of Teffs by encounter with gut microbiota following exposure to the clinically relevant NSAID piroxicam 2 weeks after the T cell transfer. Significantly fewer CD4+ cells were found in the
mesenteric lymph nodes and infiltrating into the gut tissue of mice treated with DCA relative to those receiving vehicle water (Figure 8A and Supplemental Figure 11A). While Th17 cells were reduced, DCA treatment did not lead to a reduction of Th1 cells, as measured by the percentage of IFN-γ–producing CD4+ T cells
(Figure 8, B and C, and Supplemental Figure 11B). These data suggest that PDHK inhibition selectively affects Th17 but not Th1 proliferation and function in vivo. Despite inhibition of Th17 cells, DCA treatment did not prevent intestinal inflammation or disease progression, likely due to the functional Th1 response (Supplemental Figure 11C).
To independently test the role of PDHK on Th17 and Treg populations, we next examined the effects of DCA in EAE. While Th1 cells can contribute, this model is largely Th17 dependent, as RORγT-knockout mice are disease resistant (32, 33). EAE was induced in wild-type mice by MOG immunization, and DCA was given in the drinking water throughout the course of the experi-ment; clinical signs of EAE were assessed at regular intervals. PDHK inhibition by DCA treatment significantly alleviated EAE clinical symptoms throughout the course of disease progression (Figure 8D). T cells isolated from the inguinal draining lymph nodes were reduced in number and showed an increase in FoxP3+
Tregs and a decrease in IL-17–producing and CD44hi T cells,
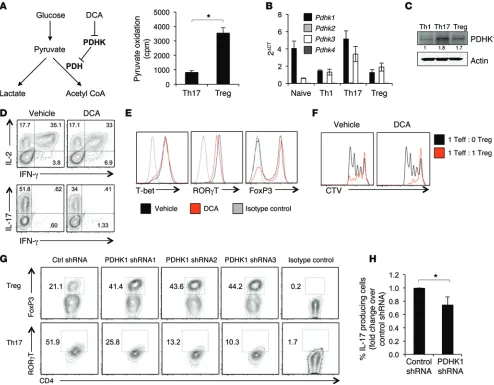
con-sistent with our in vitro findings (Figure 8, E and F, and Supple-mental Figure 11D). Importantly, DCA treatment also impaired infiltration of T cells into the spinal cord and prevented demyelin-ation, as measured by H&E and Luxol Fast Blue (LFB) staining, respectively (Figure 8, G and H). Therefore, PDHK inhibition in measure the flux of pyruvate through PDH, Th17 cells and Tregs
were provided radiolabeled pyruvate and its oxidation to CO2 was measured. Pyruvate oxidation was higher in Tregs, demonstrating that Tregs preferentially direct pyruvate to mitochondrial metabo-lism (Figure 6A). PDH is a highly regulated multisubunit complex that is controlled, in part, by PDHK, which phosphorylates and inhibits PDH to direct pyruvate to lactate rather than to acetyl-CoA. Expression of the 4 Pdhk isoforms was therefore examined in the CD4+ T cell subsets. T cells expressed Pdhk1 and Pdhk3,
with Pdhk1 being the predominant isoform (Figure 6B). At both the RNA and protein levels, Th17 expressed the highest levels of PDHK1, followed by Tregs, while Th1 had little PDHK1 expression (Figure 6C and Supplemental Figure 8A). Therefore, PDHK1 is dif-ferentially expressed in the CD4+ T cell subsets and may play a role
in controlling T cell metabolism.
PDHK is a target of the inhibitor compound DCA (Figure 6A and ref. 26), which has been previously shown to affect cytokine production and Tregs (19–21). To determine the effect of PDHK inhibition on CD4+ T cell fate and function, CD4+ T cells were
dif-ferentiated in vitro in the presence of DCA or treated with DCA following 3 days of differentiation. DCA treatment did not affect Th1 differentiation or function, as IFN-γ production and T-bet expression were similar regardless of treatment (Figure 6, D and E, and Supplemental Figure 8, B–D). In contrast, DCA inhibited the production of IL-17 in cells cultured in Th17-skewing condi-tions and suppressed expression of the Th17 transcription factor RORγT (Figure 6, D and E, and Supplemental Figure 8, B–D). Con-versely, treatment of Tregs with DCA increased the expression of FoxP3 compared with vehicle and maintained or potentially increased the in vitro suppressive capacity of Tregs (Figure 6, D–F, and Supplemental Figure 8E). We next genetically targeted Pdhk1 using 3 different lentiviral shRNA constructs (Supplemental Fig-ure 9A). Pdhk1 deficiency inhibited RORγT and IL-17 expression in Th17 cells and increased FoxP3 expression, mimicking the in vitro effects seen with DCA (Figure 6, G and H, and Supplemental Figure 9, B and C). Lentiviral transduction itself had no effect on metabolism (Supplemental Figure 9, D and E). These data dem-onstrate that pyruvate metabolism and PDHK1 play a key role in modulating Th17 cells and Tregs.
The Journal of Clinical Investigation
R e s e a R c h a R t i c l emetabolic profile distinct from that of Teffs, and the metabolic dif-ferences between Teffs and Tregs may be necessary for the ability of Tregs to function and suppress inflammation.
In vitro treatment with 2DG can impair glycolysis and prevent Teff proinflammatory cytokine production, survival, proliferation, and even differentiation (14). In contrast, Tregs were not affected by 2DG and instead were sensitive to mitochondrial inhibitors. Previous literature has demonstrated that the glycolytic enzyme GAPDH can bind to IFNG mRNA and inhibit its translation to link glycolysis with inflammatory cytokine production (22). Here, we show that 2DG treatment also inhibited Teff proliferation and expression of the effector transcription factors T-bet and RORγT, demonstrating a different pathway by which glycolytic inhibition can affect T cell differentiation. Mitochondrial inhibition, in con-trast, suppressed Tregs. This may have been partly due to reduced ATP generation or altered ROS regulation, given the modulation of Tregs by the antioxidant NAC.
Given that Tregs utilize mitochondrial oxidation while Teffs convert glucose-derived pyruvate to lactate, the branch point between glycolysis and glucose oxidation was identified as a potential target to modulate the balance between Teffs and Tregs. PDHK is a primary regulator of this branch point and inhibits PDH to suppress glucose oxidation and instead promote lactate production and glycolysis. Interestingly, PDHK1 was differen-tially expressed in T cell subsets, with robust expression in Th17, but little expression in Th1 and intermediate expression in Tregs. Naive CD4+ T cells also expressed PDHK1, although these cells
are predominantly oxidative rather than glycolytic. DCA inhibits PDHK and is currently under investigation in several different types of cancer (38–42), where it may be effective by inhibition of aerobic glycolysis by suppressing generation of lactate and instead directing glucose to be oxidized in the mitochondria. DCA also can promote ROS in several cancer models that may drive cancer cell senescence (15, 38, 42). In the immune system, treatment of human peripheral blood mononuclear cells (PBMCs) with DCA inhibited proinflammatory cytokine production and promoted FoxP3 expression in the setting of asthma and alloreactivity (19– 21). However, these studies did not directly examine the role of PDHK or DCA in T cell subsets or establish a mechanism of action.
Our data show that DCA inhibits Teff differentiation and cyto-kine production and does so by inhibition of PDHK1 and subse-quent alteration of glucose utilization and ROS. Promoting glu-cose oxidation through PDHK1 inhibition selectively suppresses Th17 generation; this is mediated in part through the generation of ROS. In contrast, Th1 cells are not regulated by PDHK1 and instead maintain a glycolytic program through an independent pathway. Several recent reports suggest that Teffs are more sensitive to ROS stress than Tregs (27, 28, 30). Deletion of the antioxidant molecule peroxiredoxin II in T cells increased Tregs and prevented dextran sulfate sodium–induced colitis (28). In our study, Tregs were found to have high levels of the antioxidant glutathione. While Tregs also have high levels of ROS compared with Teffs, Tregs likely produce ROS during mitochondrial oxidation and are equipped with anti-oxidant molecules to handle this ROS generation. Our data sug-gest that Th17 cells are less able to handle ROS stress generated by the activation of PDH and subsequent glucose oxidation, as DCA inhibited IL-17 production. Consistent with this model, neutraliza-vivo selectively modulates the balance between Th17 cells and
Tregs and suppresses autoimmunity. These data suggest that the distinct metabolic programs of CD4+ subsets are essential for each
subset and can be exploited to target specific T cell populations in inflammatory diseases.
Discussion
It is increasingly evident that metabolic reprogramming plays a crucial role in T cell activation, differentiation, and function. Activated CD4+ T cells require high rates of glucose uptake and
glycolysis, glutaminolysis, and lipid synthesis to support prolif-eration and function (10–12, 34). We show, for what we believe is the first time, a detailed analysis of the metabolic programs underlying Teffs (Th1 and Th17) and Tregs. Both in vivo and in vitro, our data show that inflammatory Teffs and CD4+ Tregs have
distinct metabolic programs and dependencies. Specifically, Teffs are reliant on glycolysis, while Tregs have greater fuel flexibility and oxidize glucose in addition to lipids. While Th1 and Th17 have a similar need for glucose, metabolic differences in downstream pathways and regulation of each T cell subset allowed for selec-tive targeting of Th17 cells. Here, we identify PDHK as a selecselec-tive regulator of CD4+ T cell differentiation and inflammation and
show that PDHK inhibition specifically impairs Th17 while spar-ing Th1 and promotspar-ing Tregs.
Through detailed metabolic analyses, distinct programs were found for Th1 and Th17 cells and Tregs. Each subset expressed dif-ferent levels of metabolic enzymes and metabolites. While both Th1 and Th17 were highly glycolytic, Th17 cells had higher expres-sion levels of glycolytic genes and levels of glycolytic intermedi-ates. Th1 cells were also dependent on glycolysis, but appeared to regulate this pathway posttranscriptionally without accumula-tion of glycolytic intermediates. Glutamine metabolism may also be preferentially increased in Th17 cells. These metabolic dis-tinctions are consistent with differential regulatory mechanisms of Th1 and Th17, such as selective requirement of Th17 cells for HIF1α (14, 35). In contrast, Tregs were dependent on mitochondri-al metabolism and showed flexibility to oxidize lipids or glucose. While steady-state levels of metabolites do not necessarily reflect pathway flux rates, our combined data support a model in which Th1 and Th17 cells rely on glycolysis and potentially glutaminoly-sis, while Tregs oxidize pyruvate and lipids.
lipore), HK1 (Millipore), HK2 (Millipore), HK3 (Abcam), OXPHOS antibody cocktail (Abcam), CPT1A, cytochrome c (BD Biosciences), actin (Abcam), and PDHK1 (Abcam).
Metabolomics and acyl-carnitines. Nontargeted metabolomic anal-yses were performed as described using LC Q Exactive Mass Spec-trometer (LC-QE-MS) (Thermo Scientific) (24). Additional metabolo-mics analysis was performed using GC/MS and LC/MS/MS platforms (Metabolon Inc.) for determination of cellular metabolites. Data were then grouped by unsupervised clustering using MetaboAnalyst soft-ware. Samples were normalized using Bradford protein concentration and rescaled to set the median to 1. Missing values were imputed with the minimum value. Acyl-carnitines were measured by targeted flow injection–MS/MS, as previously described (43).
Metabolic assays. T cells were differentiated, and OCR and ECAR were analyzed using the XF24 Extracellular Flux Analyzer (Seahorse Bioscience). OCR and ECAR values were normalized to cell number. Glycolytic capacity was defined as the difference between ECAR fol-lowing the injection of 1 μM oligomycin (Seahorse Bioscience) and the basal ECAR reading (T cells cultured in base DMEM with no added glucose or glutamine). Glycolytic reserve was defined as the differ-ence in ECAR between the glucose and oligomycin injections. SRC was defined as the percentage increase in OCR between the initial basal readings (T cells cultured in base DMEM with 25 mM glucose added) and the injection of 500 nM of the ionophore FCCP (Seahorse Biosci-ence) to uncouple oxidative phosphorylation and electron transport. In some experiments, OCR and ECAR were measured in the presence of rotenone (5 nM) and 2DG (250 μM). Glycolytic flux and glucose and pyruvate oxidation were measured as previously described (44). Brief-ly, glycolytic flux was determined by measuring the detritiation of [3
H]-glucose. Glucose and pyruvate oxidation were measured by culture of cells in U-14C glucose or U-14C pyruvate to measure production of 14CO
2.
Viability and intracellular staining. The following antibodies were used: rat anti-mouse CD4+ Pacific Blue, IL-2 phycoerythrin (PE), IL-17
PE, IFN-γ APC, T-bet PE, RORγT PE, FoxP3 PE, and goat anti-rabbit PE (all from eBioscience). Cell death was measured by exclusion of
1 μg/ml propidium iodide. To measure intracellular cytokines, cells
were left unstimulated or stimulated for 4 to 5 hours with PMA (50 ng/ml, Sigma-Aldrich) and ionomycin (750 ng/ml, Calbiochem) in the presence of GolgiPlug (IL-2, IFN-γ, IL-17) or GolgiStop (IL-17), permeabilized using Cytofix/Cytoperm Plus (BD), then stained with the appropriate antibodies. Transcription factor staining to identify committed cells was performed using the Mouse Regulatory T Cell Staining Kit (eBioscience) and intracellular staining for T-bet, RORγT, or FoxP3. Intracellular staining for GLUT1 and HK2 was performed as previously described (13). Data were acquired on a MacsQuant Ana-lyzer (Miltenyi Biotec) and analyzed using FlowJo (TreeStar software). Lentiviral PDHK1 shRNA. PDHK1 shRNA–expressing and control lentiviruses were purchased from Sigma-Aldrich (puromycin resis-tance) or Origene (GFP-expressing). CD4+ T cells were isolated and
dif-ferentiated as described above and infected with PDHK1 shRNA or con-trol lentivirus 24 hours after activation. Polybrene (8 μg/ml) was added to facilitate the infection, and the cells were centrifuged for 90 minutes at 750 g. Where indicated, the cells were split 1:2 after 2 days and treated with 2 μg/ml puromycin for 2 days to select for infected cells.
T cell transfer model of colitis. Wild-type CD4+ T cells were
iso-lated as described above, and naive effector (CD4+CD25−CD45RBhi)
T cells were sorted (FACSVantage, BD Bioscience). Naive Teffs were
tion of ROS with the antioxidant NAC normalized IL-17 produc-tion. Therefore, PDHK selectively modulates the balance between Th17 cells and Tregs, in part through ROS generation.
Previous studies have described potential therapeutic strate-gies to modulate the balance between Teffs and Tregs. Each subset plays a different role in immunity, and it may be therapeutically useful to inhibit one of the subtypes without affecting the others. The finding that Th1 cells express little PDHK1 provides the poten-tial to fine tune CD4+ T cell differentiation and the immune
response. Inhibition of PDHK1 did not affect T-bet expression or IFN-γ production in Th1 cells, but suppressed RORγT and IL-17 production in vitro. In addition, treatment of mice with DCA in the context of IBD suppressed IL-17, but preserved IFN-γ, produc-tion. Our data therefore suggest that targeting PDHK1 inhibits Th17 differentiation and cytokine production while leaving Th1 unaffected. This may be important in the context of Th17-driven autoimmune disorders, where it would be favorable to suppress the Th17 lineage without affecting Th1 immunity. Overall, this work identifies key metabolic differences between the CD4+ T cell
subsets that establish PDHK1 as a selective regulator of the Th17/ Treg balance and inflammatory disease.
Methods
Mice. Six- to eight-week-old sex-matched C57BL/6J mice (Jackson Laboratory) were used for all experiments unless otherwise indicated.
T cell isolation and differentiation. Naive CD4+CD25– T cells were
isolated ex vivo, and T helper cell subsets were generated as described previously (13). Briefly, CD4+CD25– T cells were cultured on irradiated
(30 Gy) splenocytes with 2.5 μg/ml of anti-CD3 antibody at a ratio of 5:1 in RPMI 1640 media supplemented with 10% FBS, sodium pyru-vate, penicillin/streptomycin, HEPES, and β-mercaptoethanol. The following cytokines were added to generate each subset: Th1, 10 ng/ml IL-12 (R&D Systems), 10 μg/ml anti–IL-4 (eBioscience, clone 11B11), 1 μg/ml anti–IFN-γ (eBioscience); Th17, 20 ng/ml IL-6 (R&D Systems), 2.5 ng/ml TGF-β (R&D Systems), 10 μg/ml anti–IFN-γ; Tregs, 3 ng/ml TGF-β. On day 3 after stimulation, cells were split 1:2 and replated with 20 ng/ml IL-2 alone for an additional 2 days prior to analysis. In some experiments, cells were treated with 5 nM rotenone or 250 μM 2DG or labeled with CTV (Invitrogen) per the manufacturer’s instructions to assess cell proliferation.
qRT-PCR. RNA was isolated from naive (Th0), Th1, or Th17 cells or Tregs using RNeasy Plus Mini Kit (QIAGEN) following the manu-facturer’s instructions. 1 μg total RNA was subjected to single-strand
cDNA synthesis using the RT2 First Strand Kit (QIAGEN). In certain
experiments, the cDNA was used according to the manufacturer’s instructions (QIAGEN) in the mitochondrial energy metabolism and
glucose metabolism SuperArray RT2 Profiler PCR arrays or a custom
array designed to include metabolic genes in pathways important in T cell activation (QIAGEN, CAPM1256). The PCR arrays were assayed on the ViiA 7 Real-Time PCR System (Applied Biosystems). Data were
analyzed using the RT2 Profiler Program supplied by QIAGEN and
nor-malized to the reference genes TATA box-binding protein (Tbp) and β-glucuronidase (Bgu), as determined by GeNorm stability analysis.
(Mil-The Journal of Clinical Investigation
R e s e a R c h a R t i c l eDCA-treated mice were analyzed by 2-way ANOVA, and P < 0.05 was considered significant.
Study approval. All animal studies were approved by the Institu-tional Animal Care and Use Committee at Duke University and the Novartis Institutes for Biomedical Research review board.
Acknowledgments
We would like to acknowledge members of the Rathmell lab for support and helpful discussions and Marshall Nichols for techni-cal assistance. This work was supported by grants from the Ken-neth Rainin Foundation (to J.C. Rathmell), the Leukemia and Lymphoma Society (to J.C. Rathmell), the Crohn’s and Colitis Foundation of America (Senior Research Award to J.C. Rathmell; postdoctoral fellowship 284879 to A.N. Macintyre), the Alliance for Lupus Research (Target Identification in Lupus to J.C. Rath-mell), and the National Multiple Sclerosis Society (RG4536-A-1 to M.L. Shinohara)and by NIH grants R01HL108006 (to J.C. Rath-mell), R56AI102074 (to J.C. RathRath-mell), R00CA168997 (to J.W. Locasale), and R01AI110613 (to J.W. Locasale).
Address correspondence to: Jeffrey Rathmell, DUMC Box 3813, Duke University Medical Center, Durham, North Carolina 27710, USA. Phone: 919.681.1084; E-mail: [email protected].
injected i.p. into 6- to 8-week-old C57BL/6 Rag1−/− recipients (Jackson
Laboratories) (4 × 10⁵ cells/mouse). Mice were given normal water or
treated with 2 g/l DCA in the drinking water throughout the course of the experiment. Two weeks after T cell transfer, mice were given 200 ppm piroxicam (Sigma-Aldrich) in powdered rodent chow for 5 days to disrupt the intestinal barrier and initiate disease (31).
EAE. EAE was induced as previously described (45). Briefly,
wild-type mice were injected with 100 ng MOG35–55 peptide (New England
Peptide) mixed with CFA, including heat-killed Mycobacterium tuber-culosis (Sigma-Aldrich) followed by 200 ng pertussis toxin adminis-tered by i.p injection on days 0 and 2. Vehicle or DCA (2 g/l) was given to the mice in their drinking water. Clinical signs of EAE were assessed according to the following score: 0, no signs of disease; 1, loss of tone in the tail; 2, hind limb paresis; 3, hind limb paralysis; 4, tetraplegia. Lymphocyte infiltration and spinal cord demyelination were assessed in sections of spinal cords from mice stained with H&E and LFB as previously described (46). In select experiments, splenocytes from 2D2 mice with TCR transgenic T cells specific for MOG were stimu-lated with 20 μg/ml MOG peptide and 0.5 ng/ml IL-12 in vitro for 48 hours and then transferred into Rag1–/– recipients to induce EAE. T cells were then isolated from spinal cord for qRT-PCR.
Statistics. Data were analyzed using a 2-tailed Student’s t test, and P < 0.05 was considered significant. For the EAE model, vehicle and
1. Zhu J, Yamane H, Paul WE. Differentiation of effector CD4 T cell populations. Annu Rev
Immu-nol. 2010;28:445–489.
2. Buckner JH. Mechanisms of impaired regulation by CD4CD25(+)FOXP3(+) regulatory T cells in human autoimmune diseases. Nat Rev Immunol. 2010;10(12):849–859.
3. Cua DJ, et al. Interleukin-23 rather than inter-leukin-12 is the critical cytokine for autoim-mune inflammation of the brain. Nature. 2003;421(6924):744–748.
4. Yen D, et al. IL-23 is essential for T cell-mediated colitis and promotes inflammation via IL-17 and IL-6. J Clin Invest. 2006;116(5):1310–1316. 5. Serody JS, Hill GR. The IL-17 differentiation
path-way and its role in transplant outcome. Biol Blood
Marrow Transplant. 2012;18(1 suppl):S56–S61.
6. Vander Heiden MG, Cantley LC, Thompson CB. Understanding the Warburg effect: the meta-bolic requirements of cell proliferation. Science. 2009;324(5930):1029–1033.
7. Fox CJ, Hammerman PS, Thompson CB. Fuel feeds function: energy metabolism and the T-cell response. Nat Rev Immunol. 2005;5(11):844–852. 8. Frauwirth KA, et al. The CD28 signaling
path-way regulates glucose metabolism. Immunity. 2002;16(6):769–777.
9. Maciver NJ, Jacobs SR, Wieman HL, Wofford JA, Coloff JL, Rathmell JC. Glucose metabo-lism in lymphocytes is a regulated process with significant effects on immune cell function and survival. J Leuk Biol. 2008;84(4):949–957. 10. Jacobs SR, et al. Glucose uptake is limiting in T
cell activation and requires CD28-mediated Akt-dependent and inAkt-dependent pathways. J
Immu-nol. 2008;180(7):4476–4486.
11. Sinclair LV, Rolf J, Emslie E, Shi YB, Taylor PM, Cantrell DA. Control of amino-acid transport
by antigen receptors coordinates the metabolic reprogramming essential for T cell differentia-tion. Nat Immunol. 2013;14(5):500–508. 12. Wang R, et al. The transcription factor Myc
con-trols metabolic reprogramming upon T lympho-cyte activation. Immunity. 2011;35(6):871–882. 13. Michalek RD, et al. Cutting edge: distinct glyco-lytic and lipid oxidative metabolic programs are essential for effector and regulatory CD4+ T cell
subsets. J Immunol. 2011;186(6):3299–3303. 14. Shi LZ, et al. HIF1alpha-dependent glycolytic
pathway orchestrates a metabolic checkpoint for the differentiation of TH17 and Treg cells. J Exp
Med. 2011;208(7):1367–1376.
15. Kaplon J, et al. A key role for mitochon-drial gatekeeper pyruvate dehydrogenase in oncogene-induced senescence. Nature. 2013;498(7452):109–112.
16. Hitosugi T, et al. Tyrosine phosphorylation of mitochondrial pyruvate dehydrogenase kinase 1 is important for cancer metabolism. Mol Cell. 2011;44(6):864–877.
17. Korotchkina LG, Patel MS. Site specificity of four pyruvate dehydrogenase kinase isoen-zymes toward the three phosphorylation sites of human pyruvate dehydrogenase. J Biol Chem. 2001;276(40):37223–37229.
18. Michelakis ED, et al. Metabolic modulation of glioblastoma with dichloroacetate. Sci Transl
Med. 2010;2(31):31ra4.
19. Bian L, et al. Dichloroacetate alleviates develop-ment of collagen II-induced arthritis in female DBA/1 mice. Arthritis Res Ther. 2009;11(5):R132. 20. Eleftheriadis T, et al. Dichloroacetate at
thera-peutic concentration alters glucose metabolism and induces regulatory T-cell differentiation in alloreactive human lymphocytes. J Basic Clin
Physiol Pharmacol. 2013;24(4):271–276.
21. Ostroukhova M, et al. The role of low-level lactate production in airway inflammation in asthma. Am J Physiol Lung Cell Mol Physiol. 2012;302(3):L300–L307.
22. Chang CH, et al. Posttranscriptional control of T cell effector function by aerobic glycolysis. Cell. 2013;153(6):1239–1251.
23. Sena LA, et al. Mitochondria are required for antigen-specific T cell activation through reactive oxygen species signaling. Immunity. 2013;38(2):225–236.
24. Liu X, Ser Z, Locasale JW. Development and quantitative evaluation of a high-resolution metabolomics technology. Anal Chem. 2014;86(4):2175–2184.
25. Schooneman MG, Vaz FM, Houten SM, Soeters MR. Acylcarnitines: reflecting or inflicting insu-lin resistance? Diabetes. 2013;62(1):1–8. 26. Kato M, Li J, Chuang JL, Chuang DT. Distinct
structural mechanisms for inhibition of pyruvate dehydrogenase kinase isoforms by AZD7545, dichloroacetate, and radicicol. Structure. 2007;15(8):992–1004.
27. Mougiakakos D, Johansson CC, Kiessling R. Nat-urally occurring regulatory T cells show reduced sensitivity toward oxidative stress-induced cell death. Blood. 2009;113(15):3542–3545. 28. Won HY, et al. Ablation of peroxiredoxin II
atten-uates experimental colitis by increasing FoxO1-induced Foxp3+ regulatory T cells. J Immunol. 2013;191(8):4029–4037.
29. Kim HR, et al. Attenuation of experimental colitis in glutathione peroxidase 1 and catalase double knockout mice through enhancing regulatory T cell function. PLoS One. 2014;9(4):e95332. 30. Mougiakakos D, Johansson CC, Jitschin R,
regula-tory T cells confers enhanced tolerance to oxida-tive stress. Blood. 2011;117(3):857–861. 31. Hale LP, Gottfried MR, Swidsinski A. Piroxicam
treatment of IL-10-deficient mice enhances colonic epithelial apoptosis and mucosal expo-sure to intestinal bacteria. Inflamm Bowel Dis. 2005;11(12):1060–1069.
32. Ivanov, et al. The orphan nuclear receptor ROR-gammat directs the differentiation program of proinflammatory IL-17+ T helper cells. Cell.
2006;126(6):1121–1133.
33. McGeachy MJ, Stephens LA, Anderton SM. Natu-ral recovery and protection from autoimmune encephalomyelitis: contribution of CD4+CD25+
regulatory cells within the central nervous sys-tem. J Immunol. 2005;175(5):3025–3032. 34. Kidani Y, et al. Sterol regulatory element-binding
proteins are essential for the metabolic program-ming of effector T cells and adaptive immunity.
Nat Immunol. 2013;14(5):489–499.
35. Dang EV, et al. Control of T(H)17/T(reg) bal-ance by hypoxia-inducible factor 1. Cell. 2011;146(5):772–784.
36. van der Windt GJ, et al. Mitochondrial respira-tory capacity is a critical regulator of CD8+
T cell memory development. Immunity. 2012;36(1):68–78.
37. Sukumar M, et al. Inhibiting glycolytic metabolism enhances CD8+ T cell
mem-ory and antitumor function. J Clin Invest. 2013;123(10):4479–4488.
38. Stockwin LH, et al. Sodium dichloroacetate selec-tively targets cells with defects in the mitochon-drial ETC. Int J Cancer. 2010;127(11):2510–2519. 39. Sun RC, Fadia M, Dahlstrom JE, Parish CR, Board
PG, Blackburn AC. Reversal of the glycolytic phenotype by dichloroacetate inhibits metastatic breast cancer cell growth in vitro and in vivo.
Breast Cancer Res Treat. 2010;120(1):253–260.
40. Sutendra G, Michelakis ED. Pyruvate dehydro-genase kinase as a novel therapeutic target in oncology. Front Oncol. 2013;3:38.
41. Garon EB, et al. Dichloroacetate should be con-sidered with platinum-based chemotherapy in hypoxic tumors rather than as a single agent in advanced non-small cell lung cancer. J Cancer Res
Clin Oncol. 2014;140(3):443–452.
42. Gong F, et al. Dichloroacetate induces protective autophagy in LoVo cells: involvement of cathep-sin D/thioredoxin-like protein 1 and Akt-mTOR-mediated signaling. Cell Death Dis. 2013;4:e913. 43. An J, et al. Hepatic expression of malonyl-CoA
decarboxylase reverses muscle, liver and whole-animal insulin resistance. Nat Med. 2004;10(3):268–274.
44. Caro-Maldonado A, et al. Metabolic reprogram-ming is required for antibody production that is suppressed in anergic but exaggerated in chronically BAFF-exposed B cells. J Immunol. 2014;192(8):3626–3636.
45. Michalek RD, et al. Estrogen-related receptor-alpha is a metabolic regulator of effector T-cell activation and differentiation. Proc Natl Acad Sci
U S A. 2011;108(45):18348–18353.
46. Inoue M, Williams KL, Gunn MD, Shinohara ML. NLRP3 inflammasome induces chemotactic immune cell migration to the CNS in experimen-tal autoimmune encephalomyelitis. Proc Natl