ISSN: 1992-8645 www.jatit.org E-ISSN: 1817-3195
CERTAIN ANALYSIS ON EEG FOR THE DETECTION
OF EOG ARTIFACT USING SYMLET WAVELET
K.YASODA1, 2 DR.A.SHANMUGAM 1
Research scholar & Associate Professor, 2 Professor
1
Dr.N.G.P.Institute Of Technology, Department of Biomedical Engineering, Coimbatore, India
2
SNS College Of Technology , Department of ECE, Coimbatore, India
E-mail: [email protected] , [email protected]
ABSTRACT
This paper presents a statistical method for identification of ocular artifacts in the electroencephalogram (EEG) records. The occurrence of artifacts in EEG signals is due to various factors, like power line interference, EOG (electro-oculogram) and ECG (electrocardiogram). The identification of ocular artifact from scalp EEGs is mandatory for both the automated and visual analysis of underlying brainwave activity. These noise sources increase the difficulty in analyzing the EEG and obtaining clinical information. For this reason, it is necessary to design a procedure to decrease such artifacts in EEG records. Here for identification of ocular artifacts, the Stationary Wavelet Transform (SWT) with symlet as a basis function is used and without using the reference of EOG channel the artifacts has been identified. Using this statistical approach, the artifact ocular zones are very easily identified.
Keywords: EEG, ARTIFACTS, EOG, SACCADES , SWT
1. INTRODUCTION
The electrical activity on the brain is recorded by electroencephalogram (EEG) through the electrodes placed on the scalp of person. Electroencephalogram is a valuable tool for
clinicians in numerous applications, from the diagnosis of neurological disorders, to the clinical monitoring of depth of anesthesia. The eye movements and eye blinks mostly contaminate the EEG signal. There are lots of variations in the EEG signal in terms of shape, frequency, amplitude. If the amplitude of EEG signal is below 20 μV, then it is considered as low, if the amplitude is between 20 μV-50 μV, it is considered as medium and if amplitude is above 50 μV then it is considered as high.
When human eye blinks or moves, there is an electric field created which are two orders of magnitude greater than the desired electrical activity. The EEG signal is distorted and masked by the electric field which propagates across the scalp. The eye blink artifact has 10 time larger amplitude than the electrical signals originating from cerebral cortex which is defined as the electrical activity associated with the eye movement (EOG artifact)[2]. These artifacts increase the difficulty in analyzing the EEG and obtaining clinical information. [5]
1.1 EEG Waveform
The electroencephalogram (EEG) is the recording of the electrical activity occurring at the surface of the brain. This activity appears on the screen of the EEG machine as waveforms of varying frequency and amplitude measured in voltage (specifically micro voltages). [3]
Figure:1.Normal EEG Waveform
The EEG signals are measured from peak to peak and it is normally range from 0.5 to 100μV in amplitude, and also about 100 times lower than ECG signals. Although the spectrum is continuous, ranging from 0 Hz up to one half of sampling frequency, the brain state of the individual may make certain frequencies more dominant. [4]
1.2. Wavelet Transform
functions constructed from translations and dilations of a single function called the "mother wavelet" ψ(t). [1]
They are defined by
The parameter a is the scaling parameter or scale, and it measures the degree of compression. The parameter b is the translation parameter which determines the time location of the wavelet. If |a| < 1, then the wavelet is the compressed version (smaller support in time- domain) of the mother wavelet and corresponds mainly to higher frequencies. On the other hand, when |a| > 1, then ψa, b(t) has a larger time-width than ψ (t) and corresponds to lower frequencies. Thus, wavelets have time- widths adapted to their frequencies. This is the main reason for the success of the Morlet wavelets in signal processing and time-frequency signal analysis.[1]
1.3 Wavelets for Analyzing EEG Signals
Wavelet transform has emerged as one of the superior techniques in analyzing non-stationary signals like EEG. It can transform a time domain signal into time and frequency localization and provides the better understanding of a signal. The Discrete Wavelet Transform (DWT) means, choosing subsets of the scales ‘j’ and positions ‘k’ of the mother wavelet ψ (t).
Choosing scales and positions are based on powers of two, which are called dyadic scales and positions ( j and k are integers ). Equation (1) shows that, it is possible to build a wavelet for any function by dilating a function ψ (t) with a coefficient 2j, and translating the resulting function on a grid whose interval is proportional to 2–j. Contracted (compressed) versions of the wavelet function match the high-frequency components, while dilated (stretched) versions match the low- frequency components. Then, by correlating the original signal with wavelet functions of different sizes, the details of the signal can be obtained at several scales. These correlations with the different wavelet functions can be arranged in a hierarchical scheme
called multi-resolution decomposition. The multi- resolution decomposition algorithm [1] separates the signal into “details” at different scales and a coarser representation of the signal named “approximation“.[5]
The basic DWT algorithm can be modified to give a SWT that no longer depends on the choice of origin. As a consequence of the sub sampling operations in the pyramidal algorithm, the DWT does not preserve translation invariance.
This means that, a translation of the original signal does not necessarily imply a translation of the corresponding wavelet coefficients. The SWT has been introduced in order to preserve this property. Instead of sub sampling, the SWT utilizes recursively dilated filters in order to halve the bandwidth from one level to another. This decomposition scheme is shown in fig.[5]
Figure.2 Wavelet Decomposition Scheme
1.4 EOG Artifact detection
The slow response of thresholding, failure to detect fast eye blinks and the lack of an effective de-noising technique forced researchers to study the frequency characteristics of the EEG as well. The method of dealing with ocular artifact in the EEG, focusing on the relative merits of a variety of EOG correction procedures. The distinction between frequency and time domain approaches, the number of EOG channels required for adequate correction, estimating correction coefficients from raw versus averaged data, differential correction of different types of eye movement, the most suitable procedure for estimating correction coefficients, the use of calibration trials for estimation of correction coefficients, and the distinction between ‘coefficient estimation’ and ‘correction phase’ error are also discussed.[5]
1.5 EOG Artifacts
-78.7±23.6 (‘short’ horizontal saccades), -129.6±9.4 (‘long’ horizontal saccades), -71.08±19.5 (‘short’vertical saccades), -86.8±32.02 (‘long’ vertical saccades), -403.5±68.04 (blinks).[6]
2. REVIEW OF LITERATURE
The corruption of EEG by different kinds of artifacts such as eye movements and blinks caused improper diagnosis and analysis of EEG. The artifact may affect the detection of EEG data of interest and obstruct the analysis of EEG recordings.
2.1existing Method
The traditional method of the eye-blink suppression is the removal of the segment of EEG data in which eye blinks occur. The spectrum of ocular electrical activity is typically characterized by few predominant low-frequency components.
Eye blinks are usually detected by means of data recorded from electrodes placed above and below the subject’s eye. An eye blink is said to have occurred if the signal amplitude exceeds a given threshold. All EEG segments in which eye blinks take place are then removed [5].
2.2 Limitation
A number of methods have been proposed for EOG artifact correction from EEG. Due to the limitation of EEG signal recording technology, physiological artifacts,especially those generated by eye with EEG, may change the characteristics of the neurological events in EEG [5]
2.3 Proposed Method
Recent Independent Component Analysis (ICA) method of artifact removal requires a tedious visual classification of the components. P. LeVan proposed a method which automates this process and removes multiple types of artifacts simultaneously [4].
To overcome this complexity, a statistical method to remove the ocular artifacts using Stationary Wavelet Transform (SWT) without the reference of EOG channel and applying a new threshold formula for removing ocular artifacts in EEG signals is presented. In order to remove the ocular artifacts, two techniques have been utilized namely joint approximate diagonalization of eigen matrices (JADE) and wavelet transform. In the present method, the EEG signal using stationary wavelet transform with Symlet (sym3) as a basis function is directly decomposed. Using the statistical approach,
coefficient of variation, the artifact ocular zones are very easily identified. The new threshold formula removes entire artifacts in the zones [4]
2.4 Software Used
Wavelet transforms are a mathematical means to perform signal analysis when signal frequency varies over time [4].
MATLAB 7.10 software with Wavelet Tool boxes is used in analysis process.
3. METHODOLOGY
This statistical method is a combination of independent component analysis (ICA) and wavelet denoising in order to remove the ocular artifacts from EEG.[5]
The EEG is recorded by placing using 10-20 electrodes system. Before placing the electrodes the scalp is cleaned and electrode are placed after applying electrode paste to reduce contact impedance to less than 10kΩ.The EEG is the broken into sections or epochs for the purpose of feature extraction.
The method proposed in this paper involves the following steps:
i. To apply stationary wavelet transform to the contaminated EEG signals and decompose it up to eight levels with Symlet (Sym3) as a basis function.
ii. To identify the spikes in the contaminated EEG at each level. iii. To identify the ocular artifact spike zones using coefficient of variation, a statistical approach.
iv. To apply de-noising technique– To fix the suitable threshold value and threshold function for the artifact zones.
The block diagram of the proposed EOG identification method is as follows, [7]
3.1 EEG Recording and Data collection
The placement of gold cup electrodes is based on 10-20 international electrode system which says that the distance between the adjacent electrodes is 10% or 20 % of the total distance on the scalp.[2]
Figure 4 Compressed EEG Signal
In the first stage of parameter analysis, the EEG signals of patients who are free of neurological disorder were analyzed and clearly understood their characteristics and clinical significance. The compressed EEG signal is shown above. This compressed EEG signal may have the artifacts. There are lots of variations in the EEG signal in terms of shape, frequency, amplitude. If the amplitude of EEG signal is below 20 μV, then it is considered as low, if the amplitude is between 20 μV-50 μV, it is considered as medium and if amplitude is above 50 μV then it is considered as high.
3.2 Preprocessing
Preprocessing includes filtering. In this, noise added input signal is considered. Maximum frequency of input signal is 0.5 Hz to 100 Hz. As sampling frequency is twice the maximum frequency therefore it is equal to 250 Hz. So after sampling a normalized signal is obtained. The signal passes through LPF. Also amplification is done to the input signal of low amplitude. The EEG and EOG data was band pass filtered with a broadband anti-aliasing filter from 0.5 to 100 Hz and a 50 Hz notch filter, sampled with 250 Hz and 12 bit quantization. The dynamic ranges for EEG and EOG were ±100 mV and ±1 mV, respectively.
The digital EEG signal is stored electronically and can be filtered. Typical settings for the HPF and a LPF are 0.5-1 Hz and 35–70 Hz, respectively. The high-pass filter filters out slow artifact, such as electrogalvanic signals and movement artifact,
[image:4.595.315.497.204.342.2]whereas the low-pass filter filters out high-frequency artifacts, such as electromyographic signals. An additional notch filter is typically used to remove artifact produced by electrical power lines (50 Hz).[5]
Figure 5 Sampled EEG Signal
3.3 Identifying Spikes
The spikes caused due to rapid eye blinks and movements and the EEG signal could be used along with a simultaneous recording of the EOG to detect and remove the artifacts. The accurate detection of these artifacts by singular observation of the time or frequency domains fails and hence wavelet transform can be used to study the time- frequency maps of the EOG contaminated EEG.[7]
A method for identifying the spikes which may contain artifact are not is proposed. From the number of ‘detail’ coefficients obtained at each level of wavelet decomposition, we select the detail coefficients in the form, dj> dj-1, dj+ , j=
1,2,...n is selected. Normally, every spike contains three coefficients. Next spike identification starts with dj+1 treated as d j−1and checks the next two
coefficients. Based on this arrangement, the spikes in the contaminated EEG have to be identified. On decomposing this with a Symlet wavelet (sym3 – up to eight levels), the final ‘detail’ yielded the waveform.[5]
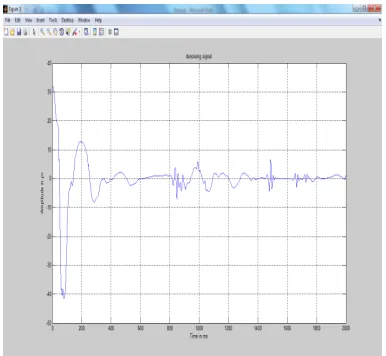
Figure 6 Denoised EEG Signal With Artifact
3.4 Identifying ocular artifact spike zones
After decomposing the EEG signal, at every level, the ‘detail’ part is considered. However, one can also retain the “approximation’ part for the signal reconstruction. Using the spike zone coefficients (dj,dj-1, dj+1), the coefficient of variation for every
spike zone is calculated. Among the coefficient of variation values, the larger values have to be selected. Since larger coefficient of variation indicates less reliable or high frequency (noise) amplitude.
A epoch of 10 second is considered for the purpose storing data and analysis. In the EOG contaminated EEG epoch (sampled at a rate of 128 samples/second) it is seen that the EOG artifacts exist between .5-50ms microseconds as the amplitude exceeds above 30µV [5].
Figure 7 Identification Of EOG Artifact Zones
4. CONCLUSION
Artifacts were adequately attenuated, without removing significant and useful information. It is concluded that the proposed method gives less complexity and easier identification of the artifacts with the help of wavelet decomposition and is an efficient technique for improving the quality of EEG signals in biomedical signal analysis
REFERENCES:
[1] Burhan Ergen, “Signal and Image Denoising Using WaveletTransform” Fırat University Turkey.Kali vara prasad Naraharisetti,
[2] “Removal of Ocular Artifacts from EEG Signal using Joint Approximate Diagonalization of Eigen Matrices (JADE) and Wavelet Transform”, Canadian Journal on Biomedical Engineering & Technology,2010, Vol. 1, No. 4,pp.56-60.
[3] V. Krishnaveni, Automatic Identification and Removal of Ocular Artifacts from EEG using Wavelet Transform Measurement Science Review, 2006, Volume 6, Section 2, No. 4. [4] Moretti et al., “Computerized processing of
EEG– EOG–EMG artifacts for multicentric studies in EEG oscillations and event-related potentials”, International Journal of Psychoph siology 47, 2003, pp. 199–216. [5] Senthil Kumar et al., “Removal of Ocular
Artifacts in the EEG through Wavelet Transform without using an EOG Reference Channel”, Int. J. Open Problems Compt. Math., 2008, Vol. 1, No. 3, pp. 188-200. [6] Shah Aqueel Ahmed et al.,
“
Detection andElimination of Ocular Artifacts from EEG Data Using Wavelet Decompositio