WRL
Research Report 89/3
Precise Robotic
Paste Dot Dispensing
research relevant to the design and application of high performance scientific computers. We test our ideas by designing, building, and using real systems. The systems we build are research prototypes; they are not intended to become products.
There is a second research laboratory located in Palo Alto, the Systems Research Cen-ter (SRC). Other Digital research groups are located in Paris (PRL) and in Cambridge, Massachusetts (CRL).
Our research is directed towards mainstream high-performance computer systems. Our prototypes are intended to foreshadow the future computing environments used by many Digital customers. The long-term goal of WRL is to aid and accelerate the development of high-performance uni- and multi-processors. The research projects within WRL will address various aspects of high-performance computing.
We believe that significant advances in computer systems do not come from any single technological advance. Technologies, both hardware and software, do not all advance at the same pace. System design is the art of composing systems which use each level of technology in an appropriate balance. A major advance in overall system performance will require reexamination of all aspects of the system.
We do work in the design, fabrication and packaging of hardware; language processing and scaling issues in system software design; and the exploration of new applications areas that are opening up with the advent of higher performance systems. Researchers at WRL cooperate closely and move freely among the various levels of system design. This allows us to explore a wide range of tradeoffs to meet system goals.
We publish the results of our work in a variety of journals, conferences, research reports, and technical notes. This document is a research report. Research reports are normally accounts of completed research and may include material from earlier technical notes. We use technical notes for rapid distribution of technical material; usually this represents research in progress.
Research reports and technical notes may be ordered from us. You may mail your order to:
Technical Report Distribution
DEC Western Research Laboratory, UCO-4 100 Hamilton Avenue
Palo Alto, California 94301 USA
Reports and notes may also be ordered by electronic mail. Use one of the following addresses:
Digital E-net: DECWRL::WRL-TECHREPORTS
DARPA Internet: [email protected]
CSnet: [email protected]
UUCP: decwrl!wrl-techreports
Paste Dot Dispensing
William R. Hamburgen
February, 1989
Many electronic assembly processes require dispensing small dots of heavily filled materials such as solder paste and loaded epoxies. Methods were developed for rapidly optimizing processes that control the size and shape of such dots. The approach was to separate the process of making a known quantity of material appear at the dispense tip from the process of depositing that material on the workpiece. It was found that controlling dot mass depends primarily on understanding valve frequency response, and that the shape of the dot is primarily a function of the height from which it is released. This report describes how a paste dot is dispensed, presents data from a series of characterization experiments, and discusses how to apply what was learned to a broad range of materials, equipment and processes.
This is a preprint of a paper that will be presented at the
39th Electronic Components Conference,
IEEE/CHMT and EIA, Houston, Texas, May 22-24, 1989.
assemblies and chip packaging, it is used for die attach, bonding passive components, encap-sulation, fluxing, and heat sink attachment. In the assembly of circuit boards it is used to mask holes, bond surface mounted components, and to place solder paste on pads. Stenciling, screen-ing, or preforms can often be used for some of these operations, but for small or mixed builds the tooling and its associated cost, lead time, and management can be an onerous burden. For plac-ing materials inside cavities or recesses, on partially populated circuit assemblies, or for makplac-ing repairs, dispensing may be the only alternative.
Given the widespread use of both manual and robotic dispensing, it is surprising how little has been published on precisely controlling the process. One reason may be that in many production environments, dispensing operations use the same materials for the same task day in and day out; skilled operators are able to make the necessary adjustments as required. Our dispensing robot was purchased for process development and infrequent, small builds in our laboratory. In this environment, the materials used and tasks performed were in a constant state of change. Some of the processes of interest required close control of the amount dispensed, the shape of the deposit, and its location. To meet these needs, it became necessary to develop methods for rapid process characterization and optimization, and to understand non-ideal behavior and perfor-mance limitations.
This paper describes how a paste dot is dispensed, presents data from a series of characteriza-tion experiments, and discusses how to apply what was learned to a broad range of materials, equipment, and processes. The work focused primarily on depositing milligram range dots of heavily loaded pastes such as solder paste for surface mounting components, and heavily filled epoxies for heatsink and die attach. These materials are typically 80-90% solids by weight. They have high apparent viscosities, which makes them difficult to dispense. Many also have a tendency to separate, thicken, or otherwise change properties during the course of a run. Tradi-tional syringe dispensing, which relies on timed pulses of air, is difficult to control with these materials. Instead, a pneumatically actuated peristaltic positive displacement valve was used.
shot mass, controlling dot shape is reduced to managing the needle tip motion as the dot is placed, in particular the distance above the workpiece when it is released. Dot diameter and height were measured to understand this dependency. A number of experiments were also per-formed to explore the opportunities for high speed valve operation.
2. Models of Paste Dot Dispensing
2.1. Ideal Valves
To appreciate the performance limitations of real dispense valves, two ideal cases are first considered: the ideal timed valve and the ideal one-shot valve. With an ideal timed valve, the quantity dispensed is proportional to the duration of the valve ON command. Real timed valves exhibit non-ideal behavior starting and stopping, and are sensitive to variations in material properties and other parameters. A real valve can, however, sometimes approach the ideal. If the material has stable properties, if valve parameters are well controlled and if the command lasts long enough that starting and stopping effects are small, the amount dispensed will be very nearly proportional to the ON command duration.
For an ideal one-shot valve, the quantity dispensed is independent of the duration of the valve ON command; a shot of fixed size is released each time the ON command is given. Real one-shot valves have finite delivery rates and will be unable to deliver the full amount if the com-mands are too short or come in too rapid succession. For very short command pulses, the amount delivered may depend on the command signal duration much like a timed valve.
2.2. Process Partitioning
The goal of dispense process development is to be able to place dots of controlled size and shape at specified locations on the workpiece. This is done by partitioning the process develop-ment into two steps: characterizing the valve, then characterizing the dispensing robot. The details of the characterization depend somewhat on the particular hardware. Our experiments use a pneumatically actuated one-shot valve with a micrometer adjustment for shot size, mounted on a cartesian 3-axis robot. With this equipment, the characterization steps are:
•determine valve displacement (micrometer adjustment) range;
•determine valve timing limits (including effects of paste properties, reservoir and valve pressures, etc);
•determine relationship between dispense height and dot shape;
•investigate high-speed operation as a timed shot valve.
2.3. Quantity per Shot
The first two steps of dispense process characterization involve controlling the quantity of material dispensed each time the valve is actuated. This quantity can be defined as either a mass or a volume of material. Both are important; a valve that operates on volumetric displacement principles may be used to make dots of controlled mass. Since mass = volume×density, if any
two are known, the third can be determined.
As a practical matter, it is the mass or weight of a set of dots that can most easily be measured. This is done by taring (weighing) a microscope slide on a lab scale, dispensing onto it, weighing again, and dividing by the number of shots. With small shots and typical lab scales, it is neces-sary to dispense multiple shots for reasonable accuracy.
Volume could also be used as the measure of shot quantity, but this is difficult to do ac-curately. The volume of an individual shot can be determined by optical measurement. This is most easily accomplished as the shot hangs from the dispense tip where it is basically cylindri-cal; it becomes much more difficult once it has been deformed by contact with the workpiece. Volume measurement should be used only when necessary, as in the case of high-speed timed-shot mode experiments.
The density of a material is also difficult to accurately determine. It can be measured by placing a sample in a series of liquids of varying density and observing whether the sample sinks or floats. Of course the liquids must not affect the sample. The density can also be measured by weighing a filled syringe and measuring its plunger position periodically as the material is used. It can then be calculated from the barrel ID (inside diameter) and the mass change.
2.4. Depositing a Controlled Amount
Even if a predictable amount of paste exits the dispense tip each time the valve is cycled, the amount that ends up on the workpiece can vary if the paste is not properly deposited. The most common strategy is to move the tip down to the workpiece, cycle the valve, and withdraw, leav-ing the dot behind. There are many reasons why this might not work as intended. The process of separating the dot from the tip depends on the balance of forces acting on the paste: the ad-hesive force between paste and workpiece must be greater than the sum of the adad-hesive force between paste and dispense tip plus the cohesive forces in the paste adjacent to the tip. Gravity plays a negligible role.
If the valve is cycled at too great a height, the material will not reach the workpiece and will
*
be carried by the dispense tip to the location of the next dot. When the valve is cycled again, a double sized dot will be placed. The process repeats, alternating between no dot and a double sized dot. This skipping phenomenon sets a hard upper bound on the height from which a dot can be dispensed. This height can be estimated by calculating the length of material that will extruded from the tip at each shot.
Even if the paste does touch the substrate, it might not separate cleanly from the tip. The adhesive force between paste and workpiece is proportional to the area of contact. If the pense tip to workpiece distance is small enough, the dot flattens against the surface as it is dis-pensed, increasing the area of contact and the adhesive force. For a given dispense tip, paste, and substrate, there will be a maximum tip to workpiece distance that yields a clean separation. If this distance is exceeded, erratic dots result, typically in an alternating small-dot/large-dot pat-tern rather than in the no-dot/double-dot patpat-tern which occurs at still greater heights.
If the tip contacts the workpiece surface, the paste cannot get out; this certainly a lower bound on dispense height. A more realistic lower bound is due to another mechanism. As the dots are released progressively closer to the workpiece, they flatten and their diameter increases. Since the flattening occurs primarily adjacent to the workpiece, the adhesive force between paste and workpiece increases, while the adhesive forces between paste and dispense tip and the cohesive forces in the paste adjacent the tip remain largely unaffected. The situation deteriorates only when the dispense height becomes sufficiently low, so that the top of the dot begins to contact and adhere to the bottom and outside surfaces of the dispense tip. When the tip retracts, material may adhere erratically to the tip’s outside surfaces, with an attendant loss of shot size (and shape) control.
Controlling the dispense height within these limits insures that each site gets the same amount of material. For a given shot size, these bounds vary with paste properties (stickiness, viscosity, thixotropy), dispense tip characteristics (inside diameter, shape of bottom and sides, non-stick surfaces), and perhaps the dwell time (allowing the material more time to slump into contact with the workpiece). While within these bounds the amount will be consistent, the shape of the dot will depend on the release height.
*One could imagine using the acceleration during tip retraction as the primary means of separating the material
2.5. Controlling Dot Shape
Being able to reliably place a controlled amount of material at a specific location is enough for applications where the shape of the deposit does not affect its function. But in many cases, the shape does matter. For example, dots for surface mount solder joints must not cause shorts to adjacent pads by having excessive diameter or by being so tall they fall over. The shape of a dot is determined by:
•material properties;
•dispense tip shape and dimensions;
•shot size;
•height from which the dot is dispensed.
The material can be the dominant factor; if it has low viscosity and/or it exhibits aggressive wetting of the workpiece, the result can be a puddle regardless of other factors. If it has high viscosity and/or thixotropic behavior (high static viscosity and low dynamic viscosity), the dot shape can be controlled. For the remainder of the discussion, it will be assumed that shot size is fixed and that a cylindrical dispense tip is used. This leaves tip inside diameter and drop height as the parameters at our disposal for controlling dot shape.
Dots tend to flatten against the workpiece as they are dispensed. As the tip withdraws, the material near the end of the needle necks before breaking free. This results in dots with shapes ranging from high aspect ratio cones for large drop heights, to hemispherical or even flat circular shapes when the dot is released close to the workpiece. Small ID needles are expected to be needed for the highest aspect ratios. At lower dispense heights, the needle ID is expected to be less influential; dot spreading against the workpiece will dominate. Whatever tip is used, control of dot shape requires dispense height control. Various approaches to controlling dispense height in this world of warped, imperfectly fixtured workpieces will be discussed in the section on ap-paratus.
It is an interesting exercise to compare the volume of several radially symmetric geometric solids that approximate typical dot shapes:
1 2
cone: V = /3πR H;
2 2
hemisphere: V = /3πR H (where H = R);
2
cylinder: V =πR H;
where: V = volume, R = radius, and H = height.
3. Apparatus
3.1. Dispense Valve
Like ideal valves, real valves fall into two classes: one-shot and timed. By sending strings of pulses, one-shot valves can mimic timed valves; however, they are usually used only for dots, while timed valves are used for dots, volumetric fill, beads, and area fill. The most common type of dispense equipment is a syringe, capped with a line which connects through a solenoid valve to a pressure regulated air supply. To dispense, the solenoid valve is turned ON causing paste to extrude continuously from the syringe needle. A change in any of many parameters can cause the shot size to drift; this is especially nettlesome with small shots of heavily filled materials. Even proponents of the technique admit it is more art than science [6]. There are a variety of other valve styles as well: pinch, poppet, spool, rotary peristaltic, as well as metering pumps. None of these are well suited to precise, repeatable dispensing of tiny paste dots.
Specialized hardware is however available for dispensing small paste dots. One recently in-troduced timed valve has a reservoir that supplies paste under low pressure to a miniature rotary screw conveyor driven by an ordinary DC motor [12]. A more common approach is to use a servomotor driven plunger that advances along the barrel of the syringe. This can provide good shot size control but the valve becomes bulky if the syringe is of reasonable capacity. A variant of this method uses a small cylinder and piston; when the cylinder is empty, it is refilled under pressure from an external reservoir while the piston is withdrawn [9]. Another valve works on a similar principal, but is strictly for one-shot operation; the bore of the needle itself becomes the cylinder and the piston is a tiny solenoid driven wire that enters the butt end of the needle with each shot to drive the paste. An adjustable stop controls the stroke of the piston and hence the amount dispensed [3].
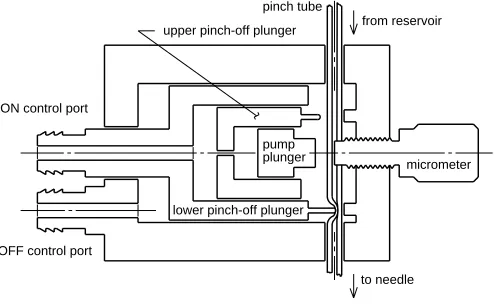
The one-shot valves evaluated in this report are the SCM/Dispensit 802-30, shown schemati-cally in figure 1. Testing was performed on three different sized valves, referred to by the needle gage (abbreviated: ga):
24 ga: ID = 0.0125 in (320µm);
22 ga: ID = 0.0165 in (420µm);
20 ga: ID = 0.0240 in (610µm).
upper pinch-off plunger
lower pinch-off plunger pinch tube
micrometer from reservoir
to needle OFF control port
ON control port
[image:12.612.199.446.73.226.2]pump plunger
Figure 1: Schematic of SCM 802-30 Valve
3.2. Robot
While the valve is responsible for dispensing the correct amount each time it is actuated, for dot shape control the robot must deposit the paste from the correct distance above the workpiece (z-axis). The robot used was an Asymtek 403G, a lightweight, cable-driven unit built much like a heavy-duty pen plotter. Its servomotors are of micro-stepped design, providing z-axis resolu-tion of 0.002 in (50µm).
3.3. Approaches to Dispense Height Control
During equipment evaluation, it became apparent that controlling the distance from the workpiece to dispense tip would be a significant challenge. Small errors can lead to large changes in dot shape. The problem is exacerbated by warpage and fixturing difficulties.
The literature contains a variety of solutions to this problem. Perhaps the simplest is to have a projection at the end of the dispense tip that allows it to press against the workpiece while main-taining the required clearance [11, 13]. Either the contact force can be limited or the workpiece can be allowed to deflect, simplifying z-axis positioning. There are drawbacks: the contacting projection places constraints on spacing to adjacent deposits and to other items on the surface. Also, the contact may damage delicate surfaces. Another approach is to locate the surface by mounting the syringe on a load cell and monitoring forces and torques while probing with the needle tip prior to dispensing [10], or by using a mechanical means to allow the tip to settle on the workpiece and withdraw a fixed distance [5]. Both methods, however, are sensitive to errors caused by workpiece deflection. A related non-contacting method uses laser triangulation for height sensing. The sensor body fits around the dispense needle and the surface is located im-mediately prior to dispensing each dot [2]. A radically different approach monitors tip motion and material flow combined with real-time control of tip force, pump speed, and x, y motion [9, 8]. It is claimed that with this method, crossovers comprised of dielectric and con-ductive ink layers can be dispensed without intermediate drying steps!
grams trip force was found to be large enough to introduce measurement errors due to deflection or rocking, particularly with the improvised fixturing that is typically used.
3.4. Other Instruments
Weighing was the principal method used to measure amount dispensed. A Mettler AM-100 laboratory microbalance with 100µg resolution was used to weigh multiple shots on microscope slides. While a more sensitive scale might permit individual shots to be weighed, in practice even 100 µg accuracy was difficult to attain; the scale had to be shielded from air currents and random lab vibrations often hampered measurement.
4. Results
4.1. Experimental Approach
The goal of the experiments was to understand dispensing well enough to be able to take a new material and rapidly attain a controllable, stable, and repeatable process. Dispensing speed was secondary. As discussed previously, there are many parameters that could affect dot mass and geometry: micrometer setting, ON/OFF timing, reservoir pressure, valve pressure, needle size, material, temperature, dispense height, and dispense tip motion. An ideal process would be one where the amount dispensed was sensitive only to the valve micrometer setting, and where the shape of the dot was insensitive to minor process variations.
4.2. Valve Displacement Range
The first process characterization step is to determine the valve displacement range. With this one-shot valve, the pump plunger stroke, and hence the amount dispensed, is controlled by a micrometer head that limits plunger travel. At one extreme (low settings), the pump plunger strikes the micrometer anvil before it contacts the pinch tube and no material is dispensed (though in practice some small amount escapes as the pinch-off plungers cycle). At the opposite extreme (high settings) the piston plunger completely flattens the pinch tube before it strikes the micrometer anvil; in this case a maximum amount of material is dispensed. Since it is desired that the micrometer determine the shot size, it is necessary to determine the range where the adjustment is active.
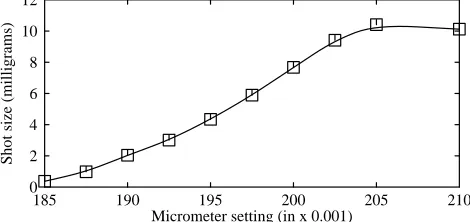
This displacement range was determined by carefully swabbing the tip, dispensing 10 shots onto a tared microscope slide, then weighing. This was done at various micrometer settings. Results are shown in figures 2, 3, and 4. The tests were run with solder paste, and ‘reasonable’ values used for other parameters; valve pressure: 70 psi (480 kPa), reservoir pressure: 20 psi (140 kPa), and slow valve timing: 2 s ON and 2 s OFF. The subsequent valve timing tests verify that these values were indeed reasonable.
The graphs suggest that at some small micrometer setting, zero dispense mass is approached and that above some larger setting, the maximum amount is dispensed. Between these extremes the micrometer does a good job of controlling the amount. For the subsequent valve timing experiments, settings were chosen that spanned the active range, but were not so close to the extremes that any anomalous behavior would be expected.
4.3. Valve Timing Limits
225 230 235 240 245 250 Micrometer setting (in x 0.001)
0 2000
500 1000 1500
[image:16.612.186.434.75.189.2]Shot size (micrograms)
Figure 2: Shot size vs micrometer setting for 24 ga valve with solder paste
200 205 210 215 220 225 Micrometer setting (in x 0.001)
0 5000
1000 2000 3000 4000
[image:16.612.185.433.220.332.2]Shot size (micrograms)
Figure 3: Shot size vs micrometer setting for 22 ga valve with solder paste
185 190 195 200 205 210 Micrometer setting (in x 0.001)
0 12
2 4 6 8 10
Shot size (milligrams)
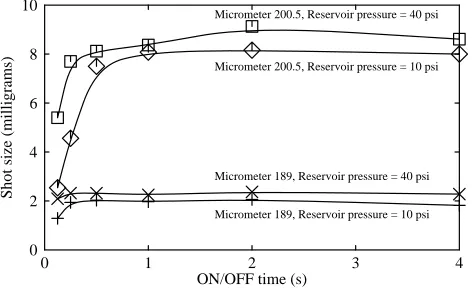
[image:16.612.198.433.366.477.2]While the frequency response could be tested by independently varying the ON and the OFF times to find where each becomes binding, the cost of the experiment was reduced by using equal ON and OFF times. The tests were run at two micrometer settings and two reservoir pres-sures, with times ranging from 125 ms ON, 125 ms OFF to 4 s ON, 4 s OFF. Results are shown in figures 5, 6, and 7. Tests were also run (not shown) demonstrating that at these speeds, the influence of valve pressure was not significant beyond some threshold needed to close the pinch plunger.
To attain a process insensitive to exact valve timing, ON/OFF times in the flat part of the curve should be used. Note that this method does not reveal the fastest possible cycling speed; only one of the two times is likely to be binding. Reducing the non-binding time would speed up the valve cycle rate. While this method of equal ON/OFF times doesn’t guarantee the fastest possible cycle, it does guarantee one within a factor of two of optimal; even if the time for one part of the cycle could be reduced to zero, the valve cycling rate would only double. If higher speeds are deemed important, additional tests could be performed.
These timing graphs reveal many aspects of valve performance that bear discussion. At the longer ON/OFF times, the reservoir pressure exerts an influence on shot size that is roughly independent of the ON/OFF time. This is caused by bulging of the pinch tube. When the valve is OFF, the inside of the pinch tube equilibrates at reservoir pressure. The tube is made of an elastomer and its ID varies roughly linearly with internal pressure. Since the volume of the tube varies as the ID squared, the volume dispensed might be sensitive to reservoir pressure changes. The 22 ga pinch tube has the same OD as the 24 ga, however the ID of the 24 ga tube is smaller. The graphs show that the stiffer wall of the 24 ga pinch tube make the valve less sensitive to pressure variations, particularly with small shots, where the pump plunger barely contacts the tube.
The graphs also show that for a given valve and reservoir pressure, the flat part of the curve extends to lower ON/OFF times with smaller shot sizes. This means that without a loss of ac-curacy, the valve can be cycled faster with small than with large shots. For a given shot mass accuracy specification, the minimum ON/OFF time is roughly proportional to the shot mass. This reflects the time needed to empty the pinch tube during the ON portion of the cycle and/or the time to refill it from the reservoir during the OFF portion. The proportionality with shot mass suggests that this filling or emptying takes place at roughly a constant rate, implying that with a given valve, throughput in mass per unit time is constant and is independent of the shot size. One can choose big dots or little dots, but the number of grams per minute is constant.
For small ON/OFF times, the valve behaves like a timed shot rather than a one-shot valve, and variations in timing are reflected in dot mass errors. Furthermore, the quantity dispensed varies roughly as the square root of the reservoir pressure. A shift in material properties would have similar effects. It is difficult to obtain stable performance operating the valve in this manner.
0 1 2 3 4 ON/OFF time (s)
0 1600 200 400 600 800 1000 1200 1400
Shot size (micrograms)
Micrometer 233, Reservoir pressure = 40 psi
Micrometer 233, Reservoir pressure = 10 psi
[image:18.612.186.438.138.283.2]Micrometer 228, Reservoir pressure = 40 psi Micrometer 228, Reservoir pressure = 10 psi
Figure 5: Shot size vs ON/OFF time at various feed pressures and
micrometer settings for 24 ga valve with solder paste
0 1 2 3 4 ON/OFF time (s)
0 4000
1000 2000 3000
Shot size (micrograms)
Micrometer 208.5, Reservoir pressure = 40 psi
Micrometer 208.5, Reservoir pressure = 10 psi
[image:18.612.187.437.320.467.2]Micrometer 203.5, Reservoir pressure = 40 psi Micrometer 203.5, Reservoir pressure = 10 psi
Figure 6: Shot size vs ON/OFF time at various feed pressures and
micrometer settings for 22 ga valve with solder paste
0 1 2 3 4 ON/OFF time (s)
0 10 2 4 6 8
Shot size (milligrams)
Micrometer 200.5, Reservoir pressure = 40 psi
Micrometer 200.5, Reservoir pressure = 10 psi
Micrometer 189, Reservoir pressure = 40 psi Micrometer 189, Reservoir pressure = 10 psi
Figure 7: Shot size vs ON/OFF time at various feed pressures and
[image:18.612.198.436.506.650.2]4.4. Dot Shape
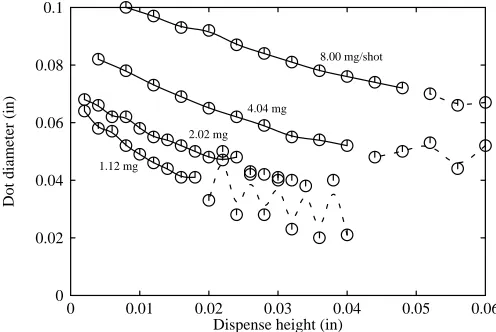
Accurate shot size control is a precondition for dot shape control. Given good control of size, the dot shape is determined by the dispense tip shape and size, and by the height from which the dot is released. It is also influenced by paste properties. To facilitate a comparison between the three valves used in this study, solder paste masses of 8, 4, 2, 1, 0.5, 0.25, 0.125 and 0.063 milligrams were specified, and each valve was tested at the points that fell within its controllable range. ON/OFF times chosen were long enough to give repeatable dispense mass. Valve pres-sure of 70 psi (480 kPa) and reservoir prespres-sure of 20 psi (140 kPa) were used for all dot shape tests. Prior to each test run, the valve was cycled, shots weighed, and micrometer adjusted until the required mass was obtained. Reference height was set by touching the dispense tip lightly to the slide surface, this method proved to be repeatable within +/- 0.001 in (25 µm). Non-coplanarity over the area of the test pattern contributed an additional +/- 0.001 in (25 µm) error. The 20 test dots were dispensed next to each other on the slide. For the larger dots, the first dot was dispensed from 0.080 in (2.03 mm) above the surface, the second 0.004 in (0.1 mm) lower, and so on, with the last dropped from a height of 0.004 in (0.1 mm). The smaller dots had a starting height of 0.040 in (1.02 mm) and the increment was 0.002 in (0.05 mm). After dispens-ing a dot and waitdispens-ing until the required OFF time had elapsed, the tip was raised 0.25 in (6.35 mm) and moved laterally to the next site.
With solder paste, the dot diameter is the shape parameter of interest, hence the dot height was not measured. Diameter was checked by viewing the slides normal to their surface under a microscope with a calibrated reticle. The measurements were based on the boundary delineated by the edge of the agglomerated solder particles; the flux typically wetted a somewhat larger area. The diameter of dots that appeared round and well formed could be repeatably measured within 0.002 in (0.05 mm) by this method. For those that were judged misshapen, (not con-nected by a solid line in the plots), the recorded diameter is the estimated average. This was subjective, a different observer might judge the onset and diameter of the misshapen dots some-what differently. Results are shown in figures 8, 9, and 10.
0 0.005 0.01 0.015 0.02 0.025 0.03 Dispense height (in)
0 0.05
0.01 0.02 0.03 0.04
Dot diameter (in)
0.99 mg/shot 0.51 mg
[image:20.612.188.433.74.238.2]0.26 mg 0.12 mg
Figure 8: Dot diameter vs dispense height for 24 ga valve with solder paste
0 0.01 0.02 0.03 0.04 0.05 Dispense height (in)
0 0.08
0.02 0.04 0.06
Dot diameter (in)
4.04 mg/shot
2.03 mg 1.02 mg
[image:20.612.184.434.267.433.2]0.48 mg
Figure 9: Dot diameter vs dispense height for 22 ga valve with solder paste
0 0.01 0.02 0.03 0.04 0.05 0.06 Dispense height (in)
0 0.1
0.02 0.04 0.06 0.08
Dot diameter (in)
8.00 mg/shot
4.04 mg 2.02 mg 1.12 mg
[image:20.612.185.433.463.629.2]4.5. Influence of Material on Dot Shape
To understand the sensitivity of a controlled dispense process to material properties, a dot shape experiment was performed using four different materials. The 22 ga valve was used at a micrometer setting of 213, a valve pressure of 70 psi (483 kPa), and a reservoir pressure of 20 psi (138 kPa). A timing test was done for each material and an appropriate ON/OFF time deter-mined. These ON/OFF times ranged from 0.5 s for the surface mount adhesives to 16 sec for the heavily filled thermal epoxy. After placing the dots, both diameter and height were measured under the microscope. Height was measured by viewing the dots from the side, with the slide tipped a few degrees to give a clear view of the base and peak of the dot.
The diameter and height of all good dots produced are shown in figure 11. One difference among the materials was the range of dispense heights that yielded good dots; surface mount adhesives were the best in this regard, solder paste the worst. With the exception of the solder paste, dot diameters at a given dispense height were consistent within about 10% over the entire domain. Dot heights were equally consistent at the larger dispense heights, but spanned a 2:1 range when the dot was dispensed close to the slide. This was due to the shape of the dots; the surface mount adhesives formed sharp peaks at the dot centers, while the other materials did not.
2
This suggests that using the peak dot height in a correlation of the form, V = (const)πR H,
0 0.01 0.02 0.03 0.04 0.05 Dispense height (in)
0.02 0.085
0.03 0.04 0.05 0.06 0.07 0.08
Dot diameter (in)
Dot height (in)
solder paste
[image:22.612.160.472.70.469.2]surface mount adhesive A surface mount adhesive B thermal epoxy
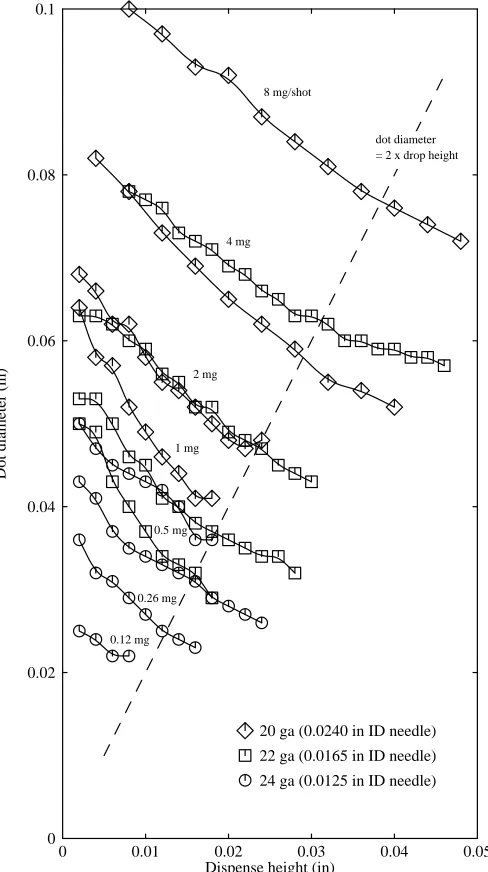
4.6. Valve Size Selection
Which valve size should be selected to dispense a particular sized dot? Figure 12 helps answer that question by showing on a single plot the diameter of only the good dots for all three valves. For this particular paste, all three valves were able to produce good dots with diameters down to 1.74 +/- 0.03 times the needle ID; this was at each valve’s minimum shot size. The corresponding drop heights ranged from 0.7 to 1.1 times the needle ID. Doubling the shot size for all three valves caused the minimum dot diameters to grow to 1.92 +/- 0.09 times needle ID; these were dropped from 1.2 to 1.7 times the needle ID. This set of experiments seems to con-firm the widely espoused rule of thumb that the drop height should be half the dot diameter [3, 1]. This is close to the ragged edge for the smallest dots, and about right for the larger ones. For large dot diameters, the needle ID had little effect on the curves; presumably the largest possible needle would be chosen to maximize throughput.
0 0.01 0.02 0.03 0.04 0.05 Dispense height (in)
0 0.1
0.02 0.04 0.06 0.08
Dot diameter (in)
20 ga (0.0240 in ID needle) 22 ga (0.0165 in ID needle) 24 ga (0.0125 in ID needle)
dot diameter = 2 x drop height 8 mg/shot
4 mg
2 mg
1 mg
0.5 mg
0.26 mg
[image:23.612.153.397.251.687.2]0.12 mg
4.7. Timed Valve Operation
The goal so far has been making the valve behave like an ideal one-shot; one where shot size is determined only by the micrometer setting. Experiments were also performed to assess valve operation in timed-shot mode. Operated in this manner, it would be expected that the shot quan-tity would become difficult to control: that it would become sensitive to a number of parameters. The principal advantage of regulating by timing rather than micrometer setting is that the shot size can be varied under program control; different dot sizes and shapes can be part of a single pattern. It might also prove possible to dispense smaller quantities than could be attained by one-shot style operation. Only the 24 ga valve was tested.
For these tests, it was necessary to use different experimental methods. A miniature camera was mounted next to the needle tip to allow direct observation of individual dots leaving the tip, and visual estimates to be made of the quantity dispensed. The amount dispensed was recorded in terms of the diameter of the extruded paste; if the length extruded was the same as the diameter, ‘1.0 diameters’ was recorded . A tendency of the paste to curve or curl as it left the needle complicated measurement of the larger shots. Overall accuracy was estimated at +/- 20% plus +/- 0.1 diameters. While visual measurement does not approach the weighing method in accuracy, it has the advantage of allowing small individual shots to be measured. It also permits direct observation of the dispense process, exposing non-ideal behaviors. If greater accuracy were required, the method could be greatly improved by recording the video and performing the measurements with image analysis equipment.
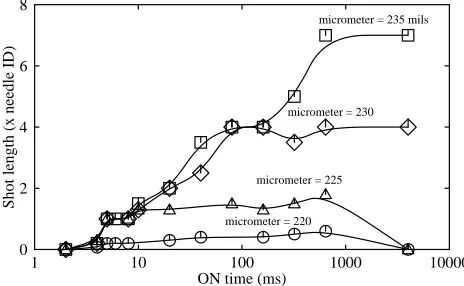
For the initial tests, the valve ON duration was varied, and single shots of conditioning fluid dispensed. As in the dot shape tests, a valve pressure of 70 psi (480 kPa) and reservoir pressure of 20 psi (140 kPa) were used. It was noted, but not investigated in detail, that for the smallest shot sizes the material moved into the needle when the valve turned ON, and out of the needle when the valve turned OFF. This non-ideal behavior would not have been noticed without the camera! It was further observed that for micrometer settings under about 228, if the valve were left on for a long period, the material would be slowly sucked back into the end of the syringe (see figure 13).
1 10 100 1000 10000 ON time (ms)
0 8
2 4 6
Shot length (x needle ID)
micrometer = 235 mils
micrometer = 230
micrometer = 225
[image:25.612.167.399.194.337.2]micrometer = 220
Figure 13: Shot length vs ON time at various micrometer settings for 24 ga valve with conditioning fluid
The valve behavior in the 0 to 1 s ON time region exhibited many interesting features. At 2 ms, no material was dispensed at any micrometer setting; the ON command was just too short to cycle the robot’s pneumatic control valve and/or to overcome the plungers’ static friction. At 4 ms things began to happen; the amount extruded was about the same for the three larger micrometer settings, less for the 220 setting. The amounts for the three larger micrometer set-tings continued to track each other up to about 10 ms where the amount dispensed at the 225 setting leveled off. The 230 and 235 micrometer settings continued to track each other up to about 100 ms where the lower setting leveled out. The conclusion is that for a sufficiently small ON time, the amount dispensed is independent of the micrometer setting, and that the larger the micrometer setting, the longer the ON time required before its influence is exerted. With these short pulses, the valve is indeed a timed shot valve.
To examine process sensitivity to valve and reservoirs pressure, a second sequence of tests was run with the conditioning fluid, this time with the ON period fixed at 6 ms (see figure 14). The amount dispensed was very sensitive to the valve pressure, particularly at the larger micrometer settings where the pump plunger could appreciably compress the pinch tube. The reservoir pressure exerted its influence as well, particularly at the lower valve pressures.
in figure 15 look very similar to data taken with conditioning fluid (figure 13). For sufficiently large micrometer settings, the amount dispensed is determined by the valve ON time.
After acquiring the above data, the valve was adjusted to deliver a shot length of 0.35 diameters. Dispensing 1000 shots onto a tared slide and weighing showed the average mass to be 77µg. This was considerably less than the 120µg obtained (with some difficulty!) during the earlier one-shot mode tests. Weighing 100 shots with a length of 0.6 diameters showed the mass to be 110 µg; for these two cases, mass and length correlated within 20%. When testing resumed, the valve clogged. The pinch tube was cut open and the inside wall examined under a microscope. Undeformed particles of solder paste were found embedded in the wall in the zone where the upper pinch valve pressed. It is worth noting that at 77µg/shot, the paste is advancing only about 0.005 in (0.1 mm) along the pinch tube with each valve cycle. Since the pinch valve compresses a much longer region of the tube, it is easy to believe that the flux is being locally depleted and making clogging likely.
220 222 224 226 228 230 232 234 236 Micrometer setting (in x 0.001)
0 1.6 0.2 0.4 0.6 0.8 1 1.2 1.4
Shot length (x needle ID)
valve = 80 psi reservoir = 40 psi
reservoir = 10 psi
valve = 60 psi reservoir = 40 psi
reservoir = 10 psi
valve = 40 psi reservoir = 40 psi
[image:26.612.189.441.271.416.2]reservoir = 10 psi
Figure 14: Shot length vs micrometer setting for 24 ga valve
with conditioning fluid at 6 ms ON time
1 10 100 1000 ON time (ms)
0 3.5 0.5 1 1.5 2 2.5 3
Shot length (x needle ID)
micrometer = 235 mils micrometer = 230 micrometer = 225
[image:26.612.192.435.453.584.2]5. Summary and Conclusions
The mechanics of the paste dot dispensing process were described. A way of partitioning the process by separating dispense valve behavior from dot placement was proposed. A technique was developed for efficiently evaluating valve frequency response; it was used to characterize a set of valves. This method enables meaningful speed comparisons of varying valve designs. Dot placement stability bounds and means of estimating correct dispense tip ID, dispense height, and minimum attainable dot diameter were discussed. Experiments showed that it is primarily dis-pense height that determines the shape of the resulting paste dot. This demonstrated the impor-tance of z-axis control, and various methods of achieving it were discussed. It was also found that dot shape was relatively insensitive to the material used, when the appropriate valve ON/OFF time was chosen. High speed operation of a particular valve was evaluated, demonstrating the difficulties inherent in the timed valve approach. This testing used a miniature video camera to observe dot formation at the dispense tip and to measure the size of individual shots.
There are numerous opportunities for improving the understanding of robotic paste dispens-ing. Further work would certainly include evaluations of other valve and dispense tip designs, height control and dot placement strategies, and the role of lift-off dynamics in detaching the dot from the tip. Opportunities abound for study into the role paste properties play: how lubricity, adhesive and cohesive forces, viscosity and thixotropy influence dot formation and separation. Of course, application development is also needed to answer questions such as: what is the best shaped deposit for a particular solder pad, or how must the material be placed to control voids in a thermal joint? While paste dispensing has a history of successful use, a challenge remains in turning it from an art into a science.
Acknowledgements
The author wishes to acknowledge the contribution of J. Bradley Chen who wrote the software that integrated the robot with our computing environment; his robust design has served for several years without the need for changes. The author also wishes to thank Mary Jo Doherty, Alan Eustace, and Jeffrey Mogul for reviewing the manuscript and providing corrections and criticism.
References
[1] A. Babiarz.
Bringing Flexible Manufacturing with CIM to In-Line Solder Paste Dispensing Systems.
Surface Mount Technology :45-46, February, 1989.
[3] J. C. Engel.
Precision Dispense of Solder Paste and Epoxy.
Electronic Production Equipment Chronicle :A-28, 1988.
Nepcon West 1988 newsletter.
[4] R. C. English.
Robotic Component Lead Trimming at Hughes.
Electronic Packaging and Production :72-73, May, 1988.
[5] T. H. Hartley.
Terrain Following for Thickness Uniformity in Automated Adhesive Dispensing.
In Proceedings of the Surface Mounting and Advanced Related Technologies Conference. January, 1989.
EIA/IPC SMART V Conference, New Orleans.
[6] F. Herot.
Guidelines for Solder Paste Application Using Standard Dispensing Techniques.
Hybrid Circuit Technology , September, 1987.
[7] Tokyo Juki Industrial Co, Ltd.
KH-550 Pattern Direct Writing System for Thick Film Hybrid Circuit. product description.
1987.
[8] W. Mathias.
Direct Writing Technology Application Update.
Hybrid Circuit Technology , June, 1986.
[9] Micropen Inc.
Micropen Direct Writing and Precision Dispensing Systems. product description.
[10] D. Olender.
Force/Torque Sensor Aids Adhesive/Solder Mask Dispensing.
Robotics Today 9(3), June, 1987.
[11] Panasonic Industrial Co.
NM-2701 Programmable Resistor Paste Dispenser. product description.
[12] Technicon Systems Inc. TS4000 Rotary Microvalve. product description.
1988.
[13] Universal Instruments Corporation.
Engineering Data Sheet, Dispenser Module model 4713C. product description.
Table of Contents
1. Introduction 1
2. Models of Paste Dot Dispensing 2
2.1. Ideal Valves 2
2.2. Process Partitioning 2
2.3. Quantity per Shot 3
2.4. Depositing a Controlled Amount 4
2.5. Controlling Dot Shape 5
3. Apparatus 6
3.1. Dispense Valve 6
3.2. Robot 7
3.3. Approaches to Dispense Height Control 7
3.4. Other Instruments 8
4. Results 9
4.1. Experimental Approach 9
4.2. Valve Displacement Range 10
4.3. Valve Timing Limits 10
4.4. Dot Shape 14
4.5. Influence of Material on Dot Shape 16
4.6. Valve Size Selection 18
4.7. Timed Valve Operation 19
5. Summary and Conclusions 22
Acknowledgements 22
List of Figures
Figure 1: Schematic of SCM 802-30 Valve 7
Figure 2: Shot size vs micrometer setting for 24 ga valve with solder paste 11
Figure 3: Shot size vs micrometer setting for 22 ga valve with solder paste 11
Figure 4: Shot size vs micrometer setting for 20 ga valve with solder paste 11
Figure 5: Shot size vs ON/OFF time at various feed pressures and micrometer 13
settings for 24 ga valve with solder paste
Figure 6: Shot size vs ON/OFF time at various feed pressures and micrometer 13
settings for 22 ga valve with solder paste
Figure 7: Shot size vs ON/OFF time at various feed pressures and micrometer 13
settings for 20 ga valve with solder paste
Figure 8: Dot diameter vs dispense height for 24 ga valve with solder paste 15
Figure 9: Dot diameter vs dispense height for 22 ga valve with solder paste 15
Figure 10: Dot diameter vs dispense height for 20 ga valve with solder paste 15
Figure 11: Dot diameter and height vs dispense height for 22 ga valve with 17
various materials
Figure 12: Dot diameter vs dispense height for 20 ga, 22 ga, and 24 ga valves 18
with solder paste
Figure 13: Shot length vs ON time at various micrometer settings for 24 ga valve 20
with conditioning fluid
Figure 14: Shot length vs micrometer setting for 24 ga valve with conditioning 21
fluid at 6 ms ON time
Figure 15: Shot length vs ON time at various micrometer settings for 24 ga valve 21