EFFICIENT REMOVAL OF IMPULSE NOISE FROM VIDEO
USING ADAPTIVE THRESHOLD ALGORITHM
1P. LATHA, 2Dr. M. A. BHAGYAVENI, 3S. R. PREETHI
1, 3
Department of ECE, St. Joseph’s College of Engineering, Anna University, Chennai, India 2
Department of ECE, College of Engineering, Guindy, Anna University, Chennai, India
E-mail: [email protected], [email protected], [email protected]
ABSTRACT
In digital image processing noise removal or noise filtering plays an important role, because for meaningful and useful processing images should not be corrupted by noises. In recent years, high quality televisions have become very popular but noise often affects TV broadcasts. Impulse noise corrupts the video during transmission and acquisition of signals. A number of denoising techniques have been introduced to remove impulse noise from images and video. Linear noise filtering technique does not work well when the noise is adaptive in nature and hence a number of linear filtering technique where introduced. In non-linear filtering technique, median filters and its modifications where used to remove noise but it resulted in blurring of images. Therefore we propose an adaptive digital signal processing approach that can efficiently remove impulse noise from color video. In this algorithm, the pixel is replaced only if it is identified to be a noisy pixel by the proposed adaptive threshold algorithm otherwise the original pixel is retained. Thus it results a better filtering technique when compared to median filters and its modified filters. It is proved that the proposed algorithm is more suitable for high noise environment. The parameters Mean Square Error (MSE) and Peak Signal to Noise Ratio (PSNR) are measured for determining the visibility and similarity of output video frames.
Keywords: Impulse Noise, Adaptive Threshold, Noise Detection, Color Video Processing
1. INTRODUCTION
Digital image processing is used widely in many important fields such as medical imaging for diagnosis of diseases, face recognition for security purposes and so on. Hence it is necessary that image and video should be noise free for various processing. Often the image and video are corrupted by impulse noise. Impulse noise is also known as spike noise or salt and pepper noise. Impulse noise results in dark pixels in bright regions and bright pixels in dark regions. Impulse noise is mainly caused during analog to digital conversion, pre-processing, compressing of images and videos, transmission of signals and acquisition of signals (i.e.) while broadcasting of signals, storing and retrieval of images and videos. Impulse noise is generally of two types fixed value impulse noise and random value impulse noise. In fixed value impulse noise the noisy pixel will have minimum or maximum gray level value, thus it introduce grey level value 0 (salt) and gray level value 255 (pepper) to the original image and hence
impulse noise is known as salt and pepper noise. In random value impulse noise the noisy pixel will have random value of gray level value. Impulse noise is generally characterized by replacing some portion of pixels in image by noisy pixels and leaving the remaining part of pixels in the image unchanged.
In This paper, we propose an adaptive threshold algorithm to remove impulse noise from video frames. The result of the proposed algorithm is compared with median filter and proved that it is more efficient technique in high noise environment.
2. RELATED WORKS
Mean filter [1] is one of the existing noise removal techniques. Mean filter is a linear filter. In mean filter the pixel is replaced by mean of neighborhood pixel. It is suitable for removing Gaussian noise from images. Mean filters is not suitable for removing impulse noise from images and videos. Mean filters blur edges and details in an image and not effective for impulse noise (Salt-and-pepper). Hence median filters are found to be capable of removing impulse noise.
In median filter [2], the pixel in original image is replaced by median of neighborhood pixels. Median filter is a smoothening filter and thus it preserves the edges. Median filter preserves the position of boundaries in an image and thus makes the image useful for visual enhancement and various measurements. As an extension of median filters there came Weighted Median (WM) filter. WM filter gives more weightage to some selected pixels. In this filter each window position is assigned a weight and then the sample inside filter window is duplicated to number of corresponding weight. A median value of neighborhood pixels from the increased list of samples gives the WM output.
Centre Weighted Median (CWM) filter [2] is a sub-class of Weighted Median filter. CWM is one of important WM filter because it is easy to implement and is best understood theoretically compared to many WM filter. CWM filter has useful properties such as noise preserving and suppressing of noises especially heavy-tailed noise. In CWM filtering technique more weight is given only to the centre value of window and thus making CWM filter easier to design and implement than other WM filters. Median filters often remove desirable details and blurs the image. Further, median filters can remove noise only if noisy pixels occupy less than one half of neighborhood area. It has high computational cost. Though WM and CWM can overcome the disadvantages of median filter they are applied uniformly without considering whether the pixel is noisy or noise free.
Simple Adaptive Median (SAM) filter [3] is used to remove impulse noise. SAM is a hybrid of adaptive median filter and switching median filter. In SAM filtering technique, noisy pixels and noise free pixels are identified and noise free pixels are sent to the output without any modifications where as noisy pixel values are replaced by values from
already precomputed look-up table and hence reducing the execution time. SAM filter uses square filters, this filter is further extended to Circular Simple Adaptive Filter (CSAM) where CSAM uses circular filter. Thus CSAM becomes more efficient than SAM as errors associated with square kernels are minimized. This SAM and CSAM can further be extended to Weighted Simple Adaptive Median (WSAM) filter and Weighted Circular Simple Adaptive Median (WCSAM) filter by adding weights to those filters. The disadvantages of WM and CWM filter are overcome by SAM filter but here in SAM filter the noisy pixel value is replaced by value from look-up table without checking if it is correct value by considering the neighborhood pixels.
In [4], a filtering technique that removes 0’s and 255’s from the image is discussed. The median of the neighborhood pixel is found and it is used instead of noisy pixel. This technique is based on fuzzy logic. In noise removal technique using fuzzy logic 0’s and 255’s are removed without considering them if it is noisy or noise free. Further this fuzzy technique can be used to remove impulse noise from gray scale image only.
In paper [5], Simple Edge Preserved Denoising (SEPD) and (Reduced Simple Edge Preserved Denoising (RSEPD) techniques have been employed to locate the edge of noisy pixel. In this technique, a pixel is checked whether it is noisy pixel or noise free pixel, if it is a noisy pixel then SEPD locates if directional edge is existing in the current noisy pixel and it replaces noisy pixel with determined reconstructed value. In SEPD twelve edge differences are considered to detect the proper edge. When more edges are considered the computational complexity is increased by using this technique. Hence to further reduce the computational complexity, RSEPD technique is used. This RSEPD technique uses only three edge differences to detect proper edge. But the image produced is of lower quality compared to SEPD but it has much reduced complexity when compared to SEPD. In denoising techniques such as SEPD and RSEPD there is need to compute three to twelve edge differences thus increasing the computational complexity.
A parallel architecture [6] is developed to construct a VLSI chip based on the adaptive algorithm to remove impulse noise. The architecture is implemented with a module base consisting of pipelined-processing flow.
fixed and random value from gray scale and colour images and videos. Here we use threshold value which is adaptive in nature. The proposed noise removal technique is efficient and suitable in high noise environment.
3. PROPOSED WORK
The proposed adaptive threshold algorithm is divided into two parts which can be used to remove impulse noise. The first part involves detecting if pixel is noisy or noise-free. The second part involves replacing the detected noisy pixel by pixel value found out using adaptive threshold. In order to remove noise from colour video we first convert video into sequence of frames. Then the frames are processed.
3.1 Adaptive Threshold Algorithm
The proposed adaptive threshold algorithm has two parts
• Noise Detection • Adaptive Filter
[image:3.595.309.498.394.435.2]3.1.1 Noise detection
Figure 1 shows a 3x3 square kernel (window) of image in which there are 9 pixels.
f ^
i-1,j-1 f ^i-1,j f ^i-1,j+1
f ^
i,j-1 f i, j
fi,j+1
fi+1,j-1 fi+1,j fi+1,j+1
Figure 1: 3x3 window
In Figure 1, f ^i-1, j+m (m=-1,0,1) are the pixels
of the previous scanning lines and f ^i, j-1is the
pixel in the current scanning line that have been filtered. fi,j is currently processed pixel and thus the mean of done-filtered pixels around the currently
processed pixel is computed and stored in variable
DMi,j using equation (1)
4 ^ 1 , ^ 1 , 1 ^ , 1 ^ 1 , 1 , − + + − + − + − −
= i j
f j i f j i f j i f j i
DM (1)
Aside from DMi,jwe have another parameter
YMi.j. The pixels fi,j+1,fi+1,j-1,fi+1,j and fi+1,j+1 are
pixels which should be processed. The mean of pixels that have not yet been processed is found out and stored in variable YMi,jwhich is given in
equation (2) 4 1 , 1 , 1 1 , 1 1 , , + + + + + − + + +
= i j
f j i f j i f j i f j i
YM (2)
DMi,jand YMi,j offers local mean for the processed
pixel. If currently processed pixel is not corrupted by noise then the pixel value is close to DMi,jor
YMi,j. Thus noise detection can be expressed as
− > + − pixel free noise a is j i f Otherwise pixel corrupted a is j i f T j i YM j i DM j i f if , , , , 2 ) , , (
, (3)
T is noise threshold. From equation (3) one can decide if the currently processed pixel is corrupted by noise or it is a noise free pixel. Based on this result non-linear filtering can be implemented.
3.1.2 Adaptive filter
Based on image feature, the noise reduction ability is adaptive to each pixel, thus achieving better filtering result. The nonlinear filtering procedure used to remove noise is given by equation (4).
− = = pixel free noise a is j i f as j i f j i f pixel corrupted a is j i f as j i DM j i f , , , ^ , , , , ^ , (4)Thus the corrupted pixels are replaced by average of previously filtered pixels and the noise free pixels are kept as it is. This filtering technique blurs the edges and hence edge detection (ED) is adopted to improve the filtering quality. Thus for making filter to work efficiently one has to see if processed pixel belongs to edge or noisy pixel in non-smooth regions. If the decision is incorrect, either image edges become blurred or noise cannot
Currently processed pixel
[image:3.595.84.291.472.616.2]be removed and also filtered error will be propagated to next processing pixel due to recursive nature of algorithm. Hence accurate computation of edge parameter is needed. Edge computation for noisy pixel is tedious as some of the edges are already destroyed and this gives erratic result due to noisy pixels. Therefore to avoid noisy pixel inclusion horizontal edge factor is adaptively computed using previously processed pixels. The horizontal ED parameter is given in equation (5)
∑
=
− −
−
−
=
1
4
, ,
1
m
m j i m j
i
f
f
ED
(5)Where pixels fi-1,j-m and fi,j-m have already been filtered. Thus by considering only horizontal ED
the computational complexity is reduced. .
3.2 Threshold Computation
Depending on ED value dynamically adjust noise threshold T to reduce edge distortions. Noise Ratio (NR) is computed using Noise Counter (NC). The NC increases by one if noisy pixel is found. Depending on ED and NC parameters, the adaptive threshold function T for noise threshold can be given by equation (6)
1 3 2
1 ) , (
− × − × + =
=F ED NC k k ED k NCt
T (6)
Here k1~k3 are constants. In the proposed algorithm, authors have selected k1=30, k2=25 and
k3=1/212 by trial and error method to achieve better filtering results in the simulation. NCt-1is the noise count found from the previous processed frame.
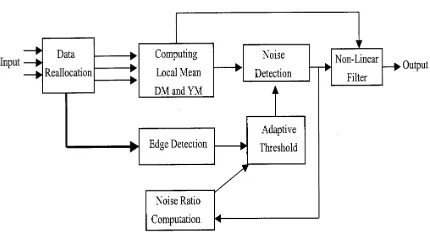
[image:4.595.88.303.576.693.2]3.3 Architecture of Noise Reduction Process
Figure 2: Architecture Of Noise Reduction Process
Figure 2 shows the system architecture of noise reduction process. Here three scanning lines
are given as inputs which are used for data reallocation. Then parameters such as DM, YM and local mean are computed. Edge detection parameter ED is calculated and NC is calculated from previously processed frame. These two parameters are used for computation of noise threshold T. Using these parameters noise detection is performed to check if pixel is noisy or noise free and based on this result non-linear filtering is done.
Figure 3: Adaptive Threshold Algorithm Flowchart
4. SIMULATION USING MATLAB
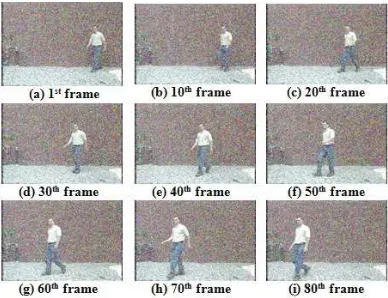
[image:5.595.307.502.362.513.2]The proposed adaptive threshold algorithm is implemented in MATLAB. The simulation result is compared with median filter in different noise density level. The input color video is converted to 80 video frames. The sequence of frames of input video is given in Figure 4. Only nine video frames are selected and arranged in 3x3 matrix format.
Figure 4: Sequence Of Frames From Original Video
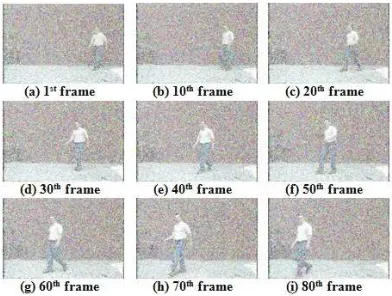
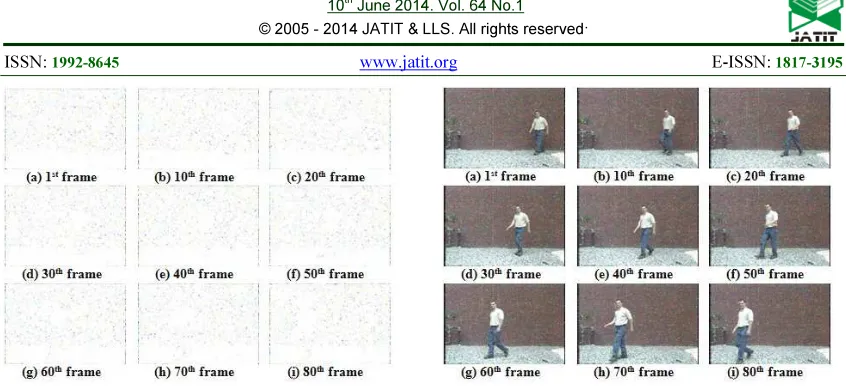
[image:5.595.308.502.555.704.2]Then impulse noise is added with various noise densities to input video. The Figure 5 shows the sequence of frames of noisy video with noise density of 10%
Figure 5: Sequence Of Frames From Noisy Video With 10% Noise Density
Figure 6: Sequence Of Frames From Noisy Video With 25% Noise Density
Input Video captured
The peakimpulse noise generated
The input video corrupted by the peak impulse noise
Noisy video converted to noisy images
Adaptive threshold T using ED and NC computed
Noisy pixel detected and the noise counter (ND)
incremented by 1
The processed pixel is noise free pixel Local mean of processed pixels DMi,j and
unprocessed pixels YMi,j Computed
Horizontal edge parameter (ED) computed
Y
N
( )
T YM DM f
Is ij ij j
i >
+ −
2
, . ,
Noisy pixel replaced by DM i,j
The Figure 6 shows the sequence of frames of noisy video with noise density of 25%. The Figure 7 shows the sequence of frames of noisy video with noise density of 50%.
Figure 7: Frames from noisy video with 50% noise density
[image:6.595.87.283.182.330.2]The Figure 8 shows the sequence of frames of noisy video with noise density of 80%.
Figure 8: Sequence of frames from noisy video with 80% noise density
[image:6.595.307.503.324.488.2]The noisy video is processed and filtered using median filter function which is present in the MATLAB. The output of median filter for 10% noise density is shown in Figure 9 as sequence of frames. In Figure 10, 11 and 12 the output of median filters for 25%, 50% and 80% noise density are shown respectively.
Figure 9: Sequence of output frames using median filter for 10% noise density
Figure 10: Sequence Of Output Frames Using Median Filter For 25% Noise Density
[image:6.595.87.282.405.552.2] [image:6.595.307.504.531.681.2]Figure 12: Sequence Of Output Frames Using Median Filter For 80% Noise Density
[image:7.595.308.502.319.466.2]The noisy video is also processed using adaptive threshold algorithm where noisy pixels are identified and then they are replaced by mean of already processed pixels and hence output video using adaptive threshold mean is acquired. Figure 13 shows the sequence of frames of output video using adaptive threshold mean for 10% noise density. In Figure 14, 15 and 16 the output of adaptive threshold mean algorithm for 25%, 50% and 80% noise density are shown respectively.
Figure 13: Output Frames Using Adaptive Threshold Mean Algorithm For 10% Noise Density
[image:7.595.87.284.441.600.2]Figure 14: Output Frames Using Adaptive Threshold Mean Algorithm For 25% Noise Density
Figure 15: Output Frames Using Adaptive Threshold Mean Algorithm For 50% Noise Density
Figure 16: Output Frames Using Adaptive Threshold Mean Algorithm For 80% Noise Density
[image:7.595.308.503.507.657.2]output video using adaptive threshold median algorithm for 10% noise density. Figure 18, 19 and 20 shows the sequence of frames of output video using adaptive threshold median algorithm for 25%, 50% and 80% noise density respectively.
Figure 17: Output Frames Using Adaptive Threshold Median Algorithm For 10% Noise Density
Figure 18: Output Frames Using Adaptive Threshold Median Algorithm For 25% Noise Density
[image:8.595.87.283.195.349.2]Figure 19: Output frames using adaptive threshold median algorithm for 50% noise density
Figure 20: Output Frames Using Adaptive Threshold Median Algorithm For 80% Noise Density
Thus the input video is corrupted by impulse noise with various densities. The noisy video processed by using median filter function, adaptive threshold mean algorithm and adaptive threshold median algorithm are shown.
5. RESULTS AND DISCUSSIONS
The quality of sequence of output frames can be measured using PSNR and MSE values. PSNR is often used as a quality measurement between the original and noise removed image. The higher the
PSNR, the better the quality of noise removed image. The MSE represents the Mean Squared Error between the noise removed image and the original image, whereas PSNR represents a measure of the peak error. The lower the value of
MSE, the lower the error. The MSE can be calculated using equation (7)
(
)
∑ =
∑
= −
= M
i N
j Xij Rij MN
MSE
1 1
2 1
(7)
Where X represents the original Image and R
represents the restored image. The size of the image is represented by the dimension M X N.
PSNR is Peak Signal to Noise Ratio and is measured in decibel (dB). It is defined by using
MSE and the maximum pixel value as in equation (8).
=
MSE
PSNR
2 10
255
log
[image:8.595.88.283.392.541.2]The higher the PSNR in the noise removed image, the better is its quality and is closer to the original image. In general, a higher PSNR value should correlate to a higher quality image. In our work, we have measured MSE and PSNR for three different algorithms to compare the quality of output video frames in different noise density level. Table 1 shows the MSE and PSNR values for Median Filter Function (MFF), Adaptive Threshold Mean (AT-Mean) algorithm and Adaptive Threshold Median (AT-Median) Algorithm in different levels of noise density.
Table 1: PSNR And MSE Values
Noise Density
MSE PSNR (dB)
MFF AT-
Mean AT- Median
MFF AT-
Mean AT- Median
10% 86.41 76.6 83.95 28.76 29.28 28.8
25% 317.03 140 136.6 23.11 26.6 26.4
50% 2.57e 443.9 454.2 14.02 21.65 21.4
80% 5.98e 1.39e 1.40e 10.35 16.92 16.6
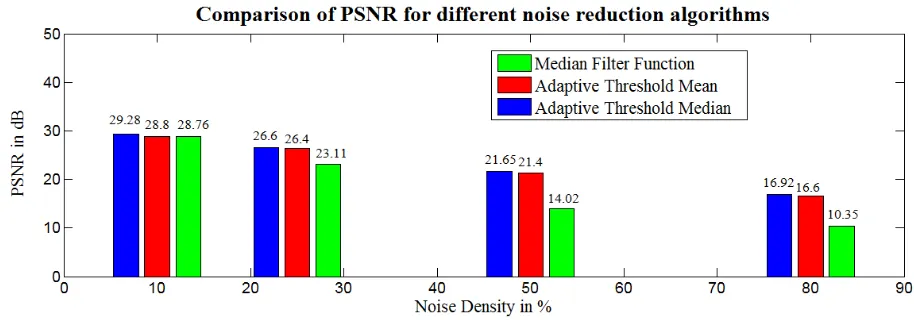
From the table it can be seen that adaptive threshold algorithm produce a higher PSNR value and hence it provides better result and higher quality images compared to median filters and its modifications. In high noise environment, adaptive threshold algorithm can retrieve the original information from the corrupted video frames. Based on the values of PSNR a bar chart is plotted between noise density in X axis and PSNR values in Y axis and is shown in Figure 21.
Figure 21: PSNR Vs Noise Density
In Figure 21, it can be seen that PSNR
values of adaptive threshold algorithm are high in 50% and 80% noise density when compared to
PSNR values of median filters and adaptive threshold algorithm results in efficient removal of impulse noise in high noise environment.
For color image processing, three noise filtering process have to be done to filter red-green-blue (RGB) components for each pixel directly. However, in order to reduce computational time we can convert RGB image into YUV domain. Since Y is luminance signal, the noise will clearly appear in color image if Y is corrupted signal. For image noise filtering, Y signal processing is much more important than U and V signals. Hence only Y signal is filtered with one noise filtering process.
6. CONCLUSION AND FUTURE WORKS
In this paper a high-performance algorithm for removing impulse noise from color video has been presented. The adaptive threshold algorithm is suitable for efficient removal of impulse noise in high noise environment. This algorithm provides better and fast filtering of noise than conventional and improved versions of median filters.
converter, the FPGA-based product can remove impulse noise in real time for current TV systems. A Reconfigurable System-on-Chip (RSoC) design for video noise reduction can be efficiently implemented by integrating the FPGA-based product with other interface components.
REFERENCES:
[1] Gonzalez & Woods. (2002) “Digital image processing”, 2nd edition, Prentice Hall,.
[2] Tong Sun, Moncef Galbouj and Yrjo Neuvo, “Analysis of two dimensional centre weighted median filter,”
Multidimensional systems and signal
processing, page no.159-172, January
1994.
[3] Vipul D.Punjabi,Shiv Kumar and Neetesh Gupta, “A survey on removal of impulse noise from images by reducing execution time,” World
Journal of Science and Technology
134-136,April 2012.
[4] Jasdeep Kaur, Pawandeep Kaur and Preetinder Kaur, “Review of impulse noise reduction techniques using fuzzy logic for image processing,”
International Journal of Engineering
and Research Technology, vol no.01,
July 2012.
[5] P.Kalaiselva, S.Vasantha, “VLSI implementation of impulse noise removal using image denoising technique,”IJCE,vol.02,no.02,
March2012.
[6] S.-C. Hsia, “Parallel VLSI design for a real-time video-impulse noise-reduction processor,” IEEE Trans.Very Large
Scale Integr.(VLSI) Syst., vol. 11,
no.4,pp. 651–658, Aug. 2003
[7] G.Sreedevi,Dr.M.ZKuria, “FPGA based denoising technique for efficient removal of impulse noise in images,”IEEE Trans.
[8] Eduardo Abreu, Michael Lightstone, Sanjit.K.Mitra and Kaoru Arakawa , “A New efficient approach for removal of impulse noise from highly corrupted images,”IEEE Transactions on Image
Processing,vol no.05, June 1996.
[9] ManoharAnnappa Koli, “Review of impulse noise reduction techniques,”International Journal of
Computer Science and Engineering, vol
no. 04,February 2012.
[10] I. Aizenberg and C. Butakoff, “Effective impulse detector based on rank-order criteria,” IEEE Signal Process. Lett., vol. 11, no. 3, pp. 363– 366, Mar. 2004.