Munich Personal RePEc Archive
Public Expenditure on Education and
Skill Formation: Is There a Simple Rule
to Maximize Skills?
Patron, Rossana and Vaillant, Marcel
Departamento de Economías, FCS-UdelaR
1 March 2011
Online at
https://mpra.ub.uni-muenchen.de/46740/
On: 01 June 2012, At : 11: 33 Publisher: Rout ledge
I nform a Lt d Regist ered in England and Wales Regist ered Num ber: 1072954 Regist ered office: Mort im er House, 37- 41 Mort im er St reet , London W1T 3JH, UK
Oxford Development Studies
Publicat ion det ails, including inst ruct ions f or aut hors and subscript ion inf ormat ion:
ht t p: / / www. t andf online. com/ loi/ cods20
Public Expenditure on Education and
Skill Formation: Is There a Simple Rule
to Maximize Skills?
Rossana Pat ron a & Marcel Vaillant a
a
Universit y of Uruguay, Const it uyent e 1502, Mont evideo, Uruguay Available online: 31 May 2012
To cite this article: Rossana Pat ron & Marcel Vaillant (2012): Public Expendit ure on Educat ion and Skill Format ion: Is There a Simple Rule t o Maximize Skills?, Oxf ord Development St udies, 40: 2, 261-271
To link to this article: ht t p: / / dx. doi. org/ 10. 1080/ 13600818. 2012. 678323
PLEASE SCROLL DOWN FOR ARTI CLE
Full t erm s and condit ions of use: ht t p: / / w w w.t andfonline.com / page/ t erm s- and- condit ions
This art icle m ay be used for research, t eaching, and privat e st udy purposes. Any subst ant ial or syst em at ic reproduct ion, redist ribut ion, reselling, loan, sub- licensing, syst em at ic supply, or dist ribut ion in any form t o anyone is expressly forbidden.
The publisher does not give any warrant y express or im plied or m ake any represent at ion t hat t he cont ent s w ill be com plet e or accurat e or up t o dat e. The accuracy of any
Public Expenditure on Education and Skill
Formation: Is There a Simple Rule to
Maximize Skills?
ROSSANA PATRON & MARCEL VAILLANT
ABSTRACT The ratio of skilled-to-unskilled labour stocks in the economy is widely acknowledged to have an important role for development. Can education policy affect the evolution of this ratio? This paper shows that it can: it also shows that the effect of education policy, for a given budget size, depends on the allocation rule across educational levels, particularly in the presence of systemic inefficiency. Using a stylized hierarchical education model, the theoretical conditions under which the allocation rule would favour the accumulation of skills are determined. The analysis has implication for policymakers in developing countries, where skill formation is much needed, because it shows that their allocation rules usually violate the maximization condition by assigning higher-than-optimal resources to higher education.
JEL Classification: I21, I22, I28
1. Introduction
Although the links between skills and growth, and hence education and growth, are well established theoretically, mainly in endogenous growth theory (see, e.g. Romer, 1986; Lucas, 1988), the empirical evidence is weak. To explain this, several authors (e.g. Gemmel, 1996; Birdsallet al., 1998; Papageorgiou, 2003) have stressed the importance of the distinction between the different stages of human capital creation for development and, therefore, the relevance of considering the internal allocation rules of the education budget.
The skill level of the population is usually measured by the average number of years of schooling of the population; as skilled and unskilled workers are not perfect substitutes, the structure of the stock of human capital is a crucial aspect. The skilled-to-unskilled stock ratio in developing and developed countries shows significant differences. According to data from UNESCO (2009) and OECD (2009), the proportion of the adult population with less than upper secondary as their maximum educational attainment in OECD-member countries is, on average, 30% (data for 2007), whereas for developing countries the proportion is much higher; for instance, in Brazil the rate is 63%, and it is even higher in many African countries, with rates of over 90%.
ISSN 1360-0818 print/ISSN 1469-9966 online/12/020261-11 q2012 Oxford Department of International Development http://dx.doi.org/10.1080/13600818.2012.678323
Rossana Patron, PhD and Marcel Vaillant, PhD, University of Uruguay. Constituyente 1502, Montevideo, Uruguay. Email: [email protected]
Oxford Development Studies, Vol. 40, No. 2, 261–271, June 2012
Explanations for this gap are fairly easy to find, as in developing countries the accumulation of skills is hindered by inefficient education systems, often aggravated by lack of resources. For this reason, the structure of the system matters because performance at earlier stages affects the output at higher levels; budget allocation rules should take this into account. To analyse this point, hierarchical education models have been used by Driskill & Horowitz (2002), Driskillet al.(2009), Su (2004, 2006), as well as Estevan & Verheyden (2010). However, this approach is not commonly used in discussing policy issues in education.
As noted by Su (2004), a hierarchical structure in educational systems implies that levels are not perfect substitutes, which means that different allocations of similar budget size have different effects on aggregate efficiency. Following this line of research, this article discusses the allocation rules of the educational budget in a two-level education system, using a stylized model characterized by internal inefficiency. In this model, contrary to that in Su (2004), an individual’s decision to become educated or to enter the labour market is not modelled; instead, the simple model here assumes a particular dropout function that easily captures the elements in an individual’s decision to study. Also, unlike the works of Su (2006) and Estevan & Verheyden (2010), which deal with the political economy of budget allocation, which is endogenously determined, the focus here is on the optimal conditions for budget allocation in a steady-state economy, so the growth approach of Driskill & Horowitz (2002) and Driskillet al.(2009) is not followed.
Although most of the results in the related literature converge, there is a trade-off between the model complexity in much of the previous literature and the simplicity of this model: while richer models allow the discussion of a wider set of related issues such as income distribution or political stability, in this model it is possible to determine the theoretical conditions for optimal budget allocation. The model allows us to determine the analytical conditions under which the allocation rule will favour a rise in the skilled-to-unskilled ratio; this approach also allows us to identify several clear-cut policy recommendations that may serve as easy-to-follow guides to policymakers in developing countries.
This paper is organized as follows. Section 2 presents an overview of educational budget allocation and the accumulation of skills in some developed and developing countries. Section 3 presents the model and its properties. In Section 4, the conditions necessary to maximize the stock of skills are discussed. The conclusion is presented in Section 5. In addition, an appendix with mathematical details is also presented.
2. Overview
The distribution of skills across countries varies considerably, especially between developed and developing countries (see Table 1). In developing countries, the majority of the population (more than a half) has primary education or less as their maximum educational attainment, whereas in developed countries this proportion is extremely low. In many developing countries, education systems have several weaknesses, especially in quality and coverage. In most cases, the expenditure on public education per student is far below that in the developed world, but as argued by Birdsallet al. (1998), Gemmel (1996) and Papageorgiou (2003), both the size and the efficiency of allocation of public funds for education are relevant for the overall performance of the system.
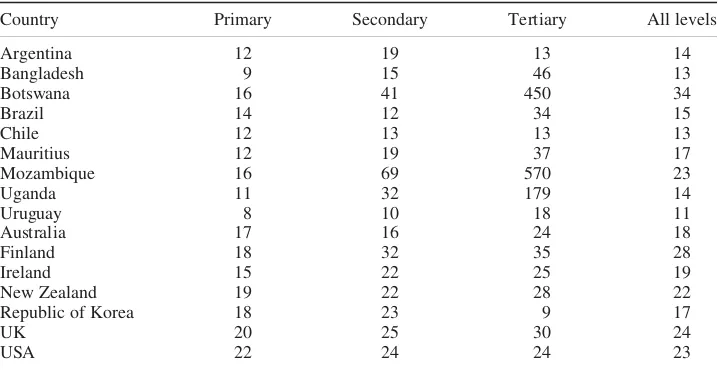
Some idea of actual allocation rules can be obtained by examining Tables 2 – 4. For instance, Table 2 shows that, in general, there are significant differences in budget allocation
preferences across the levels, measured by public expenditure per pupil as a percentage of GDP per capita by education level. The table shows that some countries, such as the USA, have a perfectly flat allocation pattern (all levels “equally preferred”), while Korea, for example, allocates less than average to higher education. The situation among developing Table 1. Educational attainment of the adult population (selected countries); distribution of the
population aged 25 and older, by highest level of education attained (in percentages)
Country Year
Completed primary or less
Lower secondary
Upper secondary
Tertiary education
Argentina 2004 43.8 14.2 28.4 13.6
Bangladesh 2001 73.3 9.6 12.9 4.2
Botswana 2000 75.3 15.7 5.9 3.1
Brazil 2004 57.5 13.0 21.2 8.1
Chile 2004 24.0 26.0 36.9 13.2
Mauritius* 2000 60.5 18.6 17.6 2.6
Mozambique 2000 96.9 2.3 0.8 0.1
Uganda 2002 88.5 5.1 1.6 4.8
Uruguay 2006 52.8 22.4 15.1 9.6
Australia 2005 9.1 25.8 33.3 31.5
Finland* 2006 22.0 8.9 38.8 30.3
Ireland* 2006 23.7 16.3 31.2 26.4
New Zealand 2005 21.3 51.6 27.1
Republic of Korea 2005/06 11.9 12.6 43.9 31.6
UK 2004/05 14.4 55.9 29.6
USA 2005 6.3 8.5 49.0 36.2
Notes: Latest data available. *Total may differ from 100% because of missing information or rounding. Upper secondary includes post-secondary non-tertiary.
Source: Data from UNESCO/UIS WEI (www.uis.unesco.org/publications/wei2007); UNESCO (2009).
Table 2. Public expenditure per pupil as a percentage of GDP per capita by education level (selected countries)
Country Primary Secondary Tertiary All levels
Argentina 12 19 13 14
Bangladesh 9 15 46 13
Botswana 16 41 450 34
Brazil 14 12 34 15
Chile 12 13 13 13
Mauritius 12 19 37 17
Mozambique 16 69 570 23
Uganda 11 32 179 14
Uruguay 8 10 18 11
Australia 17 16 24 18
Finland 18 32 35 28
Ireland 15 22 25 19
New Zealand 19 22 28 22
Republic of Korea 18 23 9 17
UK 20 25 30 24
USA 22 24 24 23
Source: Data from UNESCO database, http://stats.uis.unesco.org/unesco/ReportFolders/ReportFolders.a spx. Averages of available years 2004 – 06.
Is There a Simple Rule to Maximize Skills? 263
[image:5.496.54.413.408.594.2]countries is even more heterogeneous. For instance, while in countries such as Chile and Argentina the distribution is quite flat, there are many countries that display strong preferences for higher education, some of them extraordinarily high, such as Mozambique and Botswana. The variation in resource intensity per student across the country groups is even higher in absolute terms, as presented in Table 3.
[image:6.496.83.440.69.257.2]A relevant point here is to distinguish between the shares allocated to different levels and the absolute expenditures devoted to them. For instance, if we take Argentina, while
Table 3. Public expenditure per pupil (current dollars) (selected countries)
Country Primary Secondary Tertiary All levels
Argentina 536 816 572 631
Bangladesh 39 67 201 57
Botswana 822 2100 22 900 1725
Brazil 566 496 1360 603
Chile 706 783 764 746
Mauritius 622 999 1968 883
Mozambique 46 197 1633 67
Uganda 32 98 542 43
Uruguay 384 456 865 508
Australia 5255 4722 7206 5375
Finland 6864 12 122 13 063 10 583
Ireland 6018 8977 10 263 7823
New Zealand 4452 5176 6749 5254
Republic of Korea 2972 3806 1499 2828
UK 7473 9436 11 277 9044
USA 9573 10 680 10 664 10 267
Source: Data from UNESCO and World Bank, average of available years 2004 – 06,.http://stats.uis. unesco.org/unesco/ReportFolders/ReportFolders.aspx, http://data.worldbank.org/indicator/NY.
GNP.PCAP.CD
Table 4. Public education budget allocation across levels (in percentages) (selected countries)
Primary Secondary Tertiary Total
Argentina 37 39 23 100
Bangladesh 63 5 32 100
Botswana 26 36 37 100
Brazil 36 41 23 100
Chile 35 36 29 100
Mauritius 40 32 28 100
Mozambique 65 20 15 100
Uganda 71 13 16 100
Uruguay 34 38 28 100
Australia 31 37 32 100
Finland 23 43 35 100
Ireland 36 38 26 100
New Zealand 27 41 32 100
Republic of Korea 45 37 18 100
UK 34 39 27 100
Source: Data from UNESCO, averages of available years 2004 – 06, http://stats.uis.unesco.org/unesco/ ReportFolders/ReportFolders.aspx
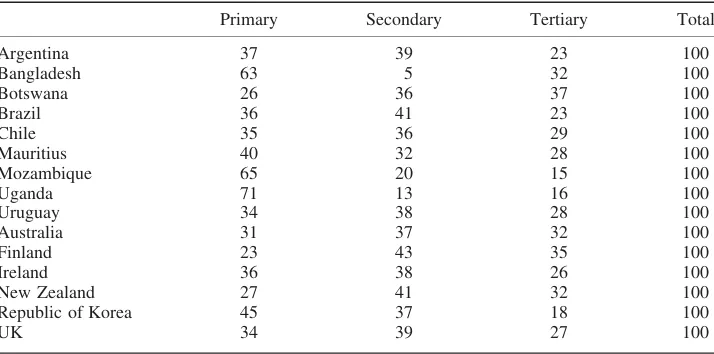
[image:6.496.82.439.418.595.2]the budget allocation rule might not be very different from that in Australia, as shown in Table 4, the size of the total budget introduces limitations to potential outcomes.
Taking the data in Tables 1 – 4, the observed differences in educational budget allocation rules and systemic performance, measured by the educational attainment of the population, lead us to consider the question of the role of budget allocation in skills formation. For instance, as noted by Gemmel (1996), there is a different skill level that contributes most to growth for each development stage: human capital effects on growth are most evident at the primary level in low-income countries; for higher-income developing countries, the key level is the secondary level, whereas in developed countries the tertiary level is the most relevant for economic growth. According to this approach, it seems apparent from the data that many African countries are using allocation rules that are contrary to their development needs. However, the evidence in less extreme cases is less easy to interpret. Analysis of the allocation rules for the more general case will be the focus of this paper. The role of budget allocation rules in the process of skills formation and the conditions necessary for efficient allocation will be discussed in the rest of the paper.
3. The Education Model
As the learning process is cumulative, the indicator fm (human capital) is defined as fm¼
P
m
qj, which is the knowledge accumulated per student who has completed up to level m, where qj measures knowledge accumulation per level. A two-level education system is considered to consist of basic and higher education (j¼B,H). The output per studentqjmeasures “school quality”, where qj¼qj kj
,kj is the resource intensity per student, and›qj=›kj.0,›2qj=›2kj,0. Students leave the system early when the quality
of education that they receive at the lower stage is poor; thus early exit rates ucan be expressed asu¼uðqBÞ, where›u=›qB,0 and›2u=›2qB,0. So,qjat different levels are not perfect substitutes, and hence the allocation of resources across them affects human capital accumulation.
Thus, the accumulation process is driven by
dLU¼uEBfB
dLS¼EHfH¼ ð12uÞEBfH;
wheredLUanddLSare the inflow of units of unskilled and skilled labour, respectively. The marginal ratio of skilled-to-unskilled labour produced can be defined as
jðkB;kHÞ ¼dLS dLU¼
12u u
fH fB
:
The ratio of skilled-to-unskilled labour in the economy is modified byj; thus, dealing with inefficiency optimally will allow the achievement of a maximum ratio of skilled-to-unskilled labour. As the marginal ratiojis dependent on the capital intensity of basic and higher education, total differentiation and some manipulation result in
^ j¼ fH^
fB
!
þS^
u;
Is There a Simple Rule to Maximize Skills? 265
where a hat (ˆ) placed over the variables denotes the rate of growth andSis the survival rate defined asS¼12u.
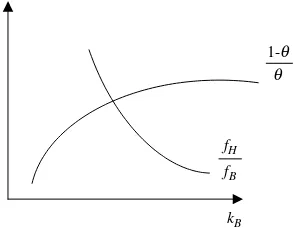
The evolution ofjdepends on the effects of allocation on the survival-to-exit rate and on the relative human capital accumulation across the levels. This is presented in Figure 1, considering
› 12u
u
=›kB .0; ›
2 12u u
=›2kB,0;› fH=fB
=›kB,0
and›2 fH=fB=›2kB.0:
Specific conditions allow us to determine the sign ofj(below). In general,dj.0when
d fH=fB
fH=fB
. 2d
12u=u
12u
ð Þ=u :
4. Properties and Implications
This section analyses the properties ofj. The underlying mechanism of the hierarchical model is simple: the allocation of more resources to higher education will increase the skilled-to-unskilled ratio (j), but if that budget increase implies lower quality in basic education, then the effect on j will be the opposite, because the number of potential entrants to higher education will necessarily shrink. The relative magnitude of both the effects will determine the net impact onj; this section discusses the conditions for and properties of these effects.
The main properties and implications are analysed in the following.
Proposition 1. ›j=›kH.0, given kB.
The demonstration is straightforward as ›j=›kH¼ ½ð12uÞ=uðqH=qBÞ, which is positive. The property applies to the effects of changes in the budget for higher education for a given budget for basic education.
Proposition 2. ›j=›kB.0 if 1uq
B.sHð12uÞ, where sH¼qH=fH and 1uqB¼
2›u=›qBqB=u(see Appendix1for Demonstration1). q
1-q
kB
fB
[image:8.496.186.333.57.173.2]fH
Figure 1. Variability ofjcomponents overkB.
The property applies to changes in the budget for basic education for a given budget in higher education. From this property, it follows thatjis a non-monotonic function ofkB. The capital intensity in basic education will have a positive effect on the marginal ratio of skilled-to-unskilled labour if the elasticity of the dropout variable to the quality of basic education (1uqB) is high. Therefore, for a givensH, if the survival parameter is too low, then
the possibility that the increase in capital intensity in basic education will have a positive effect on the marginal ratiojis higher.
Proposition 3. For a given budget, dj=dkB.0, if1uqB=ð1qBkBþ1qHkH1khkBÞ. sHð12uÞ,
where1ukB¼2›u=›kBkB=u,1kHkB¼2dkH=dkBkB=kHand1qjkj¼2›qj=›kjkj=qj, j¼B;H
(see Appendix1for Demonstration2).
This property describes the effects of changes in the allocation rule for a given budget. The allocation of more resources to basic education is more likely to increase the marginal ratio of skilled-to-unskilled labour (j), if the survival parameter 1ð 2uÞ is low (as in Proposition 2).
Proposition 4. Given BB¼KB=K, when Proposition 3 holds,›j=›k.0 (see Appendix1
for Demonstration3).
This property highlights the fact that the effect of changing the resource intensityk, given a particular allocation rule, is positive on the skilled-to-unskilled ratio; it follows that for a given allocation, the marginal ratio is a positive function of the size of the budget.
5. Are There Clear-cut Policy Recommendations?
For a given budget, it is possible to find a rule to maximize the skilled-to-unskilled ratio of labour produced by maximizing jðkB;kHÞ subject to K¼KBþKH and technology parameters.
From the first-order conditions, it follows that
dj
dkB ¼0,
1ukB
1qHkH1kHkBþ1qBkB
¼SHð12uÞ;
where1ukB¼2›u=›kBkB=u,1kHkB ¼2dkH=dkBkB=kHand1qjkj ¼2›qj=›kjkj=qj, with
j¼B,H. The program has no closed solution, but some clear hints can be obtained. It can be shown that
1jkB¼
1ukB
12u2sH 1qHkH1kHkBþ1qB kB
h i
:
In addition, considering the “quasi-neutral” assumption on education technology that 1qBkB¼1qHkH ¼1qjkj, the above-mentioned expression can be written as
1jkB¼ u 12u1ukB
1
u2sH1qjkj
2 sH
BH 1qjkj;
whereBH¼KH=Kis the participation of higher education in the total budget.
Is There a Simple Rule to Maximize Skills? 267
The determinants of the elasticity ofjwith respect to the resource intensity in basic education can be shown using the above expression. The elasticity of the marginal ratio of skilled-to-unskilled labour relative to the resource intensity in basic education is higher:
. the higher1ukB, the responsiveness of the early exit rate to the resource intensity; . the higherSB(sB¼12sH), the contribution of basic education in total human
capital accumulated;
. the lower BB (BB ¼12BH), the participation of basic education in the total budget.
The level of the early exit rate (u) has an ambiguous role. The former aspect listed is a pure technology parameter, whereas the latter is a pure policy variable; the second value listed is a combination of technology and policy aspects. It must be noted that education technology plays a crucial role. For instance, in an extreme case1ukBcould be
zero, in which case the effect onjdue to an increase inkBwould be negative. These results imply that in many developing countries with bad systemic outcomes due to the poor performance of basic education, an increase in the share of resources to basic education (BB ¼KB=K) could be effective in increasing the amount of skilled labour in relation to unskilled labour. A simple example will provide more insight into this issue.
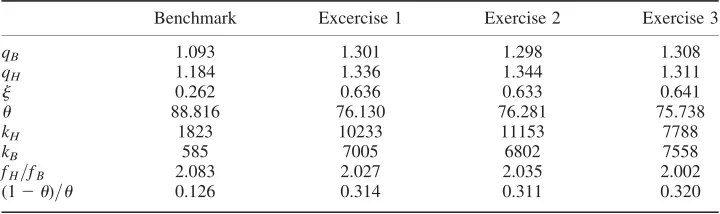
Table 5 presents the benchmark values of the variables of the model, for a reasonable set-up of parameters corresponding to a typical developing country, and the results of simulated changes in the size and allocation of the budget. The results displayed in this table correspond to the following exercises: (i) Benchmark:Klow andBB¼0:74(typical
developing country); (ii) Exercise 1: assumes K high (budget-rich country size) and BB ¼0:74; (iii) Exercise 2: assumes Khigh (budget-rich country size) and BB¼0:72 (rich country allocation rule); (iv) Exercise 3: assumesKhigh (budget-rich country size) andBB ¼0:80, conveniently selected.
[image:10.496.80.440.479.586.2]As the table shows, a higher budget would increasej(Exercise 1); but the rich country allocation rule is not the best option for the developing country (Exercise 2), as a higher allocation to basic education (Exercise 3) would be better.
Table 5. Simulation exercises
Benchmark Excercise 1 Exercise 2 Exercise 3
qB 1.093 1.301 1.298 1.308
qH 1.184 1.336 1.344 1.311
j 0.262 0.636 0.633 0.641
u 88.816 76.130 76.281 75.738
kH 1823 10233 11153 7788
kB 585 7005 6802 7558
fH=fB 2.083 2.027 2.035 2.002
ð12uÞ=u 0.126 0.314 0.311 0.320
Source: Authors’ calculations. Simulation results using data from UNESCO database (average of selected countries with availability of all required data). Developed group: UK, Ireland, Finland and Korea; developing group: Argentina, Brazil, Chile and Uruguay.
6. Conclusions
The evolution of the ratio of skilled-to-unskilled labour stocks in the economy is relevant to development policy given the imperfect substitutability of both factors and the central role of human capital for development. Can education policy affect the evolution of this ratio? This paper has shown that it can, and has presented the general theoretical conditions necessary for maximizing it.
The paper follows an increasingly important line of research that focuses on the key role played by allocation of the education budget in generating skills. The contribution of the paper lies in the strategy used to analyse the optimal allocation, which has several advantages. In particular, in contrast to the previous literature, the analysis suggests theoretically optimal conditions for efficient budget allocation and offers easy-to-follow rules for policymakers. The stylized version of the hierarchical education model allows us to focus on the links between alternative budget allocation rules and the production of human capital. The analytical conditions under which the skilled-to-unskilled ratio will reach a maximum, given the total resources assigned to the education system, are discussed thoroughly. Drawing on the data for a set of real economies, it has been shown through a series of simulations that the optimal allocation rule for a developing country would require the allocation of relatively more resources (proportionally) to basic education in comparison with developed countries.
The analysis has implication for policymakers in developing countries, where skill formation is much needed, because it shows that the allocation rules observed in many developing countries usually violate the maximization condition by assigning higher-than-optimal resources to higher education. A further implication is that as long as the marginal skilled-to-unskilled ratio regulates the wage gap, a less-than-maximum value would worsen the wage distribution.
References
Birdsall, N., Londono, J. & O’Connell, L. (1998) Education in Latin America: demand and distribution are factors that matter,Cepal Review, 66, pp. 39 – 52.
Driskill, R. & Horowitz, A. (2002) Investment in hierarchical human capital,Review of Development Economics, 6(1), pp. 48 – 58.
Driskill, R., Horowitz, A. & Mendez, F. (2009) Hierarchical human capital and economic growth theory and evidence,Journal of Institutional and Theoretical Economics, 165, pp. 723 – 743.
Estevan, F. & Verheyden, B. (2010) The political economy of public spending, between compulsory and higher education, Paper presented at the Latin American and Caribbean Economic Association, Medellin, Colombia, November.
Gemmel, N. (1996) Evaluating the impacts of human capital stocks and accumulation on economic growth. Some new evidence,Oxford Bulletin of Economics and Statistics, 58, pp. 9 – 28.
Lucas, R. (1988) On the mechanics of economic development, Journal of Monetary Economics, 22, pp. 3 – 42.
OECD (2009) Education at a Glance 2009,OECD Indicators, available at: http://www.oecd.org/dataoecd/41/25/ 43636332.pdf (accessed 15 December 2010).
Papageorgiou, C. (2003) Distinguishing between the effects of primary and post-primary education on economic growth,Review of Development Economics, 7(4), pp. 622 – 635.
Romer, P. (1986) Increasing returns and long run growth, Journal of Political Economy, 94(5), pp. 1002 – 1037.
Su, X. (2004) The allocation of public funds in a hierarchical education system,Journal of Economic Dynamics and Control, 28, pp. 2485 – 2510.
Is There a Simple Rule to Maximize Skills? 269
Su, X. (2006) Endogenous determination of public budget allocation across education stages, Journal of Development Economics, 81, pp. 438 – 456.
UNESCO (2009) Global Education Digest 2009. Comparing Education Statistics Around the World (Montreal: UNESCO Institute for Statistics).
Appendix 1
Preliminary Results
The educational budget constraint is
K ¼KBþKH:
By definition,k¼kBþð12uÞkH, wherek¼K=EB. Thus,
dkH ¼212u2ðk2kBÞu0
dkB=ð12uÞ2: ðA1Þ
Also, after some manipulations, this expression can be written as
1kHkB ¼
KB KH
þ u
12u1ukB; ðA2Þ
where1ukB¼2›u=›kBkB=uand1kHkB ¼2dkH=dkBkB=kH.
Demonstration 1
Total differentiation ofjresults in the following:
dj¼ ›j
›kH dkHþ
›j
›kB
dkB; ðA3Þ
where
›j
›kB ¼2 1
uqB 12u
ð ÞqH
qB
q0Bþ ðqBþqHÞu 0
u
ðA4Þ
and
›j
›kh¼ 12u
u
q0H
qB: ðA5Þ
While the sign of›j=›kH.0, that for ›j=›kB is indeterminate. The conditions under which›j=›kB .0 are easy to find. Considering the following definitions, SH¼qH=fH and 1uqB¼2›u=›qBqB=u¼2u
0
qB=u, and substituting in Equation (A3) after some manipulation, the following is obtained:
›j
›kB
.0, 1uqB.SHð12uÞ:
Demonstration 2
Inserting Equations (A1), (A4) and (A5) in Equation (A3), as well as using the definition 1ukB¼2›u=›kBkB=u, after some manipulation the following result is obtained:
dj
dkB.0,
1ukB
1qHkH1kHkBþ1qBkB
.SHð12uÞ:
It can also be shown that
1jkB¼
1ukB
12u2SH 1qHkH1kHkBþ1qB kB
h i
:
Inserting Equation (A2) in the above expression and defining BH¼KH=K, and considering the “quasi-neutral” assumption that 1qBkB ¼1qHkH ¼1qjkj, the following is
obtained:
1jkB¼
1ukB
12u 12SH1qjkju
2SH
BH 1qjkj:
Demonstration 3
›j=›k.0 as›j
›k¼
›j ›kB
›kB
›k þ
›j ›kH
›kH
›k, is positive, resulting from
›kB ›k;
›kH
›k positive for given allocation structure, and ›j
›kB; ›j
›kH positive for increasing budget allocated to basic and
higher education (Proposition 2 holds).
Is There a Simple Rule to Maximize Skills? 271