Histogram Equalization on Wavelet Based
Compression Techniques
Sandeep Dalal, Ph.D
Assistant professorComputer Science and application DCSA Maharshi Dayanand University, Rohtak
Poonam Rani
M.Tech ScholarComputer Science and application DCSA Maharshi Dayanand University, Rohtak
ABSTRACT
This paper analyzes the effect of histogram equalization on the wavelet based compression techniques. Image compression is re-ducing the size of an image using one of the encoding tech-niques. Encoding helps in saving disk space by representing the same data in lesser number of bytes. Histogram is a graphical representation of intensity distribution of an image. It expresses the number of pixel values for each intensity value of an im-age. Histogram Equalization is a method used to improve the contrast of an image to stretch out the full range of an inten-sity .Comparison among algorithms has been made with respect to PSNR (Peak signal to noise ratio), MSE (Mean square er-ror), MAE (Mean Absolute Erer-ror), L2RAT, Compression ratio.
General Terms:
Image Processing, Wavelet based compression techniques
Keywords:
Wavelet,EZW,SPIHT,Histogram,WDR,image compression
1. INTRODUCTION
Data compression is representing the data in a compressed Form. Data means the information in digital form on which computer pro-grams operate. Compression is a method to reproduce the data into a less redundant form. Decompression is the reverse process of compression which means one can derive the original data from the compressed data [1]. Image compression is to reduce the re-dundancy and correlation in images. Image compression plays an important role in much multimedia application such as image stor-age and transmission. The basic goal of imstor-age compression is to represent an image with minimum number of bits but still gener-ating acceptable image quality. Redundancy means repetitive data in image. Compression can be achieved through removal of redun-dancies and irrelevancy. Irrelevancy means the part of information that could not be noticed by human visual system. These are the following redundancies,
—Coding Redundancy —Inter pixel Redundancy —Psycho-visual Redundancy
Coding redundancy is related to representing the information in terms of code. Huffman coding and arithmetic coding are the exam-ples of coding redundancy. Inter pixel redundancy is due to the cor-relation between neighbouring pixels in an image. Psycho-visual redundancy refers to the unimportant details as perceived by hu-mans visual system.
2. COMPRESSION TECHNIQUES
There are two types of compression techniques :
—Lossless compression. —Lossy compression.
2.1 Lossless Compression
Lossless compression is encoding without loss of details. Hence the decode information fully returns the original data. Lossless tech-niques are useful in encoding images,random text files or software executable. It reduces size of file or data to great extent by quantify-ing redundancy present in data. In case of images, it produces better quality image on decompression because there is no loss of data in encoding. On its downside it produces low compression ratio [1].
2.2 Lossy Compression
Lossy compression are those techniques by which one cannot fully reconstruct the original image from the compressed bit streams. Lossy compression means some information is lost during encod-ing process. Lossy compression provides only approximate data after decompression. Lossy compression techniques are useful in the following stream like audio,video,sound and multimedia im-ages etc.
It reduces the file to relatively smaller size compared to lossless compression. It takes less memory to produce high compression ratio but makes it less inappropriate to important applications like medical imaging etc[1].
There are many techniques for lossy compression but two of them have been discussed,
—Transform coding.
—Wavelet based compression.
are Fourier transform, discrete cosine transform and wavelet trans-form etc. Fourier transtrans-form changes the spatial value of a pixel into a frequency domain. It decomposes the signal into sine and cosine wave. Wavelet transform changes the spatial value of pixel into both frequency and time domain. Using wavelet transform on an image one can easy find out the high and low frequency area of an image. Discrete cosine transform also transforms the spatial do-main into a frequency dodo-main similar to discrete Fourier transform.
2.2.2 Wavelet Based Compression. Wavelet transform are based on small waves called wavelets. Wavelet transform applied on an image represents both frequency and time domain.
Wavelet based compression techniques.
—Embedded Zero Tree Wavelet (EZW) —Set Partition in Hierarchical Tree (SPIHT) —Wavelet Difference Reduction(WDR)
2.2.3 Embedded Zero Tree Wavelet. EZW compression algo-rithm proposed by Shapiro is specially designed to be used with wavelet transform. EZW is based on progressive encoding to com-press an image into a bit stream with increasing accuracy. This means that when more bits are added to the stream the decoded image will contain more details. Both lossless and lossy coding is possible with EZW[2][5].
2.2.4 Set Partition in Hierarchical Tree(SPIHT) Compression. SPIHT algorithm is the enhanced version of EZW algorithm. SPIHT is wavelet based image compression method. It uses the spatial orientation tree data structure on the wavelet coefficients and compares all values with the threshold value to find the significant or insignificant values. SPIHT provides features like progressive image transmission, fully embedded coded file, simple quantiza-tion algorithm, fast encoding/decoding, completely adaptive, loss-less compression, exact bit rate coding and error protection. But some limitations are that they represent the implicit position of the wavelet coefficients and consumes more memory space[6].
2.2.5 Wavelet Difference Reduction Compression. WDR algo-rithm is performed on the wavelet coefficients. Limitation in the SPIHT algorithm is that it only implicitly locates the position of the significant coefficients. One can not perform the region of the interest (ROI) means one cannot select the particular portion of the compressed image to work upon. wavelet difference reduction compression method finds the exact position of the wavelet coeffi-cient by using the predefined scanned order. It also converts the 2-dimensional data into 1-2-dimensional before performing WDR cod-ing and finds the significant transform value by uscod-ing the index coding method[7].
3. WHAT IS IMAGE ENHANCEMENT
Image enhancement is the process by which one improves an im-age so that it depicts better detail for some parameter. An imim-age is enhanced by using following techniques
—remove additive noise and interference —remove multiplicative interference —increase its contrast
—decrease its blurring
Some of the methods used to achieve the above are
—smoothing and low pass filtering —sharpening or high pass filtering
—histogram manipulation and generic de-blurring algorithms, or algorithms that remove noise while avoiding blurring the im-age[8]
4. HISTOGRAM
Histogram is a graphical representation of intensity distribution of an image. It expresses the number of pixel values for each inten-sity value of an image. Histograms provide a full description of the intensities of an image. It also provides insight into contrast and brightness. In a dark image the components of the histogram are concentrated on the lower side of the intensity scale. Similarly, the components of the histogram of the light image are biased towards the higher side of the scale. An image with low contrast has narrow histogram located typically towards the middle intensity scale [3].
4.1 Histogram Equalization
Histogram equalization is a method used to improve the contrast of an image to span the full range of an intensity value. Histogram equalization technique cant be used for images suffering from non-uniform illumination in their backgrounds as this process only adds extra pixels to the light regions of the image and removes extra pixels from dark regions of the image resulting in high dynamic range in output image [3]. The purpose of histogram equalization is to equally use all available gray level values in dynamic range. In histogram equalization technique, it is the probability density function (pdf) that is being manipulated. To make it simple, what histogram equalization technique does is that, it changes the pdf of a given image into that of a uniform pdf that spreads out from the lowest pixel value (0 in this case) to the highest pixel value (L - 1). This can be achieved quite easily if the pdf is a continuous function. Dealing with a digital image, the pdf will be a discrete function. Let there be an image x, and let the dynamic range for the intensityrkvaries from 0 (black) to L - 1 (white). This pdf can be
approximated using the probability based on the histogramp(rk)
as follows [4,12,13,14].
pdf(x) =p(rk) =
(T otal pixels with intensity rk)
(T otal pixels in image) (1)
From this pdf, one can then obtain the cumulative density function (cdf) as follows [4,12,13,14].
cdf(x) =
L−1 X
k=0
P(rk) (2)
Wherep(rk)is the probability for pixel of intensity. The output of
a pixel from the histogram equalization operation is then equal to the cdf of the image or mathematically [4,12,14].
p(sk) = L−1 X
k=0
P(rk) (3)
To get the value of the pixel,p(sk)needs to be multiplied by L –1
and then rounded to the nearest integer [4,13,14].
5. PERFORMANCE MEASUREMENT PARAMETERS
These are the parameter used to measure the quality of image.
—Compression ratio
—MSE(mean square error) —L2RAT
—MAE(mean absolute error)
5.1 Compression Ratio
It is the ratio between the size of the compressed data and the size of the original data.
CR= (Size af ter compression)
(Size bef ore compression) (4)
5.2 MSE(Mean Square Error)
Mean Square Error represents the averages of the square of errors between original image and decompressed image. MSE should be minimum. Small MSE values means image is of good quality .
M SE= 1
M N
M
X
i=1
N
X
j=1
(Ai,j−Bi,j)2 (5)
’A’ represents the matrix data of our original image and ’B’ repre-sents the matrix data after decompressing the image. Where M and N is the number of rows and columns of an image. I and J is the index of rows and columns of matrix of image [9].
5.3 PSNR(Peak Signal To Noise Ratio)
PSNR represents the peak error. PSNR should be high because it shows that signal-to-noise is high. PSNR is usually expressed in terms of the logarithmic decibel scale [9].
P SN R= 10 log 255
2
M SE (6)
5.4 L2RAT
L2RAT is the ratio of the squared norm of the signal or image ap-proximation[11].
5.5 MAE(Mean Absolute Error)
It is used to measure how close forecasts or our predictions are to the eventual outcomes. Mean Absolute error is given by [10]:
M AE= 1
N
N
X
i=1
|Ai−Bi| (7)
6. EXPERIMENT RESULTS
Experiments were performed on the image with dimensions 256*256 use the MATLAB Wavelet toolbox.
—DWT(DB5) is applied to decompose image to 8 levels and 9 loops.
—Image is compressed using EZW,SPIHT and WDR.
—Image is decompressed and converted into RGB to HSV mode. —Histogram equilization is applied on ”v”(value).
—Image is converted to RGB again and parameters are collected and comparison is established.
[image:3.595.332.549.72.264.2]These are shown in the fig 1,2,3.
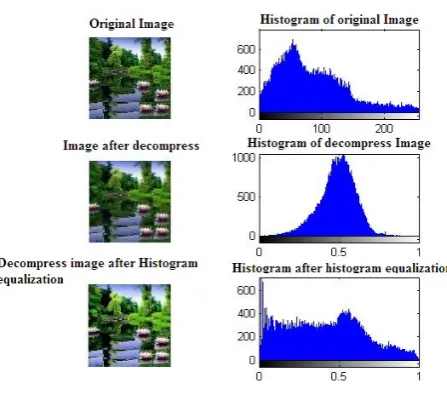
[image:3.595.317.541.292.483.2]Fig. 1. EZW Image Compression with Historogram Equalization
[image:3.595.323.547.512.712.2]7. PERFORMANCE ANALYSIS
[image:4.595.316.556.106.642.2]Quality of image are measured by using performance measurement parameter.
Table 1. Represents the size of image before and after compression
Sr.
No. Techniques
Size before compression (KB)
Size after Compression (KB)
Dimension 1 EZW 32 28 256*256 2 SPIHT 32 20 256*256 3 WDR 32 24 256*256
Table 2. Performance Between original image and reconstructed image
Sr.
No. Techniques PSNR
(db) MSE MAE
[image:4.595.61.289.144.213.2]L2RAT (%) 1 EZW 24.34 239.5 94 98.18 2 SPIHT 21.14 499.8 155 95.43 3 WDR 24.12 252.1 96 97.86
Table 3. Performance Between original image and reconstructed
image
Sr.
No. Techniques CR
(%) B.P.P 1 EZW 4.990 1.1975 2 SPIHT 1.222 0.2935 3 WDR 5.517 1.3242
7.1 Graphical representation of comparison
—”Original and reconstructed” represents comparison between original image and reconstructed image after compression using one of the encoding algorithms.
—”Original and Histogram equalized” represents comparison be-tween original image and the image formed after applying his-togram equalization on reconstructed image from encoded im-age.
—”Reconstructed and histogram equalized” represents comparison between reconstructed image and image formed by applying his-togram equalization on this reconstructed image.
Refer fig 4,5,6.
8. CONCLUSION
In this paper the results were compared for three different wavelet based compression techniques. The results of the above three tech-niques EZW,SPIHT and WDR are compared on parameters like PSNR , MSE ,MAE,L2RAT,compression ratio. Perform histogram equalization to enhance compressed image after encoding by three techniques and measure performance further by using such param-eters. EZW and WDR provide better image quality than SPIHT. If image is distorted after compressed by wavelet based compression techniques than it is improved by using Histogram equalization.
Fig. 4. Peak Signal to Noise ratio chart
Fig. 5. MAE chart
[image:4.595.104.243.336.420.2]Table 4. Performance Between original image and histogram equalized image
Sr.
No. Techniques PSNR
(db) MSE MAE L2RAT 1 EZW 8.0723 1.0555 254.189 0.0209 2 SPIHT 8.0717 1.0559 254.260 0.0214 3 WDR 8.0723 1.0555 254.189 0.0209
Table 5. Performance Between reconstructed image and histogram equalized image
Sr.
No. Techniques PSNR
(db) MSE MAE L2RAT 1 EZW 8.26 911.79 254 0.0168 2 SPIHT 8.48 781.73 254 0.0133 3 WDR 8.26 911.79 254 0.0168
9. REFERENCES
[1] Fundamental Data Compression ,By Ida Mending PuButter worth-Heinemann ,English , 2205 , ISBN 0750663103. [2] Digital Image Processing ,By Jayaraman.
[3] Ms. S. Gupta, Mr. S. S. Purkayastha, Image Enhancement and Analysis of Microscopic Images using Various Image Process-ing Techniques, International Journal of EngineerProcess-ing Research and Applications (IJERA), Vol. 2, Issue 3, May-Jun 2012 . [4] R.G. Gonzalez and R.E. Woods, Digital Image Processing, 3rd
ed. Publishing House of Electronics Industry, Beijing, pp. 129, 142, 174-176, 178.
[5] Shapiro J.M. Embedded image coding using zero trees of wavelet coefficients. IEEE Trans. Signal Proc., Vol. 41, No. 12, pp. 3445 (3462, 1993).
[6] A. Said, W.A. Pearlman. A new, fast, and efficient image codec based on set partitioning in hierarchical trees. IEEE Trans. on Circuits and Systems for Video Technology, Vol.6, No. 3, pp. 243 -250, 1996.
[7] Y. Yuan, M. K. Mandal. Novel embedded image coding algo-rithms based on wavelet difference reduction, in: Proceedings of IEEE International Conference on Vision
[8] Image Processing: The Fundamentals, Second Edition Maria Petrou and Costas Petrou 2010 John Wiley Sons, Ltd. ISBN: 978-0-470-74586-1
[9] http://www.ni.com/white-paper/13306/en/ [10] http://www.wikipedia.org
[11] http://www.mathworks.in/help/wavelet/ref/mease.html [12] http://202.3.77.50/ opticalv/interferometry/image
[13] Image Enhancement Problem, use the following site http://www.fke.utm/lab/dsp/file/Uji1Problem.pdf