How to cite this paper: Eltayeib, A.A. (2014) Estimation of Trace Elements in Fly Ash Released from Coal Combustion. Open Access Library Journal, 1: e432. http://dx.doi.org/10.4236/oalib.1100432
Estimation of Trace Elements in Fly Ash
Released from Coal Combustion
Ali A. Eltayeib
Department of Chemistry, Faculty of Science, Kordofan University, Elobeid, Sudan Email: [email protected]
Received 19 April 2014; revised 21 May 2014; accepted 19 June 2014
Copyright © 2014 by author and OALib.
This work is licensed under the Creative Commons Attribution International License (CC BY). http://creativecommons.org/licenses/by/4.0/
Abstract
Qingshan Thermoelectric Plant located in Wuhan City, Hubei Province, China, and it uses coal as a fuel. Coal combustion generates not only gaseous pollutants like SO2 and NOx but also toxic and
heavy metals to the atmosphere. From the environmental point of view, the determination and speciation of trace toxic and heavy metals released from coal combustion are very important. In this work, the atomic spectroscopic methods for determination of some trace elements were first established. Graphite furnace atomic absorption spectrometry (GFAAS) method was used to de-termine the trace Pb in standard reference material SRM 8322 (fly ash from combustion of pulve-rized coal). The hydride generation atomic absorption spectrometry coupled with flow injection analysis (HGAAS-FIA) was used to analyze the concentration of As in SRM 8322 and the ICP-AES for determination of trace elements Co, Ni, Cu, Cr, etc. For the laboratory research work, all the coal samples were digested with a mixture of acids (HNO3-HF-HCLO4) after burned at 650˚C for one
hour. Based on the establishment of atomic spectroscopic determination methods Tessier sequen-tial speciation and separation methods were used in the studies of speciation distribution of some heavy metals in fine particles released from coal combustion of Qingshan Thermoelectric Plant. The transition elements in two samples from Qingshan Thermoelectric Plant (with different com-bustion condition) were extracted into five fractions by sequential extraction. In each fraction a suitable reagents with an optimum pH and time were used. Centrifugate separation of liquid part from the solid part was used after each fraction, the liquid part is taken for analysis and the solid part was extracted with a suitable reagents for the next fraction and the reaction continued for certain time. This procedure was done for the five fractions (exchangeable, carbonate bounded, Fe-Mn oxide bounded, organic matter bounded and residual). The experiment of the stimulant ac-id rain reacted with coal ash were also done in order to evaluate the transformation of these trace elements into water system after the fine particles of coal ash act with acid rain. The results showed that most parts of the metal in particles are stable. In order to study the distribution ten-dency of trace elements in coal, the separation of different coal particles were done using organic solvent extraction and gravity settlement method. The results showed that different trace ele-ments had different distribution tendency in coal.
Keywords
OALibJ | DOI:10.4236/oalib.1100432 2 June 2014 | Volume 1 | e432
Subject Areas: Metal Material, Organic Chemistry, Organic Polymer Materials
1. Introduction
sam-OALibJ | DOI:10.4236/oalib.1100432 3 June 2014 | Volume 1 | e432 ples of uranium metal and thorium oxide using a small column of chelx-100 [17]. Multi-element GFAAS was used for the determination of minor and trace amount of elements in silicate rock, lake and stream sediments [18]. Co-precipitation with metal hydroxide is a useful pre-concentration technique in trace analysis and radio-chemistry [19]-[21] with a simple procedure, traces of heavy metals in an aqueous solution are simultaneously and quantitatively collected on the gathering precipitates. Among the metal hydroxides used for co-precipitation was Tin(IV) hydroxide for the determination of trace heavy metals by GFAAS [22]. GFAAS has been used for the direct determination of the pro-oxidant Cu, Fe and Ni in crude and refined edible oils [23] and fats. An ul-trasonic slurry sampler with GFAAS was used for the determination of particulate elements in edible oils and fats [24]. For determination of the elements the application of hydride generation (HG) techniques to AAS is well established [25]-[27]. Flow injection analysis (FIA) has been widely used, mainly in the field of colorime-try [28], also it was applied as an automatic sample injection technique for flame AAS [29]-[31]. It was used as an on-line pretreatment method for AAS to concentrate by chelate resin [32] or solvent extraction [33] and to remove interferences by ion-exchange [34]. The FIA technique combined with the gas-segmentation method [35] is applied for the HG-AAS of arsenic, antimony, bismuth, selenium, and tellurium, and its applicability for en-vironmental analysis was exhibited by determining these elements in several NBS SRMS. One of the characte-ristics of the FIA in contrast to the conventional continuous flow analysis is the injection of a discrete sample into a continuous carrier flow without gas segmentation, which enabled the rapid and precise determination by using transient signals [36]. The effect of injection rate on the peak height in several combinations of the sample and NaBH4 solutions was shown, and the effect of pH on the peak height absorbance of several arsenic and se-lenium species was investigated [37]. For the determination of antimony and arsenic in copper and steel using FIHGAAS, L-cysteine was used as a reducing and releasing agent [38]. Several experimental procedures, vary-ing in manipulative complexity, have been proposed for determinvary-ing the speciation of particulate trace metals. These procedures can be grouped into 1) methods designed to effect the separation between residual and non re-sidual metals only and 2) more elaborate methods making use of sequential extractions. The former method normally involve a single extraction and offer a better contrast between anomalous and back ground samples than does the determination of the total metal concentration. Despite their rapidity and relative simplicity these techniques suffer from the difficulty of finding a single reagent effective in dissolving quantitatively the non re-sidual forms of metal without attacking the detrital forms. The use of sequential extraction although more time consuming, furnishes detailed information about the origin, mode of occurrence, biological and physicochemical availability, mobilization, and transport of trace metals. Two major experimental problems with sequential pro-cedures have been recognized: non selectivity of extractants, and trace elements redistribution among phases during extraction [39]. Generally it is difficult to associate a given extractant reagent with a particular physico-chemical phase. Most validation studies have focused on selectivity and extraction completeness rather than re-distribution and predominantly from the stand point of major species rather than trace elements [40]-[42]. The partitioning obtained by such procedures is, however, influenced by factors such as the choice of reagents used for the various extractions and the extraction sequence, and the time of extraction [40] [43]-[45]. In this work, based on the research of the distribution of trace element in coal, Tessier sequential extraction method and acid rain simulation method were used to evaluation of speciation of some trace elements in particles released from coal combustion.
2. Experimental
2.1. Instrumentation and Reagents
2.1.1. GFAAS
3200 Atomic absorption spectrometry (Shanghai Analytical Instrumentation Factory) equipped with graphite furnace and with deuterium back ground correction was used throughout the work. The instrument was cooled during heating by water and argon was used as a carrier gas. Lead hollow cathode lamp operated at 6 mA with wave length 2833 nm was used. The instrument connected with desk automatic balancing recorder (Dahua in-strument factory Shanghai China). The optimized parameters were 0.12 A; 30 S (dry temperature), 0.47 A; 30 S (ash temp.) and 2.1 A; 4 S (atomization temp.). As shown in Table 1. All reagents used in this work were of analytical-reagent grade, and doubly de-ionized water was used throughout. The stock standard solution, 1000 mg∙L−1
OALibJ | DOI:10.4236/oalib.1100432 4 June 2014 | Volume 1 | e432 Table 1. Parameters for GFAAS determination of lead.
Wave length
Current for HCl
Drying temp. Ashing temp. Atomization temp. Injection volume Current Time Current Time Current Time
2833 6 mA 0.12 A 30 S 0.47 A 30 S 2.1 A 4 S 20 µL
2.1.2. HGAAS-FIA
3200 Atomic absorption spectrometry (Shanghai Analytical Instrument Factory) with arsenic hollow cathode lamp operated at 10 mA with wave length 1937 nm was used throughout the work with increment 7. The in-strument connected with desk automatic balancing recorder (Dahua Inin-strument Factory Shanghai China), peris-taltic pump (Gilson Minipuls 2), injection valve, reaction cell, gas-liquid separator, air/C2H2 flame heated quartz cell. All reagents were of analytical reagent grade, and doubly de-ionized water was used throughout. The stock standard solution, 1000 mg∙L−1 for As(III) was prepared from sodium arsenite (NaAsO2) with water. The stock standard solution, 1000 mg∙L−1 for As(V) was prepared from sodium arsenate (Na3AsO4∙12H2O) with water. L-cysteine stock solution was prepared by dissolving 5 g of L-cysteine (C3H7NO2S) in 100 ml of 0.5 mol/L HCl, for the prereduction of arsenic (V), 2 ml of L-cysteine stock solution were added per 10 ml.
2.1.3. ICP-AES
A spectro ICP-AES (Made in W. Germany 1991) controlled by an IBM ps/2 computer, was used throughout this work. PH meter and centrifuge were also used. Pump speed 2 ml/min and tube length 110 cm. The power of emission 1200 W.
All reagents were of analytical-reagent grade, and doubly de-ionized water was used throughout. The stock standard solutions used were as follows: GBW (E) 08005 100 µg/ml for Cd, WB0113 100 µg/ml for Co, GSBG62023-90 1000 µg/ml for Cu, GBW (E) 100 µg/ml for Cr, and GBW (E) 080007 100 µg/ml for Ni.
1.0 ml was taken from each stock solution of the elements Cd, Co, Cr, and Ni, and 0.1 ml from the stock solu-tion of Cu, all they were mixed in 100 ml volumetric flask and diluted to the mark with distilled water.
2.2. Methods
2.2.1. GFAAS
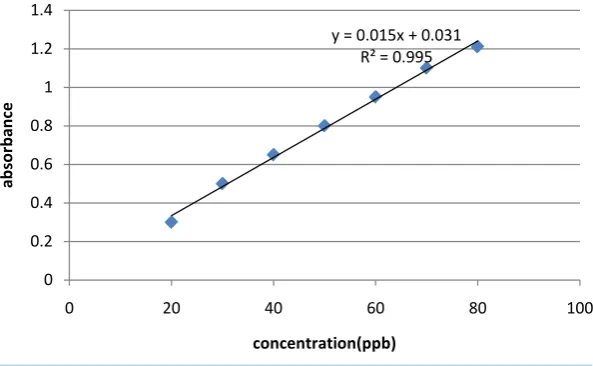
The SRM 8322 after dried (110˚C) for 1 h, 0.999 g was weighed accurately, burned to 650˚C for 1 h and di-gested with the following acids: HNO3 (3 ml), HF (5 ml), HClO4 (5 ml) after each addition the solution evapo-rated to near dryness, finally HCl (10 ml) was added and heated until the appearance of a bubble and transferred to 100 ml volumetric flask and completed to the mark with water. A series of standard solutions 20 - 80 ppb were prepared from the stock standard solution. 20 µl from standard solution and SRM was injected in the GF for the determination of lead. The calibration curve for the standard solution of Pb was shown in Figure 1. In this work a direct injection of a sample solution into the graphite furnace without matrix separation and precon-centration, we got a good result, after using the Deuterium lamp for back ground correction. The lead in the standard reference material SRM 8322 (fly ash from combustion of pulverized coal, Research Centre of Envi-ronmental Science of China) was determined. The average of five determinations was 33.5 µg/g. The certificate value of SRM 8322 is 33.8 ± 4.4 µg/g. The data was analyzed by the soft ware Basica.
2.2.2. HGAAS-FIA
The SRM after dried to 110˚C for 1 h, 1.0 g was weighed accurately and burned to 650˚C for 1 h, then dissolved in an acid mixture as follows: HNO3 (3 ml), HF (5 ml), HCLO4 (5 ml) after each addition of the acid the solu-tion evaporated to near dryness and finally 10 ml of HCl was added and heated until the solusolu-tion was bubbled. The solution transferred to 100 ml volumetric flask and completed to the mark with water and analyzed by FI- HGAAS for determination of As in SRM.
2.2.3. Sampling
The samples studied were from Qingshan Thermoelectric Plant, there are two types of samples according to combustion condition 170 t/h, and 220 t/h.
OALibJ | DOI:10.4236/oalib.1100432 5 June 2014 | Volume 1 | e432 Figure 1. Calibration curve for standard solution of Pb.
Sample 220 t/h was burned in reducing condition, temp. 1323˚C, CO2 17.76%, O2 1.29%, CO 0.12%.
Two different particles of fly ash were sampled for each condition of combustion. The average size of the fly ash was 1.7 µm and 4.8 µm respectively for the two different conditions.
2.2.4. Sample Preparation
The samples were dried at 106˚C for one hour, and then one gram from each sample was weighed. The sample can be partitioned into specific fractions which can be extracted selectively by using appropriate reagents. For total trace metal analysis, the sample was also dried at 106˚C for one hour, and 1.0 g was weighed accurately and then burned at 650˚C for one hour. The sample was digested with the following acids: 3 ml HNO3, 5 ml HF, and 5 ml HCLO4 after addition of the acids the solution was evaporated to near dryness and finally 10 ml of HCl were added until the appearance of bubbles and at last the sample was diluted to 50 ml and then analyzed by ICP-AES.
2.2.5. Sequential Extraction
There are five fractions chosen which are likely to be affected by environmental conditions. 1) Exchangeable
The coal was extracted at room temperature for 1 h with 8 ml of magnesium chloride solution (1 M MgCl2, pH 7.0).
2) Bound to carbonate
The residue from 1) was leached at room temperature for 5 h with 8 ml of 1 M NaOAC adjusted to pH 5.0 with acetic acid. The extraction was maintained with continuous agitation.
3) Bound to Fe-Mn oxide
The residue from 2) was extracted with 20.0 ml of 0.3 M Na2S2O3 + 0.175 M Na-citrate + 0.025 M H-citrate. The experiment was performed at 96˚C ± 3˚C with occasional agitation for 6 h.
4) Bound to organic matter
To the residue from 3) 3 ml of 0.02 M HNO3 and 5 ml of 30% H2O2 adjusted to pH 2.0 with HNO3 were added and the mixture was heated to 85˚C ± 2˚C for 2 h with occasional agitation. A second 3.0 ml aliquot of 30% H2O2 (pH = 2 with HNO3) was then added and the sample was heated again to 85˚C ± 2˚C for 3 h with intermit-tent agitation. After cooling, 5.0 ml of 3.2 M NH4OAC in 20% (v/v) HNO3 was added and the sample was di-luted to 20.0 ml and agitated continuously for 30 min. the addition of NH4OAC is designed to prevent adsorp-tion of extracted metals onto the oxidized coal.
5) Residual
For residual trace metal analysis, the solid was digested with a 10:1 mixture of hydrofluoric and perchloric acids. The residue was first digested with a solution of concentrated HCLO4 (2 ml) and HF (20) to near dryness; subsequently a second addition of HCLO4 (1 ml) and HF (10 ml) was made and again the mixture was evapo-rated to near dryness. Finally, HCLO4 (1 ml) alone was added and the sample was evapoevapo-rated until the
appear-y = 0.015x + 0.031 R² = 0.995
0 0.2 0.4 0.6 0.8 1 1.2 1.4
0 20 40 60 80 100
ab
so
rb
an
ce
OALibJ | DOI:10.4236/oalib.1100432 6 June 2014 | Volume 1 | e432 ance of white fumes. The residue was dissolved in 12 N HCL.
2.2.6. Acid Rain Simulation
3.0 g of 170 t/h sample of fly ash (1.7 µm) was taken. 0.0173 g CaCl2, 0.0111 g MgSO4 and 0.0083 g NH4NO3 were dissolved in 1 L volumetric flask and diluted to the mark. 300 ml was taken from the volumetric flask and divided into 5 flasks, then the pH in each flask adjusted with H2SO4, the pH is as follows: 2, 2.5, 3.5, 4.5, and 5.6.
10 samples were arranged, 5 for one hour and the other 5 for two hours.
30 ml was taken from each flask and added to the first 5 samples (1 h), again 30 ml from each flask was taken and added to the other 5 samples (2 h). The extracted solution was analyzed by ICP-AES for trace elements.
2.2.7. Distribution of Trace Elements in Coal
Approximately 50 g of coal was weighed and transferred to 1000 ml measuring cylinder, completed to the mark with distilled water, and allowed to settle with occasional stirring. After 3 hours, 3 fractions were sampled re-spectively. Again 150 ml was extracted at 6 hours, and 150 ml at 24 hours, and finally the last fraction was taken. Each fraction was filtered and the filterates were dried at 110˚C for one hour. 0.5 g was weighed accurately from each fraction, burned at 650˚C for one hour and finally digested with the acid mixture as follows: HNO3 (3 ml), HF (5 ml), HCLO4 (5 ml) after each addition of the acid the solution evaporated to near dryness, at last HCl (10 ml) was added and the solution heated until it bubbled. The solutions were transferred to 50 ml volumetric flask completed to the mark with water. The samples were analyzed by ICP-AES for trace elements. For the compar-ison of trace elements concentration in coal before and after extraction with dimethyl benzene, 1.0 g was weighed accurately after to 110˚C for one hour, 20 ml of dimethyl benzene were added for 24 hours with occa-sional stirring then the solution was filtered and the filterate burned at 650˚C for 1 hour. Another 1.0 g was weighed accurately after dried at 110˚C for 1 hour and at 650˚C for 1 hour. The two samples were digested with the acid mixtures as the above procedures, transferred to 50 ml volumetric flask, completed to the mark with distilled water and analyzed by ICP-AES.
2.3. Optimization of Experimental Conditions
2.3.1. Optimization of Acid Concentration
To find the best condition for the determination of As(III) without using L-cysteine as a prereductant, different acid concentrations in the range 0.1 - 6 mol/L were tested. It is found 2 mol/L HCl for the carrier was the best condition, higher acid concentrations had little or no effect on arsenic absorbance. When using L-cysteine as a prereductant 1 mol/L HCl for the carrier was the optimum.
2.3.2. Optimization of NaBH4 Concentration
To determine the optimum sodium tetrahydroborate concentration, different concentrations in the range 0.1% - 6% (w/v) were tested. It is found above 4% concentration had very slightly effect. A concentration of 4% (w/v) was chosen for further work. 4.0 g of NaBH4 dissolved in 100 ml of water.
2.3.3. Influence of Pumping Speed
A pump speed in the range 200 - 900 rev/h was tested. The signal increased and became more nearly perfectly shaped with increasing pumping speed. A pumping speed of 800 rev/h (sample 3.1 ml/min, NaBH4 1.3 ml/min and carrier 2.5 ml/min) was chosen for further work.
3. Results
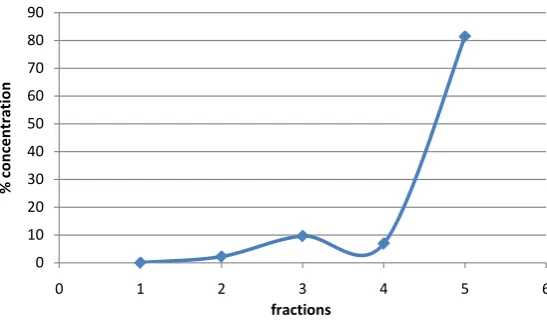
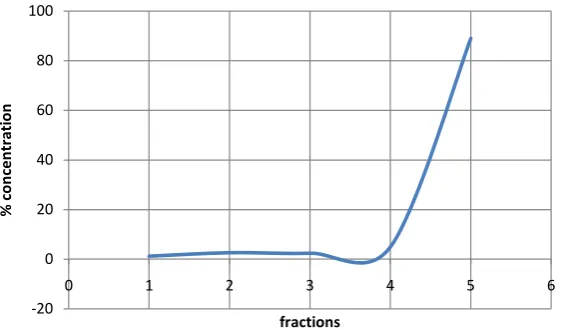
From the agreement of the results of lead and arsenic with the certified value, the methods can be used for the determination of lead and arsenic in coal. The results of speciation of trace elements by Tessier sequential extrac-tion for fly ash under two different condiextrac-tions of combusextrac-tion are shown in Table 2, Table 3, and Figures 2-7.
The results of acid rain simulation are shown in Table 4.
The results of the distribution of trace elements in coal are as in Table 5 and Table 6.
OALibJ | DOI:10.4236/oalib.1100432 7 June 2014 | Volume 1 | e432 Table 2. Analyzing 1.0 g of 170 t/h sample (1.7 µm) using sequential extraction, the concentration in ppm.
Trace elements Concentration of the elements in the fractions Total concentration
1 2 3 4 5
Cd 0.00 0.0032 0.23 0.075 2.8 3.1
Co 0.019 0.32 1.1 1.01 24.9 27.3
Cu 0.00 1.6 7.1 5.1 60.5 74.3
Cr 0.45 1.3 2.9 1.3 69.6 75.5
[image:7.595.88.537.342.433.2]Ni 0.38 2.0 5.0 3.5 49.7 53.6
Table 3. Analyzing 1.0 g of 220 t/h sample (4.8 µm).
Trace elements Concentration of the elements in the fractions Total concentration
1 2 3 4 5
Cd 0.00 0.047 0.27 0.066 3.6 4.007
Co 0.024 0.24 0.83 0.79 21.5 23.4
Cu 0.66 1.43 1.3 2.7 49.0 55.1
Cr 1.6 1.03 2.4 1.8 69.4 76.1
Ni 0.44 2.2 3.1 3.06 39.1 47.8
Table 4. The concentration of trace elements in ppm at different pH.
pH For one hour For two hours
Co Cu Cr Ni Co Cu Cr Ni
5.6 0.00 0.00 0.031 0.016 0.00 0.00 0.048 0.02
4.5 0.00 0.00 0.028 0.014 0.00 0.00 0.063 0.034
3.5 0.00 0.00 0.035 0.00 0.0008 0.00 0.06 0.021
2.5 0.0021 0.032 0.039 0.029 0.0048 0.022 0.045 0.045
2 0.017 0.14 0.101 0.12 0.0.014 0.13 0.1 0.14
Table 5. Content of trace elements in coal extracted by water with different time (µg/g).
Time for separation Extraction for 3 h 6 h 24 h Last fraction
No. of fractions 1 2 3 4 5 6
Elements
As 6.5 ± 0.13 1.4 ± 0.5 2.4 ± 0.72 1.1 ± 0.3 0.54 ± 0.15 0.88 ± 0.35
Be 2.7 ± 0.52 0.88 ± 0.21 1.4 ± 0.53 0.77 ± 0.25 0.00 0.00
Cd 0.28 0.2 0.24 0.2 0.18 ± 0.05 0.16
Pb 21.6 17.7 17.5 10.7 18.3 13.5
Co 11.2 ± 0.15 16.3 ± 0.73 15.0 ± 1.1 13.7 ± 0.49 11.9 ± 2.9 11.6 ± 0.74 Cu 106.1 96.8 67.1 58.0 ± 2.0 42.8 ± 0.05 61.2 ± 1.9 Cr 61.3 ± 0.045 85.3 ± 0.65 47.9 54.0 ± 0.78 71.0 ± 0.16 36.0 ± 0.63
Table 6. Content of trace elements in coal before and after extraction with dimethyl benzene (µg/g).
Elements Original coal After extraction with dimethyl benzene Difference
As 0.17 ± 0.05 0.00 Yes
Be 2.1 ± 0.084 1.6 ± 0.1 Yes
Cd 0.13 0.14 No
Pb 5.6 5.7 No
Co 9.8 ± 0.1 9.8 ± 0.0075 No
Cu 60.4 59.9 No
Cr 22.0 ± 0.33 12.7 Yes
[image:7.595.92.540.458.579.2] [image:7.595.89.538.605.721.2]OALibJ | DOI:10.4236/oalib.1100432 8 June 2014 | Volume 1 | e432 Table 7. Analyzing 1.0 g sample for total trace elements concentration, the concentration in ppm.
Sample Elements
Cd Co Cu Cr Ni
170 t/h (1.7 µm) 4.05 27.7 92.0 53.7 57.3
[image:8.595.177.452.361.521.2]220 t/h (4.8 µm) 4.2 20.9 63.6 48.7 46.8
[image:8.595.176.450.548.708.2]Figure 2. Cd in 1.0 g of 170 t/h sample (1.7 µm) using sequential extraction.
Figure 3. Co in 1.0 g of 170 t/h sample (1.7 µm) using sequential extraction.
Figure 4. Cu in 1.0 g of 170 t/h sample (1.7 µm) using sequential extraction.
-20 0 20 40 60 80 100
0 1 2 3 4 5 6
%
co
nc
en
tr
at
io
n
fractions
-20 0 20 40 60 80 100
0 1 2 3 4 5 6
%
co
nc
en
tr
at
io
n
fraction
0 10 20 30 40 50 60 70 80 90
0 1 2 3 4 5 6
%
c
on
cen
tr
at
io
n
OALibJ | DOI:10.4236/oalib.1100432 9 June 2014 | Volume 1 | e432 Figure 5. Cd in 1.0 g of 220 t/h sample (4.8 µm) using sequential extraction.
Figure 6. Co in 1.0 g of 220 t/h sample (4.8 µm) using sequential extraction.
Figure 7. Cu in 1.0 g of 220 t/h sample (4.8 µm) using sequential extraction.
4. Discussion
From the results of this work it appeared that the total concentration of trace elements in fly ash of 170 t/h (1.7 µm) were higher than of 220 t/h (4.8 µm). According to our previous research work the total concentration of trace elements in 220 t/h dreg samples were higher than the fly ash of the same condition 220 t/h (4.8 µm), but
-20 0 20 40 60 80 100
0 1 2 3 4 5 6
%
c
on
cen
tr
at
io
n
fractions
-20 0 20 40 60 80 100
0 1 2 3 4 5 6
%
co
nc
en
tr
at
io
n
fractions
-20 0 20 40 60 80 100
0 1 2 3 4 5 6
%
co
nc
en
tr
at
io
n
[image:9.595.175.457.475.640.2]OALibJ | DOI:10.4236/oalib.1100432 10 June 2014 | Volume 1 | e432 with the fly ash 170 t/h the increase and decrease is irregular. The results also shows the trace elements in the fine particles were easily to be extracted than in dreg samples. From these observations it is better to use higher temperature for combustion to decrease the air pollution. Only small parts of the total trace elements released into water when act with acid rain, release quantity increase with the decrease of pH of the acid rain, when pH < 2.5 release is significant high. The effect of the concentration of MgCl2 and NaOAc can be observed in acid rain extraction pH 4.5 - 5.6 and the sequential extraction pH 7 and pH 5. The extraction in sequential extraction is higher than in acid rain simulation. This shows that the release of trace elements from particles into water sys-tem not only depend on pH of leaching agent but also on the concentration of the salt in leaching agents. The sum of the five fractions equal the total determination. This shows the results of sequential extractions were re-liable. The results of extraction at 2 h higher than 1 h (sometimes lower) can be explained by sorption-desorp- tion on the surface of particles. The content of exchangeable part is very low because exchangeable species is ion species adsorbed on surface of particles, after combustion (high temp.) the trace elements is not the adsorbed species. The content of carbonate is also low during combustion, carbonate decompose, but some part of the metal oxide may react with CO2 to form carbonate, therefore there is small quantity of carbonate in fly ash. Be-cause of the un-complete combustion of coal, there are small quantity of organic matter in the fly ash, so there are some organic associated trace elements in the fly ash. The results show that the organic associated part are higher than exchangeable and carbonate associated part. The trace elements in this parts may be release into wa-ter system under oxidation condition or biological effect. The content of Fe-Mn oxide associated trace elements in fly ash are similar to those in organic matter. This part is unstable under reduction conduction. Also according to our previous work, the stable residual part of trace elements of Cd, Co, Ni in dreg are higher than those in fly ash, this means that the unstable and substable species (exchangeable, carbonate, Fe-Mn oxide, and organic) in fly ash are higher than in dreg, that the fly ash is more important for heavy metals pollution of the environment. Generally with the increase of settlement time, the gravity increase. The smaller of gravity the more of organic substance. From Table 2 we can see the concentration of As and Be are decreased with the increase of gravity. It showed that these two elements associated mainly with organic substance. The results of the extraction by di-methyl benzene in Table 3 showed that after extraction with didi-methyl benzene the concentration of As, Be and Cr showed a significant difference with the original coal. While other elements showed no difference. It means trace elements As, Be and Cr are generally associated with organic substance, while other elements associated with inorganic matter in coal.
5. Conclusion
Fly ash is one factor of air pollution. In this work lead had been determined by GFAAS, the method is simple and can be used for the determination of lead in coal fly ash. The arsenic determined by HGAAS-FIA method can be used for further determination of arsenic in coal fly ash. Different species of trace elements generally have different toxicity and bioavailability, so speciation of trace elements is interested in the field of environ-mental and life science. In particles of coal fly ash, some of the trace elements are mainly associated with or-ganic matter, and some are mainly associated with minerals matter. The trace elements may exist in different forms in fly ash. As the temperature of combustion increase the content of trace elements in fly ash decrease. The release quantity of trace elements increased with the decrease of pH. The residual is the most stable part. The speciation of trace elements in different size of coal fly ash is closely related to the circumstance of coal combustion, so the control of the condition of combustion e.g. temperature can decrease the air pollution of trace heavy metals.
References
[1] Raeva, A.A., Klykov, O.V., Kozliak, E.I., Pieerce, D.T. and Seames, W.S. (2011) In Situ Evaluation of Inorganic Ma-trix Effects on the Partitioning of Three Trace Elements (As, Sb, Se) at the Outset of Coal Combustion. Energy and Fuels, 25, 4290-4298. http://dx.doi.org/10.1021/ef200879j
[2] Willett, J.C., Finkelman, R.B., Mrocz Kowski, S.J., Palmer, C.A. and Koller, A. (2000) Semi-Quantitative Determina-tion of the Modes of Occurrence of Elements in Coal: Results from an InternaDetermina-tional Round Robin Project. Final Report, U.S. Geological Survey, Reston, 45 p.
[3] Davison, R.L., Natusch, D.F.S., Wallace, J.R. and Evans, C.A. (1974) Trace Elements in Fly Ash. Dependence of Con- centration on Particle Size. Environmental Science and Technology, 8, 1107-1113.
OALibJ | DOI:10.4236/oalib.1100432 11 June 2014 | Volume 1 | e432
[4] Dale, L.S. and Chapman, J.F. (1999) IEA Collaborative Project on the Modes of Occurrence of Trace Elements in Coal (Phase 1). Final Report, Lucas Heights, NSW, Australia, Commonwealth Scientific and Industrial Research Organiza-tion, Division of Energy Technology, 18 p.
[5] Nelson, P.F. (2007) Trace Metal Emission in Fine Particles from Coal Combustion. Energy and Fuels, 21, 477-484.
http://dx.doi.org/10.1021/ef060405q
[6] Chen, H.H., Laskin, A., Baltrusaitis, J., Groski, C.A., Scherer, M.M. and Grassian, V.H. (2012) Coal Fly Ash as a Source of Iron in Atmospheric Dust. Environmental Science and Technology, 46, 2112-2120.
http://dx.doi.org/10.1021/es204102f
[7] Slavin, W., Manning, D.C. and Camrick, G.R. (1981) Atomic Spectroscopy, 2, 137.
[8] Weiz, B., et al. (1992) Time-Based and Volume-Based Sampling for Flow-Injection On-Line Sorbent Extraction Gra-phite Furnace Atomic Absorption Spectrometry. Analytica Chimica Acta, 261, 477-487.
http://dx.doi.org/10.1016/0003-2670(92)80229-Z
[9] Fang, Z. and Weiz, B.J. (1989) High Efficiency Low Sample Consumption On-Line Ion-Exchange Pre-Concentration System for Flow Injection Flame Atomic Absorption Spectrometry. Journal of Analytical Atomic Spectrometry, 4, 543- 546. http://dx.doi.org/10.1039/ja9890400543
[10] Ruzicka, J. and Arndal, A. (1989) Sorbent Extraction in Flow Injection Analysis and Its Application to Enhancement of Atomic Spectrometry. Analytica Chimica Acta, 216, 243-255. http://dx.doi.org/10.1016/S0003-2670(00)82011-5
[11] Fang, Z., Guo, T. and Weiz, B. (1991) Determination of Cadmium, Lead and Copper in Water Samples by Flame Atomic-Absorption Spectrometry with Preconcentration by Flow-Injection On-Line Sorbent Extraction. Talanta, 38, 613-619. http://dx.doi.org/10.1016/0039-9140(91)80144-O
[12] Malamas, F., Bengtsson, M. and Johansson, G. (1984) On-Line Trace Metal Enrichment and Matrix Isolation in Atomic Absorption Spectrometry by a Column Containing Immobilized 8-Quinolinol in a Flow-Injection System.
Analytica Chimica Acta, 160, 1-10. http://dx.doi.org/10.1016/S0003-2670(00)84503-1
[13] Nakashima, S., Sturgeon, R.E., Willie, S.N. and Berman, S.S. (1988) Determination of Trace Metals in Seawater by Graphite Furnace Atomic Absorption Spectrometry with Preconcentration on Silica-Immobilized 8-Hydroxyquinoline in a Flow-System. Fresenius’ Zeitschrift für Analytische Chemie, 330, 592-595. http://dx.doi.org/10.1007/BF00473773
[14] Fang, Z., Sperling, M. and Welz, B. (1990) Flow Injection On-Line Sorbent Extraction Pre-Concentration for Graphite Furnace Atomic Absorption Spectrometry. Journal of Analytical Atomic Spectrometry, 5, 639-646.
http://dx.doi.org/10.1039/ja9900500639
[15] Schlemmer, G. and Grobenski, Z. (1990) Determination of Arsenic, Cadmium, Lead and Selenium in Highly Minera-lized Waters by Graphite-Furnace Atomic-Absorption Spectrometry. Talanta, 37, 545-553.
http://dx.doi.org/10.1016/0039-9140(90)80195-L
[16] Sanady, M.C. (1978) Hidrol, Kozl., 58, 193.
[17] Raje, N., Kayasth, S., Asari, T.P.S. and Gangadharan, S. (1994)Proconcentration of Trace Elements from High-Purity Thorium and Uranium on Chelex-100 and Determination by Graphite Furnace Atomic Absorption Spectrometry with Zeeman-Effect Background Correction. Analytica Chimica Acta, 290, 371-377.
http://dx.doi.org/10.1016/0003-2670(94)80125-8
[18] Gupta, J.G.S. and Bouvier, J.L. (1995)Direct Determination of Traces of Ag, Cd, Pb, Bi, Cr, Mn, Co, Ni, Li, Be, Cu and Sb in Environmental Waters and Geological Materials by Simultaneous Multi-Element Graphite Furnace Atomic Absorption Spectrometry with Zeeman-Effect Background Correction. Talanta, 42, 269-281.
http://dx.doi.org/10.1016/0039-9140(94)00256-R
[19] Minezewski, J., Ska, J.C. and Dybezynski, R. (1982) Separation and Preconcentration Methods in Inorganic Trace Analysis. Ellis Horwood, Chichester, 37.
[20] Mizuike, A. (1983) Enrichment Techniques for Inorganic Trace Analysis. Springer, Berlin, 56. [21] Zolotov, Y.A. and Kuzmin, N.M. (1990) Preconcentration of Trace Elements. Elsevier, Amsterdam, 79.
[22] Hiraide, M., Chen, Z., Sugimoto, K. and Kawaaguchi, H. (1995)Coprecipitation with Tin(IV) Hydroxide Followed by Removal of Tin Carrier for the Determination of Trace Heavy Metals by Graphite-Furnace Atomic Absorption Spec-trometry. Analytica Chimica Acta, 302, 103-107. http://dx.doi.org/10.1016/0003-2670(94)00427-N
[23] Hendrikse, P.W., Slikkerveer, F.J., Zaalberg, J. and Hautfenne, A. (1988)Determination of Copper, Iron and Nickel in Oils and Fats by Direct Graphite Furnace Atomic Absorption Spectrometry: Results of a Collaborative Study and the Standardised Method. Pure and Applied Chemistry, 60, 893-900. http://dx.doi.org/10.1351/pac198860060893 [24] van Dalen, G. and Galan, L.D. (1994)Direct Determination of Particulate Elements in Edible Oils and Fats Using an
Ultrasonic Slurry Sampler with Graphite Furnace Atomic Absorption Spectrometry. Spectrochimica Acta Part B: Ato- mic Spectroscopy, 49, 1689-1693. http://dx.doi.org/10.1016/0584-8547(94)80140-1
OALibJ | DOI:10.4236/oalib.1100432 12 June 2014 | Volume 1 | e432
nic” and “Dimethylarsenic” Species by Selective Hydride Evolution Atomic-Absorption Spectroscopy. Analyst (Lon- don), 106, 213-220. http://dx.doi.org/10.1039/an9810600213
[26] Ebdon, L., Wilkinson, J.R. and Jackson, K.W. (1982)A Simple and Sensitive Continuous Hydride Generation System for the Determination of Arsenic and Selenium by Atomic Absorption and Atomic Fluorescence Spectrometry. Analy-tica Chimica Acta, 136, 191-199. http://dx.doi.org/10.1016/S0003-2670(01)95378-4
[27] Subramanian, K.S. and Méranger, J.C. (1982)Rapid Hydride Evolution-Electrothermal Atomisation Atomic-Absorp- tion Spectrophotometric Method for Determining Arsenic and Selenium in Human Kidney and Liver. Analyst (London),
107, 157-162. http://dx.doi.org/10.1039/an9820700157
[28] Ruzicka, J. and Hansen, E.H. (1981) Flow Injection Analysis. Wiley, New York.
[29] Tyson, J.F., Appiten, J.M.H. and Idris, A.B. (1983)Flow Injection Sample Introduction Methods for Atomic-Absorp- tion Spectrometry. Analyst (London), 108, 153-158. http://dx.doi.org/10.1039/an9830800153
[30] Nakazawa, H., Takabatake, E., Hino, S. and Mtema, C.A. (1983)Simultaneous Determination of Sulfamonomethoxine, Dinitolmide, Ethopabate, Sulfadimethoxine, and Sulfaquinoxaline in Chicken Tissues by High Performance Liquid Chromatography. Bunseki Kagaku, 32, 179-183. http://dx.doi.org/10.2116/bunsekikagaku.32.3_179
[31] Zhou, N., Frech, W. and Lundberg, E. (1983)Rapid Determination of Lead, Bismuth, Antimony and Silver in Steels by Flame Atomic Absorption Spectrometry Combined with Flow Injection Analysis. Analytica Chimica Acta, 153, 23-31.
http://dx.doi.org/10.1016/S0003-2670(00)85484-7
[32] Olson, S., Pessenda, L.C., Růžička, J. and Hansen, E.H. (1983)Combination of Flow Injection Analysis with Flame Atomic-Absorption Spectrophotometry: Determination of Trace Amounts of Heavy Metals in Polluted Seawater. Ana-lyst (London), 108, 905-917. http://dx.doi.org/10.1039/an9830800905
[33] Kamson, O.F. and Townshend, A. (1983)Ion-Exchange Removal of Some Interferences on the Determination of Cal-cium by Flow Injection Analysis and Atomic Absorption Spectrometry. Analytica Chimica Acta, 155, 253-257.
http://dx.doi.org/10.1016/S0003-2670(00)85601-9
[34] Nord, L. and Karlberg, B. (1983)Sample Preconcentration by Continuous Flow Extraction with a Flow Injection Ato- mic Absorption Detection System. Analytica Chimica Acta, 145, 151-158.
http://dx.doi.org/10.1016/0003-2670(83)80057-9
[35] Skeggs, L.T. (1957) An Automatic Method for Colorimetric Analyses. American Journal of Clinical Pathology, 28, 311.
[36] Manabu, Y., Yasuda, M. and Yuroku, Y. (1985) Analytical Chemistry, 57, 1382-1385.
[37] Hisatake, N. and Masahiko, I. (1984)Automated Determination of Arsenic and Selenium by Atomic Absorption Spec-trometry with Hydride Generation. Analytical Chemistry, 56, 2059-2063. http://dx.doi.org/10.1021/ac00276a018 [38] Bernhard, W. and Šucmanová, M. (1993)L-Cysteine as a Reducing and Releasing Agent for the Determination of
An-timony and Arsenic Using Flow Injection Hydride Generation Atomic Absorption Spectrometry—Part 2. Interference Studies and the Analysis of Copper and Steel. Analyst, 118, 1425-1432. http://dx.doi.org/10.1039/an9931801425
[39] Kheboian, C. and Bauer, C.F. (1987)Accuracy of Selective Extraction Procedures for Metal Speciation in Model Aq-uatic Sediments. Analytical Chemistry, 59, 1417-1423. http://dx.doi.org/10.1021/ac00137a010
[40] Tessier, A., Campbell, P.G.C. and Bisson, M. (1979)Sequential Extraction Procedure for the Speciation of Particulate Trace Metals. Analytical Chemistry, 51, 844-851. http://dx.doi.org/10.1021/ac50043a017
[41] Jouanneau, J.M., Latouche, C. and Pautrizel, F. (1983)Analyse critique des extractions sequentielles a travers l’etude de quelques constituants des residus d’attaque critical analysis of sequential extractions through the study of several attack constituent residues. Environmental Technology Letters, 4, 509-514.
http://dx.doi.org/10.1080/09593338309384240
[42] Maher, W.A. (1984)Evaluation of a Sequential Extraction Scheme to Study Associations of Trace Elements in Estua-rine and Oceanic Sediments. Bulletin of Environmental Contamination and Toxicology, 32, 339-344.
http://dx.doi.org/10.1007/BF01607507
[43] Rendell, P.S., Batley, G.E. and Cameron, A.J. (1980)Adsorption as a Control of Metal Concentrations in Sediment Ex- tracts. Environmental Science Technology, 14, 314-318. http://dx.doi.org/10.1021/es60163a002
[44] Rapin, F. and Forstner, U. (1983) Processing of the 4th International Conference on Heavy Metals in the Environment. CEP Consultant LTD., Heidelberg, Edinburgh, 1074-1077.
[45] Tipping, E., Hetherington, N.B., Hilton, J., Thompson, D.W., Bowles, E. and Hamilton-Taylor, J. (1985)Artifacts in the Use of Selective Chemical Extraction to Determine Distributions of Metals between Oxides of Manganese and Iron.