Design of a Piezoresistive Micropressure Sensor using
Finite Element Analysis
K.Y.Madhavi
Department of Physics Maharani’s Science CollegeBangalore India
M.Krishna
CMRTU,R.V. College of Engineering Bangalore India
C.S.Chandrasekhara
Murthy
CMRTU,
R.V. College of Engineering Bangalore India
ABSTRACT
This paper is about designing a silicon based piezoresistive micro pressure sensor for greater sensitivity. Using Finite Element Analysis (FEA) the role played by important design parameters like the side length and the thickness of the pressure sensing membrane in determining the sensitivity of the sensor are studied in detail for a pressure of 100 kPa. The fracture stress of silicon is adopted as the main criterion for selecting the dimensions of the diaphragm in order to obtain maximum sensitivity and to ensure safe sensor operation. From the FEA results the side length and the thickness of the sensor are determined as 1000 µm and 17.2 µm respectively. The stress profile of the diaphragm is studied in order to determine the optimum length and positioning of piezoresistors. The piezoresistors are placed in six different patterns and the sensitivity of the sensor for each pattern is determined. The maximum sensitivity is found to be 41.6 mV/V/Bar. The effect of variation in the length of the piezoresistor on the sensitivity of the sensor has been studied and the optimum length of the piezoresistor is determined as 100 µm.
Keywords
MEMS Pressure Sensors, Piezoresistivity, Finite element analysis, Diaphragm design, Burst pressure.
1.
INTRODUCTION
Microelectromechanical systems (MEMS) based technology offers the prospective of fabricating miniaturized and compact devices coupled with sophisticated functionality, which are now being used in industrial, aeronautical biomedical and defense sectors. The significant features of MEMS over conventional macroscopic devices are [1]:
Reduced size leading to reduced cost
The excellent mechanical properties of silicon comparable to steel
Benefits from the sophisticated designing, processing and packing technology developed for the IC industry
Easy Integration with IC circuitry to produce systems on a chip
Micro pressure sensors were the first MEMS based devices to be fabricated. So far about 18% of the MEMS based devices sold in the world are pressure sensors [2] MEMS pressure sensors work on the principle of the mechanical deformation of a thin diaphragm due to the pressure exerted by the contact medium. The mechanical stress induced due to the applied pressure is converted into an electrical signal using piezoresistive, capacitive, optical and resonant sensing mechanisms. Among the various transduction mechanisms available for the sensor, piezoresistive type is the most widely used due to various advantages such as good linear input
/output relationship, small size, easy integration with electronics and a well matured fabrication process. Conventional piezoresistive pressure sensors have silicon diaphragms and doped silicon or polysilicon piezoresistors. The reasons for silicon being the preferred material for MEMS devices are [3]:
Ability to be micromachined and batch processed
High Young modulus, harder than steel and as light as aluminum
Melting point at about 1400ºC and can be processed at high temperatures
Low coefficient of thermal expansion
No mechanical hysteresis, due to yield strength of 7GPa and free from creep
Ever since the discovery of piezoresistance in silicon by C.S.Smith in1954 [4] silicon based micro pressure sensors have been extensively studied over the past three decades. Pfann and Thurston [5] were among the first to realize a working MEMS based pressure sensor designed using two longitudinal and two transverse diffused piezoresistors in the Wheatstone’s bridge for better sensitivity. Kanda [6] in his work has presented a model which enables the calculation of piezoresistive coefficients as a function of doping concentration and temperature. Enhancing the sensitivity has also been a main issue in the research of micro pressure sensors. Design modifications like employing a bossed diaphragm and multiple diaphragms [7, 8] and material modification by using phosphorous diffused polysilicon piezoresistors [9] polymer diaphragms and alternate piezoresistive materials [10-13] have also been studied. This paper deals with a design methodology aimed at improving the sensitivity of the sensor based on fracture stress and linearity conditions.
The layout of this work is divided into the following sections: Section 2 discusses the pressure- deflection expression
used to design the diaphragm and piezoresistivity in silicon.
Section 3 describes the Finite Element Analysis (FEA) and the methodology used to determine the dimensions of the sensing diaphragm for a given pressure for maximum sensitivity and linearity.
Section 4 studies the stress profile of the diaphragm and the effect of piezoresistor placement on the output of the sensor.
2.
DIAPHRAGM DESIGN
2.1
Load-Deflection Theory
From the theory of small deflection of plates the pressure- deflection relation of a square membrane clamped on all the four sides is given by the following equation [15].
3 0 0 2 4 4 h y υ 1 0.585υ 1 1.98 h y υ 1 4.13 a h E
P
(1)
Where E is the Young’s Modulus, ν the Poisson’s ratio, h the thickness of the diaphragm of side length 2a and y0 the maximum deflection at the center, for an applied pressure P. The first term of (1) falls into the category of small scale deflections where the deflection y0 is very small compared to the thickness of the diaphragm leaving the central plane of the diaphragm unaffected by the induced stress and hence leads to a linear relationship. The 2nd term of the equation represents the bending stress in the central plane and it becomes more prominent in thinner diaphragms hence it has to be made as small as possible to avoid nonlinear effects. Thus reducing the thickness of the membrane enhances the sensitivity but at the same time the deflection of the membrane increases and enters into the nonlinear region. Consequently an appropriate value of h must be chosen so that maximum sensitivity is obtained without compromising the linearity of the sensor. Usually the value of h is chosen in such a manner that the ratio yo/h ≤ 0.1.
The stress induced in a square diaphragm when a uniform pressure is applied plays a vital role in deciding the dimensions of the diaphragm. This induced stress has a maximum value (σmax) at the center of the diaphragm edges and is given by
2 2 max
1
.
2
h
a
P
(2)Where, 2a is the side length, h the thickness of the diaphragm and P the applied pressure. When the maximum stress induced (σmax) in the diaphragm is equal to the fracture stress of silicon (σc) the corresponding applied pressure is the burst pressure. Thus the dimensions of the sensing diaphragm must be chosen such that the induced stress σmax created does not exceed the facture stress at any time of operation. The fracture stress for single crystal silicon is 7 GPa. Apart from the pressure – deflection characteristics the piezoresistive property of silicon also plays a vital role in determining the performance of the sensor and is explained in the following section.
2.2
Piezoresistivity in silicon
Piezoresistivity is a widely used principle in designing micro pressure sensors due to their low cost, small size, low phase lag, and large dynamic range [16]. It is based on the fact that there is a change in the resistivity of a material under the influence of an external strain. This is due to the change inthe internalatomic positions when a stress is applied which leads to a shift in the band gap of the material and hence induces a change in resistivity. This change in resistance ΔR can be measured using the equation (3)
l l t t
R
R
(3)
Where, πl and πt are the longitudinal and transverse piezoresistive coefficients, and σl =
2 2
h a
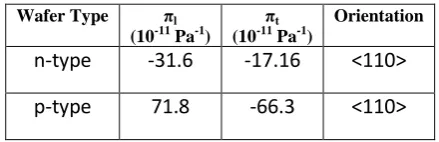
[image:2.595.329.549.203.274.2]P and σt = υσl are the longitudinal and transverse stresses induced in the membrane, υ is the Poisson’s ratio and R is the resistance of the piezoresistor for zero strain. Table 1 shows the piezoresistive coefficients for (100) silicon wafers.
Table 1: Longitudinal and transverse piezoresistive coefficients of silicon <100> wafers for a doping level of
1018 cm-3
From the table it can be seen that the p-type piezoresistors aligned along <110> direction give the maximum sensitivity. Generally four such resistors are arranged in the form of a Wheatstone’s network to obtain an electrical readout as shown in the Fig. 1 below.
The bridge is balanced under zero pressure condition. When a pressure is applied on the diaphragm all the four resistors undergo a change in resistance and the output of the bridge V0 is given by
1 2 3 4
0 in o
ΔR
ΔR
ΔR
ΔR
4R
1
V
V
(4)
The sensitivity of the sensor is calculated using (5) and is expressed as mV/V/bar
P
1
x
V
V
S
in o
(5)
Where, V0 is the output of the sensor for a pressure change of ΔP.
3.
FINITE ELEMENT ANALYSIS
Various researchers have employed the burst pressure approach to obtain the optimum dimensions of a pressure sensing diaphragm by considering the thickness and side
Wafer Type πl (10-11 Pa-1)
πt (10-11 Pa-1)
Orientation
n-type
-31.6
-17.16
<110>
p-type
71.8
-66.3
<110>
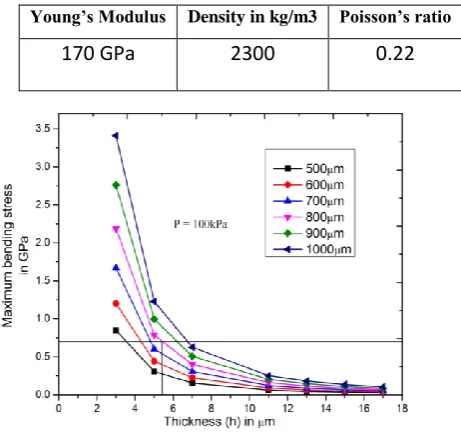
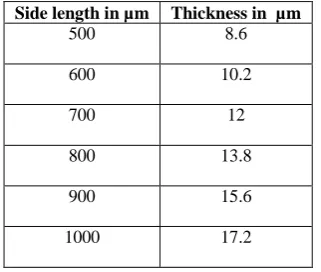
[image:2.595.326.511.351.497.2]length of the diaphragm for better sensitivity and safety factors [13, 14]. In the present work the maximum deflection produced at the centre of the diaphragm along with its thickness and side length has been considered in order to maintain the linearity of the sensor along with improved sensitivity. Using the Shell 63 module of the Finite Element Tool ANSYS pressure sensing diaphragms have been constructed. The material properties of silicon used for simulation are given in Table 2. The maximum stress induced and the deflection of the diaphragm have been studied as a function of side length and thickness for a pressure Pmax of 100 kPa, and the results are represented in Figs 2 and 4. The ANSYS images for maximum stress along X and Y axes are shown in Figs. 3 and 5. From the analysis done the side length and the thickness of the diaphragm have been estimated by considering a burst pressure of 10 Pmax for safe sensor operation. The maximum stress induced in the diaphragm at Pmax should be below 0.7 GPa represented by the dark line in Fig. 2. For e.g this stress limit of 0.7 GPa is obtained for 2a = 800 µm and h = 5.4 µm as observed in Fig. 2 but the maximum deflection for this condition is 24 µm as seen from Fig. 4 which pushes the sensor into the non linear region as yo/h = 4.44 which is greater than 0.1. Therefore a thickness of 13.8 µm for which yo/h = 0.095 is chosen. In a similar manner the dimensions of the diaphragms selected for maximum sensitivity as well as linearity for different side lengths are represented in Table 3.
Table 2: Properties of silicon used in simulation
Young’s Modulus Density in kg/m3 Poisson’s ratio
170 GPa
2300
0.22
Figure 3: ANSYS images showing maximum stress along X axis for 2a=500µm ,h = 17µm and P= 100kPa
[image:3.595.319.522.268.434.2]Figure 5: ANSYS images showing maximum stress along Y axis for 2a=500µm, h = 17µm and P= 100kPa Figure 4: Maximum deflection of the membrane for
varying thickness and side length
Figure 2: Maximum bending stress of the membrane as a function of membrane thickness
[image:3.595.39.270.385.602.2] [image:3.595.343.507.478.605.2]Table 3: Dimensions of the diaphragm for maximum sensitivity and linearity for a Pmax of 100 kPa
The results obtained from FEA are compared with the values obtained from analytical expressions (1) and (2) and they are found to agree with each other for a pressure range of 0-100 kPa and are shown in Figs. 6 and 7.
4.
STUDY OF THE STRESS PROFILE
The stress profile of the diaphragm for an operating pressure of 100 kPa has been studied for the effective placement of the piezoresistors. Using ANSYS simulations the stress distribution along X–X' and Y-Y' passing through the centre
of the diaphragm are determined and depicted in Figs. 8 and 9. From the Figs. 8 and 9 it is evident that for a square diaphragm the stress profile along X–X' and Y-Y' axes are similar and also that there is a concentration of stress at the edges and at the center. Maximum tensile strength is experienced at the edges and is positive and maximum compressive stress is experienced at the centre and is negative hence the resistors are placed in these areas.
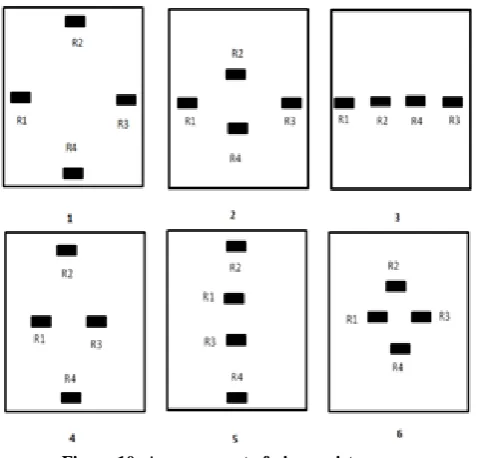
Using the FEA tool Intellisuite pressure sensing diaphragms with six different patterns of piezoresistors depicted in Fig. 10 have been constructed for a 1000 µm x 1000 µm diaphragm of thickness 17.2 µm. The masks are designed in the Intellimask module and then auto meshed into the 3-D builder and after assigning the selected dimensions they are finally exported to the Thermo-Electro-Mechanical (TEM) module for piezoresistive analysis and the output of the sensor is determined. The piezoresistive coefficients used in simulation are π11 = 6.6x10⁻¹¹ Pa-1, π12 = 1.1x10⁻¹¹ Pa-1, π44 = 138.1x10⁻¹¹ Pa-1[4]. Such that
πl =
2
+
+
12 4411
and πt =
2
+
12- 4411
The dimensions of the piezoresistors used in the simulations are length = 50 µm, width = 20 µm, thickness = 1 µm, and edge offset = 10 µm. The output voltage Vo and the voltage Side length in µm Thickness in µm
500 8.6
600 10.2
700 12
800 13.8
900 15.6
1000 17.2
[image:4.595.328.531.169.321.2]Figure 8: Longitudinal stress σxx profile along X-X′
[image:4.595.42.264.296.689.2]Figure 9: Longitudinal stress σyy profile along Y-Y′ Figure 6: Comparison of FEA and analytical values
for maximum deflection at the centre
[image:4.595.41.261.310.472.2] [image:4.595.325.531.364.535.2]sensitivity (S) obtained for the different patterns are shown in Table 4.
[image:5.595.78.218.417.580.2]In this study initially R1=R2=R3=R4 =1 kΩ, and Vin = 5V.
Table 4: Sensitivity of the sensor for different piezoresistor placements
It can be seen from table 4 that maximum sensitivity is obtained for pattern 1 since the resistors are placed close to the centre of the edges where the induced stress is maximum thereby inducing a greater change in resistivity. The resistors R1 and R3 placed perpendicular to the edge of the diaphragm experience an increase in resistance due to the longitudinal and transverse tensile stresses whereas R2 and R4 placed parallel to the edge of the diaphragm experience an equal decrease in resistance owing to similar compressive stresses as seen in Figs. 8 and 9 thus giving rise to a maximum output from (4). In pattern 2 and 3 the positions of R2 and R4 are changed to areas having a lower stress thereby accounting for the decrease in output and since the stress concentration is fairly uniform at the center there is not much difference in their sensitivities. For patterns 4 and 5, R1 and R3 are moved towards the centre where the stress is lower than that at the edges and hence leads to a decrease in the output, and in
pattern 6 the position of all the four resistors are moved towards the centre thus experiencing lesser stress and therefore the output is the least for this configuration. From Table 4 we can notice that a change in position of R1 and R3 (in pattern 5) produces a greater decrease in output than that of change in R2 and R4 (pattern 3). Hence it is observed that the position of resistors R1 and R3 plays a crucial role in determining the sensitivity of the sensor compared to R2 and R4.
The sensitivity of the sensors with the resistors placed in pattern 1 has been determined for the selected dimensions in Table 2 and represented in Table 5.
Table 5: Sensitivity of the sensor for the selected dimensions
From the results in Table 5 it is observed that as the side length of the diaphragm increases the sensitivity of the sensor also increases and a maximum sensitivity of 41.6 mV/V/bar is obtained for a side length of 1000 µm. The relation between applied pressure and output voltage Vo for the sensor must be linear in order to obtain better accuracy. From the plot of pressure vs Vo shown in Fig. 11 it is observed that this linearity is maintained for the range of 0-100 kPa.
5.
EFFECT OF LENGTH VARIATION
The length of the piezoresistor also plays a major role in determining the sensitivity of the sensor. The change in the resistance of the piezoresistors and hence the sensitivity of the sensor for varying lengths of the piezoresistor arranged in pattern 1 has been determined for a pressure of 100 kPa and
Pattern V0 (mV) Sensitivity (mV/V/bar)
1 208.15 41.63
2 119.75 23.99
3 119.69 23.95
4 125.18 25.03
5 89.25 17.85
6 36.79 7.36
Side length (µm)
Thickness ( µm)
Sensitivity (mV/V/bar)
500 8.6 29.4
600 10.2 37.4
700 12 37.7
800 14 37.9
900 15.8 38.3
1000 17.2 41.6
Figure 10: Arrangement of piezoresistors
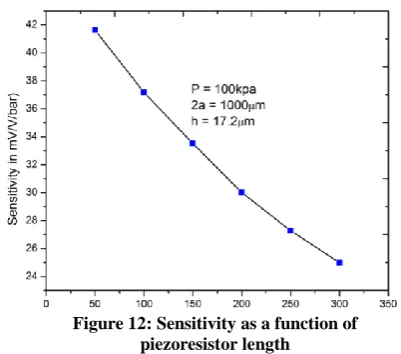
[image:5.595.321.525.506.668.2]the results are shown in Fig. 12 and 13. From the plot in Fig. 12 it is observed that the sensitivity decreases as the length of the piezoresistor increases and this is attributed to the fact that the maximum tensile stress is experienced at the center of the edges and decreases as we move towards the center. Thus the resistor of length 50 µm is the most sensitive. Also this tensile stress sensed by R1 and R2 becomes compressive from a distance of 180 µm from the edge as seen from Fig. 8. Thus the length of the piezoresistor must be lesser than 180 µm to effectively sense tensile stress.
Fig. 13 represents the variation in the resistance of the piezoresistors as a function of their length. is From Fig. 13 it can be seen that the change in the resistance of resistors R1 and R3 with respect to resistance at zero pressure R0 denoted by dRI/R0 is greater than that of the change in resistors R2 and R4 with respect to R0 denoted by dRII/R0. This also confirms the fact that resistors R1 and R3 play an important role in determining the sensitivity and concurs with the results of the studies done by [17]. Though a resistor length of 50 µm gives the maximum sensitivity a length of 100 µm is preferred for ease of fabrication.
6. CONCLUSION
Using Finite Element Analysis (FEA) the role played by important design parameters like the side length and the thickness of the pressure sensing membrane in determining the sensitivity of the sensor are studied for a maximum
pressure of 100 kPa. Using the burst pressure approach the dimensions of the diaphragm have been determined by considering safety and linearity factors. From the studies done a dimension of 1000 µm x 1000 µm and a thickness of 17.2 µm has been selected but a smaller side length can be chosen for greater sensor density while making a trade off with sensitivity. The importance of placing the piezoresistors in strategic locations for greater sensitivity has been emphasized. From the stress profile of the diaphragm the maximum limit for the length of the piezoresistor is determined as 180µm and the optimum length of the piezoresistor has been obtained by studying the change in the sensitivity of the sensor as a function of piezoresistor length.
7.
ACKNOWLEDGMENTS
One of the authors K.Y.Madhavi gratefully acknowledges, UGC for having provided the benefit of Faculty Improvement Program under the XI plan.
8.
REFERENCES
[1] Janusz Bryzek, Shad Roundy,Brian Bircumshaw, Charles Chung,Kenneth Castellino, Joseph R. Stetter,and Michael Vest “Marvelous MEMS”IEEE circuits & devices magazine March/April (2006).
[2] Michal Olszacki, “Modelling and optimization of piezoresistive pressure sensors” Ph.D Thesis, Université de Toulouse, (2009)
[3] K. Petersen, “Silicon as a mechanical material,” Proceedings of the IEEE, vol. 70, no. 5, pp. 420-457, (1982).
[4] C.S. Smith, “Piezoresistive effect in germanium and silicon,” Phys.Rev., vol. 94, no. 1, pp. 42–49, (1954). [5] Pfann, W.G. and Thurston, R.N, “Semiconducting stress
transducers utilizing the transverse and shear piezoresistance effects”, Journal of Applied Physics, Vol. 32, No. 10, (1961).
[6] Y. Kanda, “A graphical representation of the piezoresistance coefficients in Silicon,” IEEE Transaction on Electron Devices, vol. 29, No. 1, pp. 64– 70, (1982).
[7] J.R. Mallon, F. Pourahmadi, K. Petersen, Barth T. Vermeulen and Brezek J., “Low Pressure Sensors employing bossed diaphragms and precision etch stopping” Sensors and Actuators’ Vol. A21–A23, 89–95, (1990).
[8] Roy Chaudhuri, V. Natarajan, P. Chatterjee, S. Gangopadhyay, . Sreeramamurthy and H. Saha, “Design of a High Performance MEMS Pressure Sensor Array with Signal Conditioning Unit for Oceanographic Applications” Sensors & Transducers Journal, Vol. 98, Issue 11, pp. 83-95, (2008).
[9] K. Sivakumar, N. Dasgupta, K.N. Bhat, “Sensitivity enhancement of polysilicon piezo-resistive pressure sensors with phosphorous diffused resistors”, Journal of Physics, Conference Series 34, 216–221, (2006). [10]Carmen K. M. Fung, Maggie Q. H. Zhang, Zaili Dong
[image:6.595.62.263.192.369.2]and Wen J. Li “Fabrication of CNT-Based MEMS Piezoresistive Pressure Sensors Using DEP Nano assembly” Proceedings of 5th IEEE Conference on Nanotechnology Nagoya, Japan (2005).
Figure 12: Sensitivity as a function of piezoresistor length
[image:6.595.65.272.497.667.2][11]Dong-Weon Lee, and Young-Soo Choi “A Novel Pressure Sensor with a PDMS Diaphragm” Microelectronic Engineering 85, 1054–1058 (2008). [12]S. Park, B. S. Kang, D. W. Lee, and Y. S. Choi “Single
Carbon Fiber as a Sensing Element in Pressure Sensors” Appl. Phys. Lett. 89, 223516 (2006).
[13]M. Narayanaswamy, R. Joseph Daniel, K. Sumangala, C. Antony Jeyasehar “Computer aided modeling and diaphragm design approach for high sensitivity Silicon-on-Insulator pressure sensors” Measurement 44, 1924– 1936, (2011).
[14]Shih-Chin Gong, “Effects of pressure sensor dimensions on process window of membrane thickness”, Sensors and Actuators, A 112, 286–290, (2004).
[15]V.V. Meleshenko, “Bending of an elastic rectangular clamped plate: exact versus engineering solutions”, J. Elasticity, Vol. 48, 1–50, (1997).
[16]Robert M. Panas, Michael A. Cullinan, and Martin L.Culpepper “A systems approach to modeling piezoresistive MEMS sensors” www.mit.edu.