http://dx.doi.org/10.4236/mme.2015.54014
Pipe Inspection System by Guide Wave
Using a Long Distance Waveguide
Riichi Murayama
1, Kenshi Matsumoto
1, Kenji Ushitani
1, Makiko Kobayashi
21Department of Intelligent Mechanical Engineering, Fukuoka Institute of Technology, Fukuoka, Japan 2Department of Computer Science and Electrical Engineering, Kumamoto University, Kumamoto, Japan
Received 21 September 2015; accepted 23 November 2015; published 27 November 2015
Copyright © 2015 by authors and Scientific Research Publishing Inc.
This work is licensed under the Creative Commons Attribution International License (CC BY).
http://creativecommons.org/licenses/by/4.0/
Abstract
In the industrial fields, many high temperature structures that require a non-destructive inspec-tion exist. However, there are currently few sensors that can carry out non-destructive testing in a high temperature environment. In particular, the ultrasonic sensor is normally not used at over 50 degrees Celsius. Also, a special sensor for high temperature is currently available, but there are various constraints; it has not yet reached a level that is useful in industry. Therefore, we have been developing a new sensor system using a long waveguide which can transmit an ultrasonic wave from a long distance. Especially, this study focuses on applying the developed technique to a pipe which is used in a nuclear power plant. Therefore, the best rectangular-shaped waveguide was studied and attempted to be wound around a pipe to be driven by an acoustic source of a guide wave. Finally, the L (0, 2) and T (0, 1)-mode guide waves were successfully detected by op-timizing the shape of the opposite edge of the rectangular-shaped waveguide that could detect the reflected signal from an artificial defect machined into a test pipe.
Keywords
Waveguide, Guide Wave, EMAT, Nondestructive Inspection, Pipe
1. Introduction
struc-tures, such as a gas tank or a power plant, because the ultrasonic wave has advantages that other sensing systems do not have such that it cannot only detect the internal defects, but also simultaneously can detect the surface and subsurface defects [3]-[8]. However, there are serious drawbacks for the ultrasonic sensor as it cannot be used in high temperature environments. Therefore, an ultrasonic inspection system is notable to be used for high-temperature structures. Thus, Tittmann [9] and other researchers [10] have been developing a sensing sys-tem which can transmit and receive an ultrasonic wave that can travel a long distance by using a long waveguide. This means that an ultrasonic sensor could be driven at atmosphere temperature. In this paper, the method to in-spect a pipe by using a long waveguide is described.
2. Basic Idea for Inspection of a High Temperature Pipe
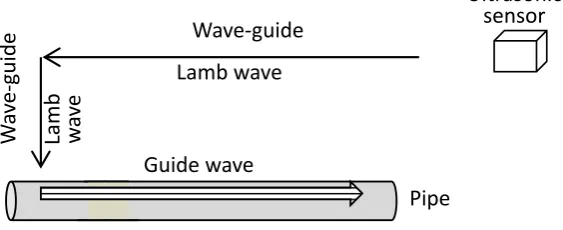
As shown in Figure 1, the sensing system transmits and receives an ultrasonic wave from a long distance using a long waveguide. As a result, an ultrasonic sensor could be used at ambient temperature. Especially, we aimed to inspect a pipe that exchanged heat energy which was installed in a nuclear power plant. Therefore, the rec-tangular-shaped sheet was chosen as the waveguide because the rectangular shape could be easily wound around a pipe. Next, a Lamb wave was selected as the ultrasonic wave travelling in the waveguide because the distance attenuation characteristic was comparatively lower than all other ultrasonic wave modes. We then tried to use a guide wave travelling in the axis direction of a pipe to inspect it because the guide wave had the ability to in-spect over a long distance in a pipe at the same time. This means that it is necessary to transform a Lamb wave travelling a long distance in a waveguide into a guide wave travelling in the axis direction of the pipe.Figure 1
shows the concept of how to inspect a pipe using the rectangle-shaped long waveguide.
3. Drive Principle of a Lamb Wave in a Rectangular-Shaped Sheet Using an EMAT
Generally, an EMAT uses the Lorentz force or the change in the magnetostriction as the driving force in a fer-romagnetic material. However, the change in the magnetostriction was mainly used in this study. An electro-magnet was used to generate a static electro-magnetic field in order to allow the maximum change in the electro- magnetostric-tion. In addition, a high frequency electrical current was added to an electromagnetic induction coil in order to generate a dynamic magnetic field which was superimposed on the static magnetic field. The mixed magnetic field generates a change in the magnetostriction in a ferromagnetic material. The change in the magnetostriction is converted into an ultrasonic wave in the ferromagnetic material. On the other hand, the electromagnetic in-duction coil for the receiver could detect the ultrasonic wave based on the electromagnetic inin-duction phenome-non. The drive principle of an EMAT generating a Lamb wave along the long direction in a ferromagnetic sheet is shown inFigure 2. The EMAT is composed of an electromagnet surrounding the sheet, which can generate a static magnetic field along the axis direction of the sheet, and an electromagnetic induction coil which can gen-erate a dynamic magnetic field along the axis direction of the sheet. A compound magnetic field can oscillate along the axis direction of the sheet, which is needed to generate a Lamb wave travelling along the long direc-tion in the sheet[11]-[14].
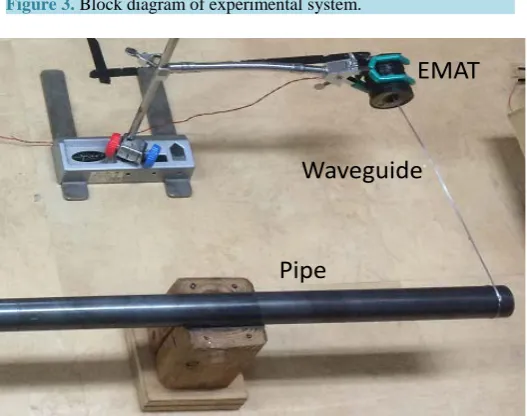
4. Experimental System
[image:2.595.173.455.592.707.2]The experimental system consists of a function generator and a power amplifier, which can input a high fre-
Figure 1. Inspection of a pipe using a long waveguide.
Wave-guide
Lamb wave
La
m
b
w
av
e
Ultrasonic
sensor
Wa
ve
-g
uid
e
quency and high power electric current with a burst shape to an electromagnetic induced coil, a direct power supply, which drives an electromagnet, a pre-amplifier and a frequency filter, which amplifies the received sig-nal by 80 dB, and selects the sigsig-nal between 70 kHz to 1 MHz, and an oscilloscope and CPU, which collects and evaluates the received signal as shown in Figure 3. Photo 1 shows the outlook of the experimental system which consists of the EMAT and the waveguide winding around the test pipe.
5. Optimization of the Waveguide and the Drive Condition of the EMAT
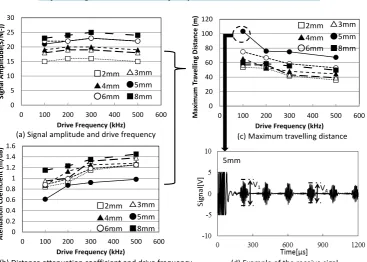
[image:3.595.172.458.213.325.2]In order to propagate a long distance into a waveguide, the best specification of the rectangler-shaped waveguide and the drive condition have been studied. First, the number of turns of the transmitter-electromagnetic induc-
[image:3.595.182.446.495.703.2]Figure 2. Drive principle of a Lamb wave type-EMAT.
Figure 3. Block diagram of experimental system.
Photo 1. Outlook of experimental system.
Direct current power supply
Static magnetic field
Lamb wave
Induced magnetic field
Magnetostriction
Pulsar
Electromagnet
Waveguide
EM coil
Electro-magnetic Induced Coil
Electromagnet
Wave-Guide Pipe
Guide wave Lamb
wave
Pre-amplifier
Frequen cy Filter Oscillosco
pe CPU
EMAT
EMAT Power
Amplifier
Direct Power Supply Function Generator
Pipe
tion coil was determined to be 20 and the diameter of the wire to fabricate the electromagnetic induction coil was determined to be 0.25 mm. Next, the number of turns of the receiver-electromagnetic induction coil was determined to be 40 and the diameter of the wire to fabricate the electromagnetic induction coil was determined to be 0.1 mm. The test sheets of 500 mm length × 0.6 mmthickness × 8, 6, 5, 4, 3, and 2 mm have also been prepared as shown inFigure 4. The 0.6 mm thickness was first chosen when considering the easy of its winding around the pipe. The test was then conducted while changing the sheet width from 2 mm to 8 mm. The drive frequencies of 100, 200, 300, 400, 500 kHz have also been tested because the Lamb wave could be easily generated under 1 MHz. Figure 5(a) shows the relationship between the signal amplitude and the drive frequency which depends on the sheet width. Figure 5(b) also shows the relationship between the distance attenuation coefficients and the drive frequency. The distance attenuation coefficients were evaluated using the received wave form as inFigure 5(d) using Equation (1).Figure 5(c) shows the possible propagation distance of the Lamb wave into the waveguide using Equation (2). As a result, it was indicated that the Lamb wave of a 100 kHz drive frequency could travel over 100 m into the rectangler-shaped waveguide with a 5 mm width.
(
)
{
}
(
14 41)
120 log
c
Lamb
V V V
A
V T T
⋅ −
=
[image:4.595.202.440.248.414.2]− (1)
Figure 4. Experimental conditions to determine the scale of the rectangular- shaped waveguide and the drive frequency.
Figure 5. Experiment to determine the best waveguide that can travel the maximum distance. Drive Frequency 100kHz 200kH 300kHz 400kHz 500kHz 8mm 2mm 6,5,4,3mm 500mm 500mm
Plate thickness = 0.6mm
Plate thickness = 0.6mm Signal
Amplitude Distance Attenuation Coefficient Longest Possible Propagati on Distance ×
Select the best condition 0 0.2 0.4 0.6 0.8 1 1.2 1.4 1.6
0 100 200 300 400 500 600
At enua tio n Co ef fic ie nt (m /dB )
Drive Frequency (kHz)
0 5 10 15 20 25 30
0 100 200 300 400 500 600
Si gn al Am pl itu de (S /N( -))
Drive Frequency (kHz)
0 20 40 60 80 100 120
0 100 200 300 400 500 600
M ax im um T ra ve lli ng D ist an ce (m )
Drive Frequency (kHz)
□2mm
●5mm
▲4mm
○6mm ■8mm
△3mm
5mm
□2mm
●5mm
▲4mm
○6mm ■8mm
△3mm
□2mm
●5mm
▲4mm
○6mm ■8mm
△3mm
(a) Signal amplitude and drive frequency
(b) Distance attenuation coefficient and drive frequency
(c) Maximum travelling distance
(d) Example of the receive sigal
[image:4.595.133.501.437.699.2]AC: Distance attenuation coefficient, VLamb: Velocity of Lamb wave, Vn: Amplitude of nth round trip signal
amplitude (V), Tn: Traveling time of nth round trip signal.
(
)
{
}
max 20 log 1 2 c
L = ⋅ S − A (2)
Lmax: Distance when the S/N of the signal becomes under 2, S1: 1st round trip signal amplitude (S/N(−)).
6. Guide Wave into a Pipe
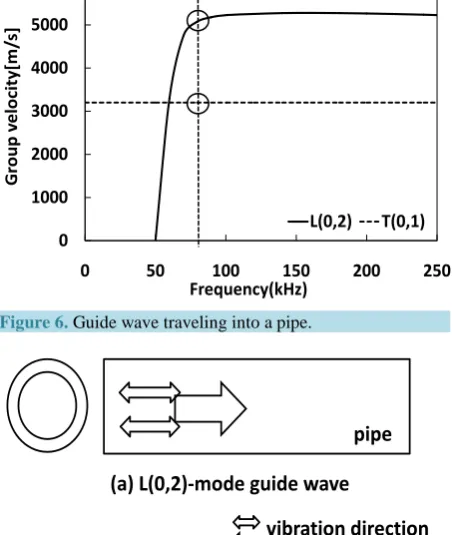
There could be mainly 2 guide waves under a 500 kHz drive frequency according toFigure 6. One is the L(0,2)- mode of 5050 m/s velocity at 100 kHz and the other one is the T(0,1)-mode of 3200 m/s velocity. The L(0,2)- mode oscillates in the axis direction of the pipe and the T(0,1)-mode oscillates in the circumferential direction of the pipe as shown inFigure 7.
7. Idea of Guide Wave Generation Using a Waveguide
We postulated that it may be possible to generate a guide wave by propagating an ultrasonic wave into the pipe from the waveguide that was wound around the pipe. Especially, we tried to separately generate and receive the T (0, 1)-mode guide wave and L (0, 2)-mode guide wave. Figure 8 shows how to generate a T (0, 1)-mode guide wave. The velocity of the Lamb wave was computed as about 5000 m/s using the received signal of
[image:5.595.200.427.342.610.2]Figure 5(d). This indicated that the Lamb wave is the S0-mode and the oscillation direction is parallel to the
Figure 6. Guide wave traveling into a pipe.
Figure 7. Oscillation pattern of the guide wave of T(0,1) and
L(0,2)-mode. 0
1000 2000 3000 4000 5000 6000
0 50 100 150 200 250
G
rou
p v
el
oci
ty
[m/
s]
Frequency(kHz)
L(0,2) T(0,1)
pipe
pipe
vibration direction
propagation direction
travelling direction. The acoustic source, which goes around a pipe with the oscillation direction in the circumferential direction, could then be made when the waveguide is wound in the circumferential direction as shown in Figure 9. We assumed that such an acoustic source can generate a guide wave travelling in the axis direction with the oscillation in the circumferential direction.
In the case of the T (0, 1)-mode guide wave, the T-shaped waveguide was fabricated because the oscillation direction of the Lamb wave was in the vertical direction to the travelling direction after the Lamb wave turned to both sides at the intersection as shown in the simulation results using SWAN21 simulation software[15] [16].
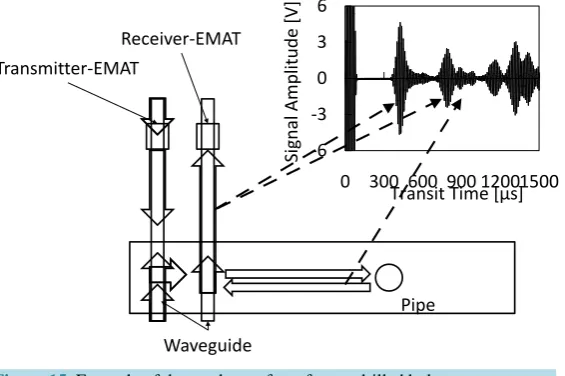
8. Experimental Results
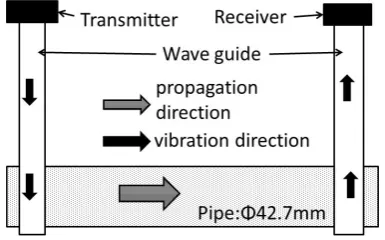
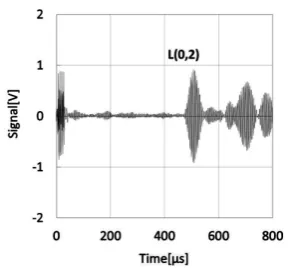
[image:6.595.173.453.322.516.2]A 32A steel pipe, 1.5 m in length and 0.6 mm thick, was prepared to confirm if the waveguide can generate and receive the guide wave. The transmitter waveguide was placed 13 mm from the pipe at the left end, and the re-ceiver was installed 26 mm from the right end as shown inFigure 10. The distance between the transmitter and the receiver was 1000 mm. The fixture has been fabricated to continuously detect the L (0, 2)-mode guide wave and T (0, 1)-mode guide wave as shown in Figure 11.Figure 12 andFigure 13show the received signal wave-form which travels between the transmitter and the receiver. In the case of the T (0, 1)-mode, the transit time was computed by adding the transit time into the two waveguides, which were used for the transmitter and the receiver, and the transit time between the transmitter-waveguide and the receiver-waveguide by the T (0, 1)- mode guide wave. The time was about 700 μs. The S/N of the received signal was 6.5, although there were some
Figure 8. Winding method on a pipe to generate a T(0,1)-mode guide wave.
Figure 9. Winding method on a way to generate a L(0,2)-mode guide wave.
Figure 10. Experimental method to detect a guide wave by the pitch-catch method.
Wavegude
EMAT Oscillation direction of Lamb wave
Traveling direction of Lamb wave Oscillation direction of gide wave into a pipe
Traveling direction of guide wave into a Pipe
Pipe
Sensor
Pipe Oscillation direction(Wave guide) Travelingdirection(Wave guide) Oscillation direction(Pipe)
Traveling direction(Pipe)
Wave guide
[image:6.595.216.409.573.693.2]Figure 11. Method of fixing the waveguide at the edge of the pipe.
Figure 12.Received signal by T(0, 1)-mode
Figure 13. Received signal by L(0, 2)-mode.
pseudo signals between from 0 μs to 700 μs. In the case of the L (0, 2)-mode, the transit time was computed by adding the transit time into the two waveguides, which were for the transmitter and the receiver, and the transit time between the transmitter-waveguide and the receiver-waveguide by the L(0,2)-mode guide wave. The result was about 500 μs. The S/N of the received signal was 11.8 and the pseudo signal couldn’t be detected. We could confirm that the signals by both guide waves can be detected with a sufficient S/N.
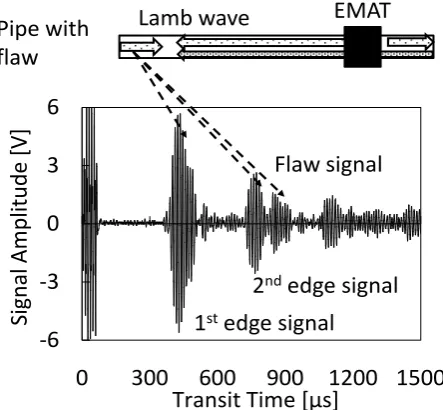
9. Detection of Artificial Defects Machined into a Pipe
[image:7.595.241.387.395.533.2]Figure 14. Schematic diagram of the defects detection.
Figure 15. Example of detected waveform from a drilled hole.
defects. It means that is difficult to identify the reflected signal from the defects. A trial to eliminate the edge signal has been then conducted. Many trials have been conducted to eliminate the edge signal, for example, changing the bottom shape of the wave guide, making the side surface of the waveguide rough, or adding many metal type blocks on the bottom side of the waveguide. Finally, the edge signal could be eliminated using a lead block by comparingFigure 16 andFigure 17. That is, the signal ratio between the defect signal and the edge signal without the lead block was 0.6 and 7.3 with the lead block. When the lead block was used,Figure 18
shows the evaluation results using the developed system. In the case of the drilled holes, the reflected signal from the drilled hole with a 5 mm diameter could be detected with more than an S/N = 2 for whichever an L (0, 2)- or T(0,1)-mode guide wave had been used, although the reflected signal was not very strong. Next, the re-flected signal amplitude by the L (0, 2)-mode increased as the diameter of the drilled hole, although the rere-flected signal amplitude by the T (0, 1)-mode hasn’t almost changed. In the case of cylindrical notches, the reflected signal by the T(0,1)-mode guide wave was much better than that of the L (0, 2)-mode guide wave except for the result of the notch with a 0.5 mm depth. The reflected signal of the T (0, 1)-mode guide wave by the 1mmnotch has about an S/N = 9, and an S/N = 3 in the case of L (0, 2). The results probably indicate that the T (0, 1)-mode guide wave typically travels in the subsurface as a general nature and not on the surface of a pipe.
10. High Temperature Experiment
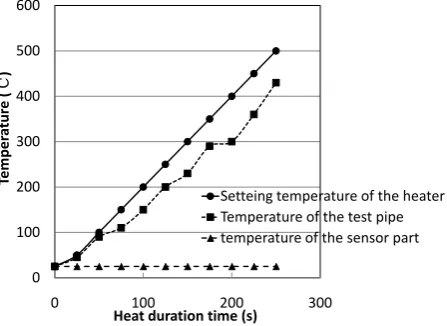
The influence in which the temperature has been increased was evaluated.Figure 19 shows the relationship Transmitter-EMAT
Waveguide (1000mm)
Pipe length: 1500mm
Diameter: φ42.7mm
Flaw Receiver-EMAT
Guide wave
Lamb wave R
D
Drilled hole
Cylindrical noth Transmitter-EMAT
Waveguide (1000mm)
Pipe length: 1500mm
Diameter: φ42.7mm
Flaw Receiver-EMAT
Guide wave Lamb wave 700mm
700mm
(a) Drilled hole
(b) Cylindrical notch
Transmitter-EMAT
Receiver-EMAT
Waveguide
Pipe -6
-3 0 3 6
0 300 600 900 12001500Transit Time [μs]
Sig
nal Amp
lit
ud
e
[V
Figure 16.Received signal without a lead absorber.
Figure 17. Received signal with a lead absorber.
(a) (b)
Figure 18. Evaluation results for detecting defects using the developed sys-tem. (a) Drilled hole; (b) Cylindrical notch.
-6
-3
0
3
6
0
300
600
900 1200 1500
Transit Time [
μs
]
Sig
nal Amp
lit
ud
e
[V
]
EMAT
Lamb wave
Pipe with
flaw
1
stedge signal
2
ndedge signal
Flaw signal
-6 -3 0 3 6
0 300 600 900 1200 1500
Transit Time [μs]
Sig
nal Amp
lit
ud
e
[V
]
EMAT Lamb wave
Lead
(Acoustic absorber) Pipe with
flaw
1stedge signal Flaw signal
0 5 10 15
0 5 10 15 20 25
S/N
Diameter of Drill Hole [mm] 0 5 10 15
0 0.5 1 1.5 2 2.5 3
S/N
Depth of Notch [mm] L(0,2) T(0,1)
T(0,1)
between the temperature of the heater, the temperature of the pipe, and the temperature of the sensor position. The temperature of the sensor position remains at ambient even if the temperature of the pipe increases from 25 degree Celsius to 500 degree Celsius.Figure 20 shows the relationship between the set temperature of the hea-ter and the signal amplitude of the reflected signal at the opposite end of the waveguide, and at the opposite side of the pipe. Although the signal amplitude reflected at the edge of the waveguide has decreased by about 25%, the variation in the signal amplitude reflected at the opposite side of the pipe was 0.30 ± 0.02 V. It was deter-mined that the influence of the increasing temperature could be ignored.
11. Conclusion
[image:10.595.203.427.284.447.2]A new inspection system has been developed to guarantee high temperature-pipe quality using a guide wave by installing a long waveguide. First, the rectangle-shaped sheet with a 5 mm width and 0.6 mm thickness as the waveguide has been confirmed to be able to transmit a Lamb wave over about 80 m. Next, it was confirmed that the T(0, 1)-mode guide wave could be generated and received by the rectangular- and straight-shaped wave guides wound in the circumferential direction, and L(0, 2)-mode guide wave could be generated and received by the T-shaped part of the rectangular waveguide mounted in the circumferential direction of the pipe. However,
Figure 19. Relationship between the temperature at different positions and heat duration time.
Figure 20. Relationship between the signal amplitude and the temperature.
0 100 200 300 400 500 600
0 100 200 300
Temp
er
at
ur
e (
℃
)
Heat duration time (s)
Setteing temperature of the heater Temperature of the test pipe temperature of the sensor part
0 0.2 0.4 0.6 0.8 1 1.2 1.4
0 200 400 600
Sig
na
l a
m
plit
ud
e
(V)
Setting temperature of the heater (℃)
Amplitude of the reflected signal at the waveguide
[image:10.595.201.426.483.692.2]when the inspection system tried to detect the defects by the pitch-catch method, it was determined that the re-flected signal at the opposite side of the waveguide blocked the rere-flected signal from the defects. Finally, it was determined that a lead sheet on the surface of the opposite side of the waveguide could eliminate the disturbed signal. As a result of the evaluation experiment, a 5 mm diameter drilled hole and a 0.5 mm depth cylindrical notch could be detected by the developed system. The high temperature pipe inspection by the guide wave can be achieved by using a thin and long rectangular waveguide. It will lead to inspect a high-temperature pipe in a power plant, for example, a heat exchange tube.
Acknowledgements
This work was partially supported by a Grant-in-Aid for Scientific Research from the Ministry of Education Culture, Sports, Science and Technology (C26420032).
References
[1] Bray, D.E. and Stanley, R.K. (1997) Nondestructive Evaluation, Chapter 8. CRC Press, New York, p. 103.
[2] Raj, B., Rajendran, V. and Palanichamy, P. (2004) Science and Technology of Ultrasonics, Chapter 7. Alpha Science International Ltd., Oxford, p. 177.
[3] McNab, A., Kirk, K.J. and Cochran, A. (1998) Ultrasonic Transducers for High Temperature Applications. IEE Pro-ceedings—Science, Measurement and Technology, 145, 229-236. http://dx.doi.org/10.1049/ip-smt:19982210
[4] Muto, K. and Atsuta, Y. (1992) Applications of Brazed-Type Ultrasonic Probes for High and Low Temperature Uses.
Nondstructive Testing and Evaluation, 7, 263-272. http://dx.doi.org/10.1080/10589759208953005
[5] Karasawa, H., Izumi, M., Suzuki, T., Nagai, S., Tamura, M. and Fujimori, S. (2000) Development of Under-Sodium Three-Dimensional Visual Inspection Technique Using Matrix-Arrayed Ultrasonic Transducer. Journal of Nuclear Science and Technology, 37, 769-779. http://dx.doi.org/10.1080/18811248.2000.9714955
[6] Sakamoto, M., Tabaru, T., Akiyama, M. and Noma, H. (2007) Development of an AE Sensor for High Temperature.
Hihakai Kensa, 56, 225-230. (In Japanese)
[7] Kobayashi, M. and Jen, C.K. (2004) Piezoelectric Thick Bismuth Titanate/Lead Zirconate Titanate Composite Film Transducers for Smart NDE of Metals. Smart Materials and Structure, 13, 951-956.
http://dx.doi.org/10.1088/0964-1726/13/4/033
[8] Kobayashi, M., Jen, C.K., Ono, Y. and Moisan, J.F. (2005) Integratable High Temperature Ultrasonic Transducers for NDT of Metals and Industrial Process Monitoring. CINDE Journal, 26, 5-11.
[9] Tittmann, B.R. (2003) A Novel Technique With a Magnetostrictive Transducer for in Situ Length Monitoring of a Distant Specimen. Ultrasonic Nondestructive Evaluation for Material Science and Industries, 3, 73-78.
[10] Murayama, R., Kobayashi, M., Matsumoto, K. and Kobayashi, M. (2014) Ultrasonic Inspection System Using a Long Waveguide with an Acoustic Horn for High-Temperature Structure. Journal of Sensor Technology, 4, 177-185. http://dx.doi.org/10.4236/jst.2014.44017
[11] Thompson, R.B. (1973) A Model for the Electromagnetic Generation and Detection of Rayleigh and Lamb Wave.
IEEE Transaction on Sonics and Ultrasonic, 20, 340-346. http://dx.doi.org/10.1109/T-SU.1973.29770
[12] Hirao, M. and Ogi, H. (2003) EMATs for Science and Industry. Kluwer Academic Publishers, Boston, Dordrecht and London. http://dx.doi.org/10.1007/978-1-4757-3743-1
[13] Ogi, H., Goda, E. and Hirao, M. (2003) Increase of Efficiency of Magnetostriction SH-Wave EMAT by Angled Bias Field: Piezomagnetic Theory and Measurement. Japanese Journal of Applied Physics, 42, 3020-3024.
http://dx.doi.org/10.1143/JJAP.42.3020
[14] Hirao, M., Ogi, H. and Yasui, H. (2001) Contactless Measurement of Bolt Axial Stress Using a Shear-Wave Electro-magnetic Acoustic Transducer. NDT & E International, 34, 179-183.
http://dx.doi.org/10.1016/S0963-8695(00)00055-4
[15] Nakahata, K., Terada, K., Kyoya, T., Tsukino, M. and Ishii, K. (2012) Simulation of Ultrasonic and Electromagnetic Wave Propagation for Nondestructive Testing of Concrete Using Image-Based FIT. Journal of Computational Science and Technology, 6, 28-37. http://dx.doi.org/10.1299/jcst.6.28