International Journal of Emerging Technology and Advanced Engineering
Website: www.ijetae.com (ISSN 2250-2459,ISO 9001:2008 Certified Journal, Volume 4, Issue 3, March 2014)
302
Management of Power flow using UPFC
V. P. Kuralkar
1, K. S. Gadgil
21,2Asst Prof in Electrical Engg, AISSMS IOIT, Pune Abstract—With the rapid development of power
electronics, Flexible AC Transmission Systems (FACTS) devices have been proposed and implemented in power systems. FACTS devices can be used to control power flow and enhance system stability [1]. However, their coordination with the conventional damping controllers in aiding of power system oscillation damping is still an open problem. Therefore, it is important to study the coordinated control of FACTS devices and traditional power system controllers in large power systems. Among the converter based FACTS devices Static Synchronous Compensator (STATCOM) and Unified Power Flow Controller (UPFC) are the popular FACTS devices. Considering the practical application of UPFC in power systems, it is important to investigate the benefits as well as model this device for power system steady state operation. Modeling, simulation and analysis of an IEEE 14 bus system in MATLAB environment is proposed in this paper. Comparison with and without UPFC is done to control the power flow and obtain the power system steady state operation. The result of active power, P (MW) , reactive power ,Q (MVar) are compared .
Keywords -- UPFC, Power Flow, Model of UPFC , Reactive and Active Power .
I. INTRODUCTION
With the rapid development of power electronics, Flexible AC Transmission Systems(FACTS) devices have been proposed and implemented in power systems. FACTS devices can be utilized to control power flow and enhance system stability. Particularly with the deregulation of the electricity market, there is an increasing interest in using FACTS devices in the operation and control of power systems with new loading and power flow conditions. A better utilization of the existing power systems to increase their capacities and controllability by installing FACTS devices becomes imperative. Due to the present situation, there are two main aspects that should be considered in using FACTS devices: The first aspect is the flexible power operation according to the power flow capability of FACTS devices .The other aspect is the improvement of transient and steady-state stability of power systems. FACTS devices are the right equipment to meet these challenges. system operation according to the power flow control capability of FACTS devices.
A large majority of power transmission lines are AC lines operating at different voltages (10 kV to 800 kV). The distributed networks generally operate below 100 kV while the bulk power is transmitted at higher voltages. AC lines have no provision for the control of power flow but fortunately these lines have inherent power flow control as it is determined by the power at the sending or receiving end [9]. In comparison with a AC transmission line , the power flow in a HVDC line is controlled and regulated. Therefore, it becomes essential to use FACTS devices in the system.
II. TECHNICAL PROBLEMS IN ACSYSTEMS
The performance of power systems decreases with the size, the loading and the complexity of the networks. This is related to problems with load flow, power oscillations and voltage quality [7]. Such problems are even deepened by the changing situations resulting from deregulation of the electrical power markets, where contractual power flows do no more follow the initial design criteria of the existing network configuration. Additional problems can arise in case of large system interconnections, especially when the connecting AC links are weak.
III. THE USE OF FACTS TO CONTROL POWER FLOW IN
[image:1.612.324.569.484.645.2]TRANSMISSION LINE
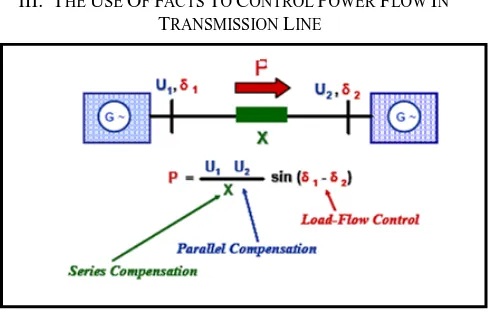
Fig 3.1: The Use of FACTS for Power Transmission
International Journal of Emerging Technology and Advanced Engineering
Website: www.ijetae.com (ISSN 2250-2459,ISO 9001:2008 Certified Journal, Volume 4, Issue 3, March 2014)
303 Power Flow in AC transmission line is needed to a) enhance power transfer capacity and or b) to change power flow under dynamic conditions (disturbances such as line trip, generator outage etc) . Power transmitted between two nodes in the systems depends on voltages at both ends of the inter connection, the impedance of the line and the angle difference between both systems. Different FACTS device scan actively influence one or more of these parameters and control the power flow through the interconnection. FACTS Controllers provide voltage support at critical buses in the system (with shunt connected controllers) and regulate power flow in critical lines (with series connected controllers). Both voltage and power flow are controlled by the combined series and shunt controller (UPFC).
IV. VARIOUS FACTORS FOR INSTALLING FACTS DEVICES
There are three factors to be considered before installing FACTS devices:
1. The type of device 2. The capacity required
3. The location that optimize the functioning of the device Out of these three factors, the last one is of great importance, because the desired effect and the proper features of t he system depend of the location of FACTS.
V. OPTIMAL CHOICE AND ALLOCATION OF FACTS DEVICES
FACTS devices can be used to control power flows. Therefore, provided optimal locations, FACTS devices can be used to achieve the optimal power flow without any constraint violation and thus to increase the utilization of the lowest cost generation in power systems. FACTS types and locations should be reasonably chosen according to their contribution to the general objective of power system economic generation and dispatch. The decision of where to place a FACTS device is largely dependent on the desired effect and the characteristics of the specific system. One of the possible methods for determining the optimal location of a device is to perform separate power flow
study with the devices in each line, but this is time
consuming. Some general guidelines are:
a)Prevention of loop flows: The device should be placed in one of the transmission line on which the loop flow occurs, with power flow either being forced to zero or sent in the opposite direction of the loop flow.
b)Electronic Fence: The concept of an electronic fence is an attempt by a utility to protect its property rights by preventing another utility from using its transmission system. This is analogous to a physical fence keeping trespassers from passing through an individual’s property. In this case there is limited number of access points, being the tie-lines connecting the utility to its neighbor.
c)Obtaining a specific operating condition: The placement of a FACTS device to obtain a desired operating condition, such as correcting an under voltage or forcing a certain amount of current flow through a line. The proper location and type of device will be determined by the specific condition.
The intended objective of a FACTS device will have a large impact on the optimal location of the device. A location that is best for one objective may be less than optimal for another. Additionally, since the characteristics of each utility’s system are unique, optimal locations may vary between utilities. Therefore, a series of guidelines were developed for choosing the type and location of FACTS devices for various possible objectives.
VI.POWER FLOW MODEL OF UPFC
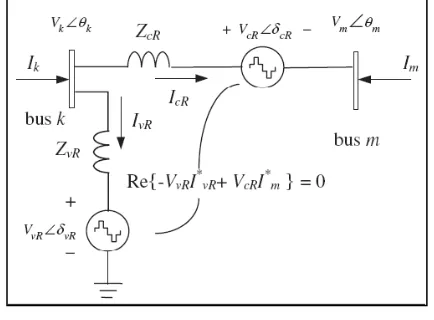
[image:2.612.335.552.484.644.2]The equivalent circuit consists of two coordinated synchronous voltage sources should represent the UPFC adequately for the purpose of fundamental frequency steady state analysis. Such an equivalent circuit is shown in the figure 6.1.
Fig 6.1 Equivalent circuit of UPFC
The UPFC voltage sources are :
International Journal of Emerging Technology and Advanced Engineering
Website: www.ijetae.com (ISSN 2250-2459,ISO 9001:2008 Certified Journal, Volume 4, Issue 3, March 2014)
304 Where VvR and δvRare the controllable magnitude (VvRmin ≤VvR ≤ VvRmax) and phase angle (0 ≤ δvR ≤2п) of the voltage source representing the shunt converter. The magnitude VcR and phase angle δcR of the voltage source representing the series converter are controlled between limits (VcRmin ≤ VcR≤VcRmax) and (0 ≤ δcR ≤2п), respectively. The phase angle of the series injected voltage determines the mode of power flow control [1], [4]. If δcR is in phase with the nodal voltage angle Өk, the UPFC regulates the terminal voltage. If δcR is in quadrature with Өk, it controls active power flow, acting as a phase shifter. If δcR is in quadrature with line current angle then it controls active power flow, acting as a variable series compensator. At any other value of δcR, the UPFC operates as a combination of voltage regulator, variable series compensator, and phase shifter. The magnitude of the series injected voltage determines the amount of power flow to be controlled. Assuming lossless converter values, the active power supplied to the shunt converter, PvR, equals the active power demanded by the
series converter, PcR; i.e. Furthermore, if
the coupling transformers are assumed to contain no resistance then the active power at bus k matches the active power at bus m.
Accordingly, . The UPFC
power equations are combined with those of the AC network.
VII. IMPORTANCE OF LOAD FLOW STUDIES
1)Planning the operation of power systems under
existing systems, its improvement and also its future expansions require the load flow studies.
2)Through the load flow studies the voltage magnitudes
and angles at each bus in the steady state are obtained.
3)The reactive and active power flow through each line
can be computed.
VIII. STEADY STATE ANALYSIS OF 14BUS SYSTEM
For the Standard IEEE -14 bus system the power flow is done using Newton Raphson. This is the basic case in which no FACTS devices are used.
In the next step, for the same bus system power flow is done using Newton Raphson but this time the UPFC is inserted in the system.
The comparative study of all the above cases is done based on the results obtained.
8.1Test Case
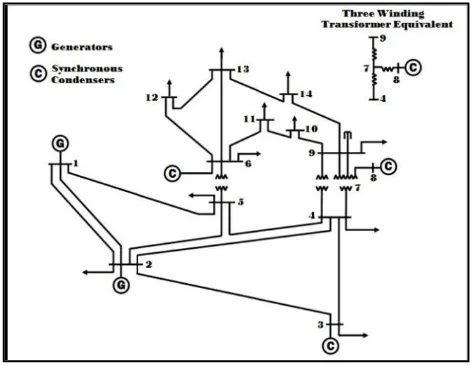
[image:3.612.326.563.230.413.2]In the case study standard 14-bus test network is tested with UPFC separately, to investigate the behavior of the the device in the network. Power flow program is executed for three cases explained above.
Fig 8.1: Sample fourteen bus system
The input data includes the basic system data needed for conventional power flow calculation, i.e., the number of buses 14 and number of transmission line20.System admittance matrix and conventional Jacobian matrix is formed due to incoming of UPFC[12]. At the next step, Jacobian matrix and the mismatched power flow equations are modified. The bus voltages are updated at each iteration. Convergence is checked and accordingly ,Jacobian matrix is modified and power equations are mismatched until convergence is achieved. When convergence is achieved the power flow results are displayed.
International Journal of Emerging Technology and Advanced Engineering
Website: www.ijetae.com (ISSN 2250-2459,ISO 9001:2008 Certified Journal, Volume 4, Issue 3, March 2014)
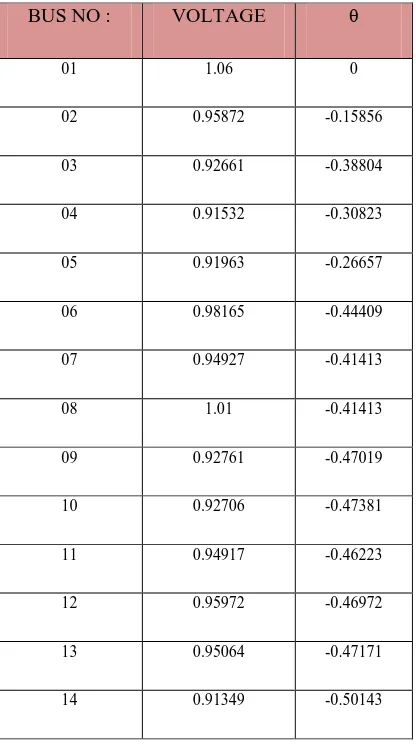
[image:4.612.63.271.160.535.2]305 Table 1
Bus Results With Out Facts Devices
From the power flow results for the 14 -bus system (Table 1), it can be observed that the voltage magnitude at bus 14 is the lowest and is therefore the potential bus for the application of UPFC .
Table 2
Power Flow Line Results Without Facts Devices
LINE P , pu Q , pu LINE P , pu Q , pu
01 0.24128 0.029896 11 1 -0.15743
02 0.04853 0.019296 12 -0.41 0.057391
03 0.01246 0.0077433 13 -0.13 0.080041
04 0.11308 0.058634 14 0.457 0.041905
05 0.05979 0.050476 15 0.336 -0.057267
06 0.03830 0.037474 16 0.322 0.021366
07 0.01590 -0.0025673 17 0.039 0.014865
08 0.04306 0.0041408 18 0.286 0.031511
09 -0.4579 -0.026004 19 0.188 -0.020704
[image:4.612.306.582.160.465.2]10 0.18874 0.096315 20 0 0.14178
Table 3
Bus Results With Upfc Included In Bus 14 And Bus 13
BUS NO
VOLTAGE θ BUS NO
VOLTAGE θ
01 1.06 0 08 1.03 -0.41226
02 0.95872 -0.15833 09 0.94193 -0.46668
03 0.92661 -0.3871 10 0.93908 -0.47101
04 0.92018 -0.30823 11 0.95541 -0.46141
05 0.9211 -0.2661 12 0.9633 -0.4731
06 0.98165 -0.44479 13 0.9567 -0.4795
07 0.95651 -0.41226 14 0.95872 -0.5043
BUS NO : VOLTAGE θ
01 1.06 0
02 0.95872 -0.15856
03 0.92661 -0.38804
04 0.91532 -0.30823
05 0.91963 -0.26657
06 0.98165 -0.44409
07 0.94927 -0.41413
08 1.01 -0.41413
09 0.92761 -0.47019
10 0.92706 -0.47381
11 0.94917 -0.46223
12 0.95972 -0.46972
13 0.95064 -0.47171
International Journal of Emerging Technology and Advanced Engineering
Website: www.ijetae.com (ISSN 2250-2459,ISO 9001:2008 Certified Journal, Volume 4, Issue 3, March 2014)
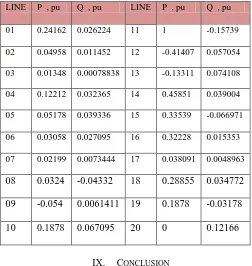
306 The UPFC maintains the active and reactive powers leaving the UPFC, towards bus 14 at -0.054 p.u and 0.00614 p.u (Table 4 , transmission line number 9). Convergence is obtained in four iterations to a power
mismatch tolerance of 10 -12.There is increase in the active
[image:5.612.43.295.268.534.2]power also due to the demand of the UPFC series converter. The negative sign shows the direction of power flow from the shunt converter end to the series converter end.
Table 4
Power Flow Line Results With Upfc Included In Bus 14 And Bus 13
LINE P , pu Q , pu LINE P , pu Q , pu
01 0.24162 0.026224 11 1 -0.15739
02 0.04958 0.011452 12 -0.41407 0.057054
03 0.01348 0.00078838 13 -0.13311 0.074108
04 0.12212 0.032365 14 0.45851 0.039004
05 0.05178 0.039336 15 0.33539 -0.066971
06 0.03058 0.027095 16 0.32228 0.015353
07 0.02199 0.0073444 17 0.038091 0.0048963
08 0.0324 -0.04332 18 0.28855 0.034772
09 -0.054 0.0061411 19 0.1878 -0.03178
10 0.1878 0.067095 20 0 0.12166
IX. CONCLUSION
This paper has presented the simulation methods required for the study of the steady state operation of electrical systems with FACTS device, UPFC. The power flow for the fourteen bus system is analyzed with and without UPFC.
The sample 14 bus network is modified to include one UPFC in between Bus No.14 and 13. The UPFC shunt controller is set to regulate the nodal voltage magnitude at bus 14. There is large amount of increase in the active power as well as the reactive power. The steady state model of UPFC is analyzed and evaluated in Newton-Raphson algorithm.
The static analysis shows that UPFC is able to control not only the voltage but also the impedance and phase angle which affect the power flow in the transmission line.
There is increase in the active power also due to the demand of the UPFC series converter. The negative sign shows the direction of power flow from the shunt converter end to the series converter end.
REFERENCES
[1] Narain G. Hingorani and Laszlo Gyugyi ,“Understanding FACTS” by, Wiley India publication.
[2] AlirezaSeifi ,Sasan Gholami , and Amin Shabanpour , “ Power Flow Study and Comparison of FACTS: Series (SSSC), Shunt (STATCOM), and Shunt-Series (UPFC).”, The Pacific Journal of Science and Technology , 2010
[3] Y. H. Song, A. T. Johns , “Flexible AC Transmission Systems (FACTS)’’, IEE Press, London, 1999. ISBN 0-85296-771-3. [4] Y. Guo, D.J. Hill, Y. Wang. "Global transient stability and voltage
regulation for power systems", IEEETransactions on Power Systems.vol. 16, no. 4. November 2001.
[5] J.Y. Liu; Y.H. Song; P.A. Mehta, "Strategies for handling UPFC constraints in steady-state power flow and voltage control".IEEE Transactions on Power Systems.VOL. 15, May 2000, pp. 566–571. [6] S. Gerbex, R. Cherkaoui, and A. J. Germond, "Optimal location of
multi-type FACTS devices in a power system by means of genetic algorithms," IEEE Trans.Power Systems, vol. 16, August. 2001, pp. 537-544.
[7] D. Povh, D. Retzmann Siemens, Erlangen, Germany “Development of facts for transmission systems”.
[8] E. Acha, V G Agelidis, O Anaya-Lara, and T J E Miller “Power Electronic Control in Electrical Systems” ELSEVIER, 2002. [9] K.RPadiyar, “FACTS Controllers in Power Transmission and
Distribution”, New Age International Publishers .
[10] X. Lei, D. Jiang and D. Retzmann, "Stability improvement in power systems withnon-linear TCSC control strategies", ETEP, vol. 10, No. 6, November/December.2000, pp. 339-345.
[11] SaminaElyasMubeen, R. K. Nema, and GayatriAgnihotri, “Power Flow Control with UPFC in PowerTransmission System”.
[12] Adepoju, G. A. 1, Komolafe, O.A. , “Analysis and Modeling of Static Synchronous Compensator (STATCOM): A comparison of Power Injection and Current Injection Models in Power Flow Study ’’, International Journal of Advanced Science and Technology Vol. 36, November, 2011 , 652