A Research on Investigating the Optimization
of Process Parameters of Aluminum Alloy 6061
by using Wire EDM
Raman Sharma1, Puneet Katyal2, Vijender Gill3, Munish Gupta4
1Research Scholar, Mechanical Engineering Department, GJUS&T Hisar (India)-125001 2,4Professor, Mechanical Engineering Department, GJUS&T Hisar (India)-125001 3Assistant Professor, Mechanical Engineering Department, GJUS&T Hisar (India)-125001
Abstract: In this paper, the wire electric discharge machining (WEDM) of Aluminium alloy 6061 is studied. The prime objective is to optimize metal removal rate (MRR) and surface roughness (SR) using multi-response optimization. To obtain high quality during machining process, the selection of optimal cutting parameters is very important. The four process parameters viz. current (IP), pulse on time (Ton), pulse off time (Toff) and servo voltage (SV) have been considered in this study for optimal
settings, for machining of the material. Taguchi method and Grey relational analysis (GRA) technique have been used to obtain the optimal process parameters for the responses of interest. The L16orthogonal array based on Taguchi method is used to find
the optimum process parameters. ANOVA (analysis of variance) is used with Minitab16 to determine the process parameter which mainly effects MRR and SR. The pulse on time (Ton) is found to be the main factor effecting MRR and SR.
Keywords: ANOVA, Al alloy 6061, GRA, MRR, SR, Taguchi method, WEDM.
I. INTRODUCTION
Electric discharge machining (EDM) is defined as process of electro-thermal non-conventional machining type in which electrical energy is used to produce electrical sparks and material removed by the thermal energy of sparks. Electric discharge machining is mostly used to machine high temperature resistant alloys materials and is hard to-machine by conventional machining process. EDM can be utilized to machine complex geometries.
Work material to be machined by EDM must be electrically conductive .WEDM is a machining procedure in which an electrode that goes through a fixed path to cut conductive materials without considering their hardness and strength. It is able for delivering a fine, exact, corrosion resistant and wear resistant surfaces [1].
In Wire EDM, a constantly moving conductive material is worked as an electrode and material is removed from the work piece by a progression of discrete sparks between the work piece and wire electrode isolated by a thin film of dielectric liquid [2]. The dielectric fluid is constantly passed to the spark area to flush away the eroded material and it also works as a coolant. During the WEDM process, there is no immediate contact between the work piece and the wire.
WEDM uses a constantly travelling wire electrode made of thin brass, molybdenum, copper or tungsten of diameter 0.05-0.50 mm, which is fit for accomplishing less corner radii. Wire EDM has high potential in recent times in the metal cutting industry for accomplishing a high dimensional accuracy, surface machining and forming contour elements of items or parts. The troubles faced in the die sinking electric discharge machining are removed with Wire EDM as complicated design tool is removed by moving conductive wire and relative motion of wire guides.
Fig.1: Wire EDM Process
II. LITERATURE REVIEW
Sharma et al. [2016] investigated machining parameters for cutting speed, die width and Surface roughness of H-21 die tool steel in WEDM. The L18 orthogonal array based on Taguchi method is used to find the optimum process parameters. The five process parameters viz. peak current, pulse on time, pulse off time, wire speed and wire tension have been considered in this study for optimal settings, for machining of the material. It concluded that average cutting speed is mostly affected by pulse on, pulse off, peak current and wire feed during ruff cut and there is no most significant factor that affects the surface roughness.
Kumar et al. [2016] studied the effects of machining parameters on the material removal rate of Stainless steel (SS 304) in WEDM. The three process parameters viz. pulse on time, pulse off time and servo voltage has been considered in this study for optimal settings, for machining of the material. The design of experiment is based on Taguchi Design approach L9orthogonal array. The analysis of results indicated that diffused wire gives more material removal rate (MRR) as compare to the brass wire. The results showed that the pulse on time and servo voltage has the highest influence on material removal rate (MRR).
with pulse off time. Pramanik and Basak[2015] studied that the longer pulse on time generated more heat and facilitated the removal rate of material to any other materials, the increase of pulse on time increases the removal rate of material for 6061 Aluminium alloy. The surface roughness is found to decrease with the increase of wire tension. The longer pulse on time induces higher wear in the wire electrode. On the other hand, higher tension in the wire electrode reduces the wear by providing steady machining. Tapered slots were produced due to progressive wear of the wire electrode. The amount of taper increased with the increase of the electrode wear. ashid et al. [2014] studied the parametric optimization using Taguchi method for WEDM of steel grade EN 9 component. The three process parameters viz. Pulse on-time, Pulse off-time and wire feed. The experimentation is conducted by using Taguchi’s L9 orthogonal array. The results are analyzed using analysis of variance (ANOVA) and response graphs and presented. Khan et al. [2014] studied that the effect of the WEDM parameters on the SR and the micro hardness of the High Strength Low Alloy steel (ASTM A572-grade 50). The L9 orthogonal array based on Taguchi method was performed and GRA method is subsequently applied to determine an optimal WEDM parameter setting. The SI parameters i.e. surface roughness and micro hardness are selected as the quality targets. The pulse off-time is found to be the most influential factor for both the surface roughness and the micro-hardness. The results of ANOVA concluded that the pulse off-time is the most significantly controlled factor for affecting the SI in the WEDM. Li et al. [2014] studied on the evolution process of surface integrity and machining efficiency of WEDM of IN718 (Nickel-based Alloy) by one rough cut (RC) mode followed by three trim cut (TC) modes. Material removal efficiency, surface roughness, surface topography, surface alloying, and micro hardness have been characterized. Results show that high material removal efficiency can be achieved in WEDM. Six-sigma distribution of Ra in RC mode is different from that of TC modes. The high toughness of IN 718 would be the major contributing factor to the absence of micro cracks in the TC modes. Jindal et al. [2014] reported the effect of cutting parameters on Material Removal rate and Surface Roughness during turning of AISI H21 steel under dry machining condition using Response surface methodology (RSM). CNMG 120412 MP of Grade TT 8135 has been selected as cutting tool material AND experiments are done on HMT CNC lathe machine Stallion-100 HS. The experimental results indicated that MRR increases with the increase in feed rate, spindle speed and depth of cut. It is also seen that the Surface roughness decreases with increase in spindle speed but increases with increase in feed rate.
Sivanaga et al. [2014] studied the selection of best process parameter of WEDM while machining 18-4-1 grade speed steel (HSS) of different thickness from 5mm to 80mm. Experiments were done on work piece by varying power input and condition of best power value with stable machining and high cutting speed is recognized. Then all performance measures are evaluated like surface roughness, Material removal rate, Spark gap etc. Experiments were repeated with all different thickness of work piece material. Later on mathematical correlation was developed with software. Finally, this correlation and parameter evaluation are studied to choose best process parameter. Joshi et al. [2014] studied the control parameters required for machining of tool steel. EN 31 is used vastly in engineering applications. The objective of the research paper is to analyse the cutting speed and Metal removal rate of tool steel. The Metal removal rate can be controlled by machining parameters which can be controlled and set according to the hardness and cutting speed. The process parameters taken are pulse on time, pulse off time, bed speed and current. Machine used for experiment is Electronica DL-25P unit four axis CNC Wire-cut electrical discharge machining (WEDM).He concluded that, the better Parameter setting is Pulse on 24μs, pulse off 6 μs, Bed speed 35 μm/s. Sachdevaet al. [2013] studied of metal cutting focuses on the features of tools, input work materials and machine parameter settings influencing process efficiency and output quality characteristics by taking five WEDM process parameters are current, pulse on time, pulse off time, wire speed and wire tension. Experiments were carried out on H-21 die tool steel as work piece electrode and zinc coated brass wire as a tool electrode. Response parameters are cutting speed, surface roughness and die width. Taguchi’s L18 orthogonal array technique along with S/N ratio and ANOVA has been used to evaluate optimal parameter combination to achieve optimal cutting speed, minimum surface roughness value and minimum die width; with selected experimental domain. Durairaj et al.[2013]studied the Grey relational theory and Taguchi optimization technique, in order to optimize the cutting parameters in Wire EDM for SS304. In this experiment Taguchi’s L16, orthogonal array has been used. The input parameters selected for optimization are gap voltage, wire feed, pulse on time, and pulse off time. For each experiment surface roughness and kerf width was determined by using contact type surf coder and video measuring system respectively. By using multi objective optimization technique grey relational theory, the optimal value is obtained for surface roughness and kerf width and by using Taguchi optimization technique, optimized value is obtained separately.
revealed that kerf width decreases with increase in pulse on time, pulse off time, spark gap voltage and peak current. Kerf width increases with increase in wire tension. In order to evaluate the effect of selected process parameters, the response surface methodology (RSM) is used to formulate a mathematical model which correlates the independent process parameters with the desired kerf width. The analysis of results indicates that the spark gap voltage, pulse on time, peak current and pulse off time have a significant effect on kerf width. Gadakh et al. [2012] studied the application of TOPSIS (Technique of order preference similarity to ideal solution) is used for solving multi-criteria optimization problems in WEDM. Result obtained by this technique hold same as the result obtained by past researchers work. Input parameters were Gap voltage, Pulse on time, Pulse off time and Wire feed. Optimization of Multi performance characteristics like MRR, kerf was done using TOPSIS. The method represents selection of optimal process parameters in WEDM process using TOPSIS method. Kumar et al.[2011] investigated performance of WEDM parameter (SR) while machining Al6063/Sicp composite. Experiment suggested selection of 4 process parameters (Pulse on time, Pulse off time, gap voltage, wire feed). For this, Sic was mixed as 5%, 10% & 15% in different proportions in Aluminium using stir casting method and then machining of pure Al 6063 and Al MMC was done. It was observed that Surface Roughness (Ra) increases with increase in percentage fraction of Sic particles in MMC. Raoet al. [2010] investigated effect of input parameters in WEDM on MRR by using Aluminium BIS-24345 alloy as workpiece material. Different levels of input parameters were studied using Taguchi design L18 orthogonal array. The parameters viz. Pulse on time, Pulse off time, Peak current, flushing pressure of dielectric, wire feed rate, wire tension, spark voltage & servo feed were selected. First table was prepared using orthogonal array then ANOVA (analysis of variance) was done and lastly S/N ratio was used to calculate MRR. It was concluded that Peak current parameter was most significant, Pulse on time, Pulse off time, Spark voltage and Flushing pressure of dielectric are significant factor. While wire feed and wire tension is less significant parameter. Gill et al. [2010] investigated the effect of deep cryogenic treatment (DCT) on machinability of Ti 6246 alloy in electric discharge drilling (EDD) by conducting experimental investigations on the production of 10mm diameter blind holes with electrolytic copper tool. An attempt has also been made to compare the production accuracy of holes drilled in deep cryogenically treated Ti 6246 (DCT Ti 6246) alloy and no treated Ti 6246 alloy in terms of surface roughness and overcut. The result of study reveals the higher material removal rate (MRR) and wear ratio (WR), lower tool wear rate (TWR) in case of EDD of DCT Ti 6246 alloy work piece as compared with no treated Ti 6246 alloy work piece. Also superior production accuracy of holes is reported while EDD of DCT work piece.Lin, Wang, et al. [2009] studied machining performance of conductive ceramics (Al2O3 + 30vol% TiC) in WEDM. The WEDM machining parameters such as machining polarity, peak current, auxiliary current with high voltage, pulse duration, no load voltage, and servo reference voltage were chosen to explore the effects on material removal rate (MRR), electrode wear rate (EWR), and surface roughness (SR). The L18 orthogonal array based on the Taguchi experimental method was adopted to determine EDM machining characteristics systemically, and the experimental data were statistically analyzed by analysis of variance (ANOVA).
III. EXPERIMENTAL SET UP, DESIGN AND RESULTS
A. Experimental Set Up
The experiment work was performed in Sprintcut WEDM machine (Electronica Sprintcut WEDM) as shown in Fig. 2.The zinc coated brass wire electrode of diameter 0.25 mm was used for machining.
B. Selection of Work Piece Material
In this work, Aluminium alloy 6061 is used. Aluminium alloy 6061 is alloy of precipitation-hardened type of the mostly used of the 6000 series Al alloys. It is an versatile heat treatable extruded alloy with medium to high strength capabilities. The Table1 shows typical Chemical composition of Al alloy 6061.
The aluminium alloy plate of rectangular type having size 200×100×10mmwas used for the experimental work. Before starting of experiment, one hole was drilled in the plate with wire EDM and seventeen square specimens of size 10×10 mm were cut. Al alloy6061 is normally used for the construction of aircraft structures, such as wings and fuselages, more commonly in homebuilt aircraft commercial or military aircraft, ultra-high vacuum (UHV) chambers, parts of remote controlled model, helicopter rotor components [2].
Table1: Chemical Composition of Al alloy 6061
S. No Component Wt. %
1 Aluminium Balance
2 Magnesium 0.8-0.12
3 Silicon 0.4-0.8
4 Iron Max. 0.7
5 Copper 0.15-0.40
6 Zinc Max. 0.25
7 Titanium Max. 0.15
8 Manganese Max. 0.1
9 Chromium 0.04-0.35
10 Others 0.05
C. Experiment Design
In this work four process parameters are used namely IP, TON, TOFF, SV have been considered in this study. The following parameters were constant during experiment namely with wire feed (8 m/min), wire tension (8 units),servo feed (2100 units) and flushing pressure (1 unit). These process parameters are done with four levels. TheTable2 show the different input parameters at four levels.
Table2:Input Variables Parameters and Their Levels
The selection of orthogonal array is concerned with the total degree of freedom of process parameters. The degree of freedom for the orthogonal array must be greater than or at least equal to given the process parameters. Thereby, L16 orthogonal array having degrees of freedom equal to 15 is considered in present case.
Sr. No. Variables input Unit Level 1 Level 2 Level 3 Level 4
1 Peak Current(A) Ampere 200 210 220 230
2 Pulse on time(B) µs 120 122 124 126
3 Pulse off time(C) µs 45 47 49 51
D. Experiment Results
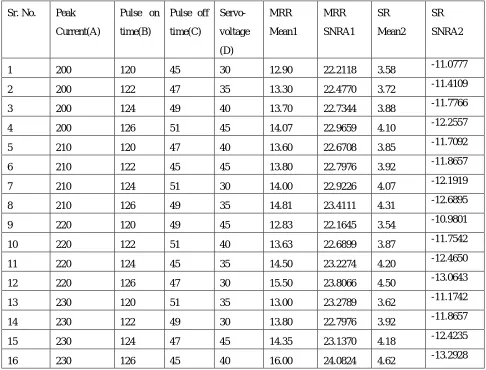
Table 3: Experiment observations
Sr. No. Peak
Current(A)
Pulse on
time(B)
Pulse off
time(C)
Servo-voltage
(D)
MRR
Mean1
MRR
SNRA1
SR
Mean2
SR
SNRA2
1 200 120 45 30 12.90 22.2118 3.58 -11.0777
2 200 122 47 35 13.30 22.4770 3.72 -11.4109
3 200 124 49 40 13.70 22.7344 3.88 -11.7766
4 200 126 51 45 14.07 22.9659 4.10 -12.2557
5 210 120 47 40 13.60 22.6708 3.85 -11.7092
6 210 122 45 45 13.80 22.7976 3.92 -11.8657
7 210 124 51 30 14.00 22.9226 4.07 -12.1919
8 210 126 49 35 14.81 23.4111 4.31 -12.6895
9 220 120 49 45 12.83 22.1645 3.54 -10.9801
10 220 122 51 40 13.63 22.6899 3.87 -11.7542
11 220 124 45 35 14.50 23.2274 4.20 -12.4650
12 220 126 47 30 15.50 23.8066 4.50 -13.0643
13 230 120 51 35 13.00 23.2789 3.62 -11.1742
14 230 122 49 30 13.80 22.7976 3.92 -11.8657
15 230 124 47 45 14.35 23.1370 4.18 -12.4235
16 230 126 45 40 16.00 24.0824 4.62 -13.2928
The above Table3 shows all experimental observations for MRR and SR. The experiments are done on above layout. After this the machining characteristics namely metal removal rate and surface roughness is measured.
( ) =Volume of material removed
Cutting time
The MRR was measured in mm3/min and surface roughness in µm.
E. Optimization of Machining Characteristics
In this work, Taguchi method is a power tool for parametric design of performance characteristics used to find out the optimum parameters. These optimum parameters are used to find out maximum cutting speed and metal removal rate and minimum surface roughness. The four control factors are used namely A, B, C, D. The obtained experimental observations are now converted into S/N ratios. The obtained S/N ratios obtained depend on various characteristics.
Based on the machining characteristic which has higher value represents better machining performance, such as cutting speed, is called ‘higher is better, HB’.
Inversely, the characteristic which lower value represented better machining performance, such as surface roughness, is called ‘lower is better, LB. Therefore, ‘HB’ for the cutting speed and ‘LB’ for the SR were selected for obtaining optimum machining performance characteristics. The loss function (L) for objective of HB and LB are stated as follows.
)
1
.
1
.(
...
.
²
1
1
1
n
i cs
HB
)
2
.
1
..(
...
.
²
1
1
ni sf
LB
y
n
L
Where ycs, ysf are response for cutting speed and surface finishing respectively and n denotes the number of experiments.
The S/N ratio may be calculated as a logarithmic transformation of the loss function as showed below.
S/N ratio for cutting speed = -10 log10 (LHB) …. (1.3)
S/N ratio for Surface Roughness = -10 log10 (LLB) … (1.4)
To find the effect of each level of process parameters on machining characteristic response table is used.
Taguchi method is used to find the response table. Firstly the mean values of machining characteristics belonging to each level are found. After that the averages are found and the process parameters which effect mainly MRR and SR are found.
F. Response Tables
1) Response Tables for MRR
Table4: Response Table for S/N Ratio (Higher is better)
Level Peak Current(A) Pulse on time (B) Pulse off time(C) Servo voltage (D)
1 22.60 22.33 23.08 22.93
2 22.95 22.69 23.00 22.05
3 22.98 23.01 22.80 23.04
4 23.10 23.57 22.70 22.77
Delta 0.48 1.24 0.37 0.28
Rank 2 1 3 4
Table 5: Response Table for Means (Higher is better)
Level Peak Current Pulse on time Pulse off time Servo voltage
1 13.49 13.08 14.30 14.05
2 14.05 13.63 14.19 13.90
3 14.12 14.14 13.79 14.13
4 14.29 15.10 13.68 13.76
Delta 0.79 2.01 0.63 0.47
Rank 2 1 3 4
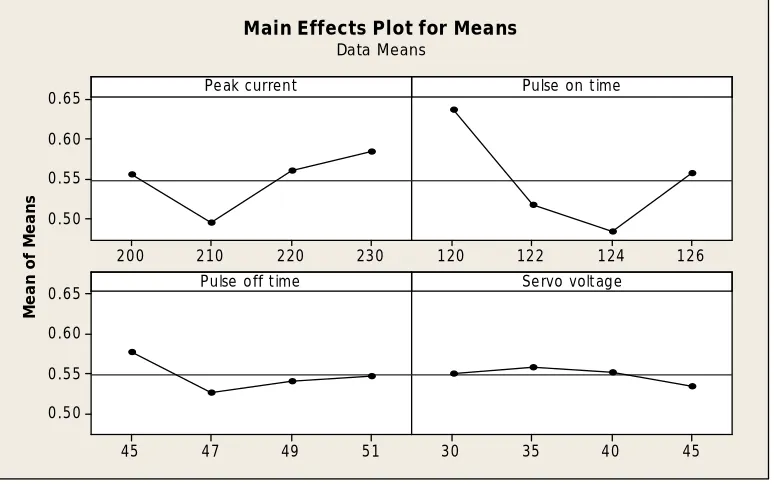
Fig.3. Main Effect Plot for Means (for Material Removal Rate)
Fig.4. Main Effect Plot for S/N ratio (MRR)
It is clear from the above figures 3 and 4 that the material removal rate highly increases with the increase of pulse on time and peak current, and decreases with increase in pulse off time and little variation with servo voltage, the reason behind this is that the discharge energy increases with the increase of pulse on time and peak current leading to a faster cutting rate. With the decrease in the pulse off time, the number of discharges within a given period becomes more which leads to a higher material removal rate. The effect of servo voltage on cutting rate is not very significant.
The Tables 6 and 7 show ANOVA for means and S/N ratio, as shows below;
Table6: Analysis of variance for Means
Source DF Seq. SS Adj. SS Adj. MS F P
Current 3 1.42202 1.42202 0.47401 55.29 0.004
Pulse on time 3 8.77642 8.77642 2.92547 341.25 0.000
Pulse off time 3 1.10527 1.10527 0.36842 42.95 0.006
Servo voltage 3 0.48712 0.48712 0.16237 18.94 0.019
Error 3 0.02572 0.02572 0.00857
Total 15
230 220 210 200 15.0 14.5 14.0 13.5 13.0 126 124 122 120 51 49 47 45 15.0 14.5 14.0 13.5 13.0 45 40 35 30 A M e a n o f M e a n s B C D
Main Effects Plot for Means
Data Means 230 220 210 200 23.50 23.25 23.00 22.75 22.50 126 124 122 120 51 49 47 45 23.50 23.25 23.00 22.75 22.50 45 40 35 30 A M e a n o f S N r a ti o s B C D
Main Effects Plot for SN ratios
Data Means
Table7: Results of Variance for S/N ratio
Source DF Seq. SS Adj. SS Adj. MS F P
Current 3 0.51859 0.51859 0.17186 72.38 0.003
Pulse on time 3 3.28958 3.28958 1.09653 459.12 0.000
Pulse off time 3 0.38818 0.31818 0.12939 54.18 0.004
Servo voltage 3 0.17026 0.17026 0.05675 23.76 0.014
Error 3 0.00717 0.00717 0.00239
Total 15 4.37376
S = 0.0925900 R-Sq = 99.78% R-Sq(adj) = 98.91%
2) Response Tables for SR
[image:10.612.75.531.270.719.2]The Tables 8 and 9 show response for means and Signal to Noise Ratios.
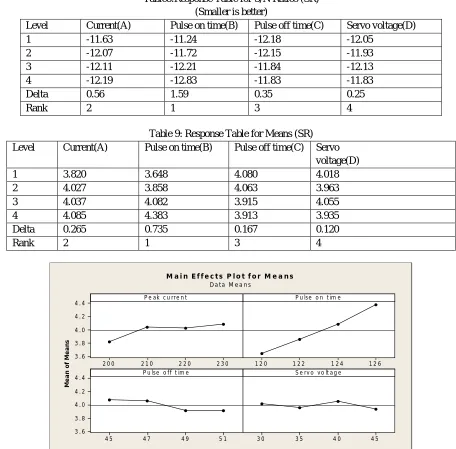
Table8:Response Table for S/N Ratios (SR) (Smaller is better)
Level Current(A) Pulse on time(B) Pulse off time(C) Servo voltage(D)
1 -11.63 -11.24 -12.18 -12.05
2 -12.07 -11.72 -12.15 -11.93
3 -12.11 -12.21 -11.84 -12.13
4 -12.19 -12.83 -11.83 -11.83
Delta 0.56 1.59 0.35 0.25
Rank 2 1 3 4
Table 9: Response Table for Means (SR)
Level Current(A) Pulse on time(B) Pulse off time(C) Servo
voltage(D)
1 3.820 3.648 4.080 4.018
2 4.027 3.858 4.063 3.963
3 4.037 4.082 3.915 4.055
4 4.085 4.383 3.913 3.935
Delta 0.265 0.735 0.167 0.120
Rank 2 1 3 4
2 3 0 2 2 0
2 1 0 2 0 0
4 . 4
4 . 2
4 . 0
3 . 8
3 . 6
1 2 6 1 2 4
1 2 2 1 2 0
5 1 4 9
4 7 4 5
4 . 4
4 . 2
4 . 0
3 . 8
3 . 6
4 5 4 0
3 5 3 0
P e ak c u rre n t
M
e
a
n
o
f
M
e
a
n
s
P u lse o n t im e
P u lse o ff t im e S e rv o v o lt a g e
M a i n E f f e c t s P l o t f o r M e a n s
D a ta M e a n s
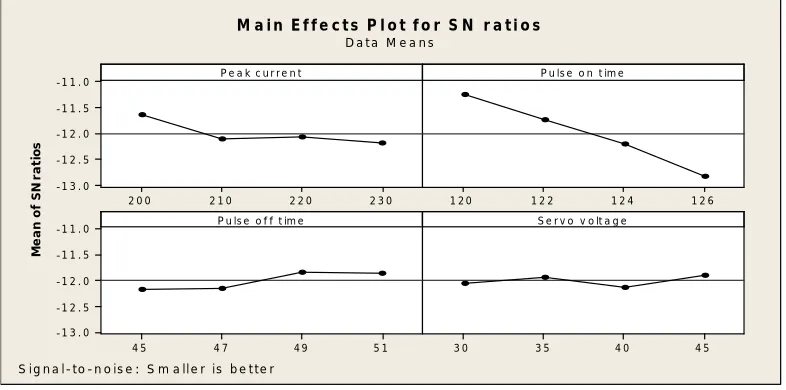
Fig.6: Main Effect Plot for S/N Ratios (SR)
The effects of process parameters for SR are shown from Fig. 5 and Fig. 6 as shown above.
The ANOVA Tables [10,11] for means and s/n ratios are as shown below.
Table 10: Analysis of Variance for S/N Ratios (SR)
Source DF Seq. SS Adj. SS Adj. MS F P
Current 3 0.89147 0.89147 0.29716 6.22 0.084
Pulse on time 3 6.64930 6.64930 2.21643 46.36 0.005
Pulse off time 3 0.33733 0.33733 0.11244 2.35 0.250
Servo voltage 3 0.05115 0.05115 0.01705 0.36 0.790
Error 3 0.14342 0.14342 0.04781
Total 15 8.07267
[image:11.612.72.539.357.458.2]S = 0.218649 R-Sq = 98.22% R-Sq(adj) = 91.12%
Table 11: Analysis of Variance for Mean2
Source DF Seq. SS Adj. SS Adj. MS F P
Current 3 0.22845 0.22845 0.07615 7.53 0.066
Pulse on time 3 1.68875 1.68875 0.56292 55.64 0.004
Pulse off time 3 0.09305 0.09305 0.03102 3.07 0.191
Servo voltage 3 0.01180 0.01180 0.00393 0.39 0.771
Error 3 0.03035 0.03035 0.01012
Total 15 2.05240
IV. PREDICTION OF OPTIMUM RESPONSE CHARACTERISTICS
A. Metal Removal Rate (MRR)
In this study the optimal value of material removal rate and surface roughness are predicted.
The optimum value of material removal Rate (MRR) is predicted at the optimal levels of significant variables which have already
been selected as peak current (A4), peak pulse on time (B4), pulse off time (C1), servo voltage (D3).
These optimal values are presented with their respective confidence intervals. The results of confirmation experiments are done with to validate the estimated optimal results. The values of MRR obtained through confirmation experiments are within the 95% of
2 3 0 2 2 0
2 1 0 2 0 0
- 1 1 . 0
- 1 1 . 5
- 1 2 . 0
- 1 2 . 5
- 1 3 . 0
1 2 6 1 2 4
1 2 2 1 2 0
5 1 4 9
4 7 4 5
- 1 1 . 0
- 1 1 . 5
- 1 2 . 0
- 1 2 . 5 - 1 3 . 0
4 5 4 0
3 5 3 0
P e a k c u r r e n t
M
e
a
n
o
f
S
N
r
a
ti
o
s
P u ls e o n t im e
P u ls e o f f t im e S e r v o v o lt a g e
M a i n E f f e c t s P l o t f o r S N r a t i o s
D a t a M e a n s
CICE of respective response characteristic. It is to be pointed out that these optimal values are within the specified range of process variables.
The estimated mean of the response characteristic (MRR) can be determined as:
µMRR = {(A4 + B4 + C1 + D3) - 3(μ)}
= {(14.29+15.10+14.30+14.13) - 3(13.987)}
= 57.82-41.961 = 15.859 mm
Where μ = overall mean of material removal rate = (ΣR)/16 = 13.987.
B. Surface Roughness (SR)
The optimum value of surface roughness (SR) is predicted at the optimal levels of significant variables which have already been selected as taper angle (A2), peak current (B1), pulse on time (C4), pulse off time (D4). The estimated mean of the response characteristic (MRR) can be determined as:
µSR = {(A2 + B1 + C4 + D4) - 3µ}
= (4.037 + 3.648 + 3.913 + 3.935) - (3 × 3.99) = 15.533 – 11.97
= 3.563 µm
Where µ = ΣR1/16 = 3.99,
And R1 values are taken from table 2 and A2, B1, C4, D4 are from table ANOVA.
[image:12.612.64.566.386.444.2]The Table12 shows predicted optimal values, confidence intervals and results of confirmation experiments
Table 12:Optimal Values of Individual Machining Characteristics
Response
Optimal Set of Parameters Predicted Optimal Value Average value of
Confirmation Experiment
MRR A4,B4,C1,D3 15.859 16.000
SR A1,B1,C4,D4 3.563 3.54
V. OPTIMIZATION OF MULTI-MACHINING CHARACTERISTICS USING GREY RELATIONAL ANALYSIS
To find the optimization of MRR and SR simultaneously using grey relational analysis (GRA), the following steps were followed:
1) Convert the experimental data into S/N values,
2) Normalize the S/N ratio,
3) Perform the grey relational generating and calculate the grey relational coefficient,
4) Calculate the grey relational grade by using the weighing factor for the performance characteristics,
5) Analyzing the experimental results with grey relational grade and statistical analysis of variance (ANOVA)
6) Select the optimal levels of process parameters,
7) Conduct the confirmation experiment to verify the optimal process parameter settings.
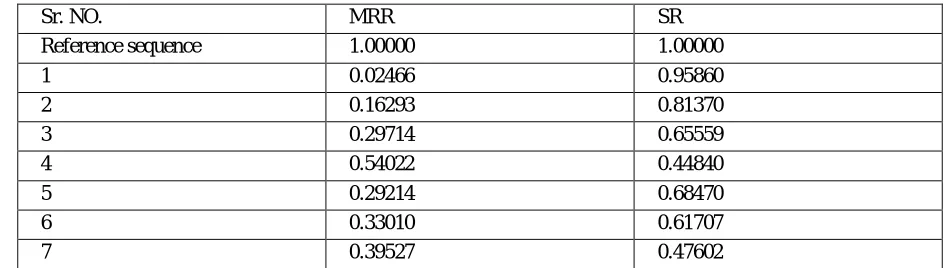
Table 13: The Sequence after Data Pre-Processing
Sr. NO. MRR SR
Reference sequence 1.00000 1.00000
1 0.02466 0.95860
2 0.16293 0.81370
3 0.29714 0.65559
4 0.54022 0.44840
5 0.29214 0.68470
6 0.33010 0.61707
[image:12.612.66.538.596.730.2]8 0.64998 0.26086
9 0.00000 1.00000
10 0.27394 0.66528
11 0.55419 0.35793
12 0.85619 0.09880
13 0.58105 0.91607
14 0.33000 0.61707
15 0.50700 0.37580
16 1.00000 0.00000
A. Grey Relational Analysis
Grey data processing must be performed before calculating the grey correlation coefficients.
In this work, a linear normalization of the experimental results (S/N ratios) for MRR and SR were performed in the range of 0 and 1, which is also called the grey relational generating. A linear data pre-processing method for the S/N ratio can be expressed as follows,
∗( ) = (( )− . ( )
max. ( )− . ( )
Where x∗(k)
is the sequence after the data processing; xio(k) is the original sequence of S/N ratio, i =1,2…………n with m=16
[image:13.612.59.540.74.212.2]max. xi*(k) said as largest of xi*(k); and min xi*(k) said as the smallest xi*(k). Table 13 shows the normalized S/N ratios for MRR and SR.
The outcomes are denoted as x∗(k) and x∗(k)
for reference sequence and comparability sequence, respectively. Normally, the larger normalized S/N ratio corresponds to the better performance and the best-normalized S/N ratio is equal to unity.
Next, the grey relational coefficient was calculated to express the relationship between the best (reference) and the actual normalized S/N ratio. The grey relational coefficient is expressed as follows
ϒ(xo* (k).x i(k)) =
(∆ min+ ζ. ∆ max) / (∆oi(k)+ + ζ. ∆ max) And
ϒ(xo* (k).x i(k)) ≤ 1
Where ∆oi(k)is the deviation sequence of reference sequence x
o*(k).and comparability sequence xi(k). ,i.e∆oi(k) =| x
o* (k) - xi(k) | is the absolute value of difference between xo*(k)andxi(k).
And also
∆ min= min. min.∆oi(k)
∆ max= max. max. .∆oi(k)
ζ is the distinguishing coefficients ζϵ| 0,1|.Nowζ is setas0.5in this work. The aim of defining that coefficient is to see the relation al degree between the reference sequences xo* (k)and the comparability of 16 sequences xi(k) where i=1,2,3….,m and k=1,2,….,n with m=16andn=2inthisstudy.
∆o1(1) = |1.0000-0.02466| = 0.97534
[image:13.612.95.508.652.745.2]∆o1(2)=|1.0000-0.95860| = 0.04140
Table 14: The Deviation Sequences
Deviation sequence ∆01( MRR) ∆02( SR)
No. 1 0.97534 0.04140
No. 2 0.83062 0.18630
No. 3 0.70285 0.34441
No. 4 0.45978 0.55160
No. 6 0.66990 0.38293
No. 7 0.60473 0.52398
No. 8 0.35002 0.73914
No. 9 1.00000 0.00000
No. 10 0.72606 0.33472
No. 11 0.44581 0.64207
No. 12 0.14380 0.90120
No. 13 0.41895 0.08393
No. 14 0.67000 0.38293
No. 15 0.49300 0.62420
No. 16 0.00000 1.00000
The same calculating method was performed for i=1-16,and the results of all ∆oifori=1-16are listed in Table 14. Investigating the data presented in Table14,we can findthat∆ max (k)and ∆ min(k)areas follows;
∆ max = ∆ 16 =1.00000 ∆ min =∆ 09= 0.000000 ϒ (xo* (1).x
1 (1)) = (0.0000 + 0.5× 1.0000) / (0.97534 + 0.5× 1.0000) =0.33890, and ϒ (xo* (2).x
2(2)) =(0.0000 + 0.5× 1.0000) / (0.04140 + 0.5× 1.0000) =0.99178 Thus ϒ (xo* (k).x
i(k)) = (0.33890,0.99178) For k=1-2
Similar procedure is applied fori=1-16and the results are summarized inTable15.
The grey relational grade is a weighting-sum of the grey relational coefficients. The overall evaluation of multiple performance characteristics was based on the grey relational grade and it can be defined as follows;
ɼ (xo*.x
i) = (xo∗ (k). xi(k)ßk ,
Where ßk represents the weighting value of the kth performance characteristics, and∑ ßk=1
Using the same weighting values of MRR and SR as were assigned in utility analysis (i.e.w1=w2=0.5),grey relational grade ɼ (xo*.x i)
[image:14.612.99.515.479.728.2]is calculated as depicted inTable15.
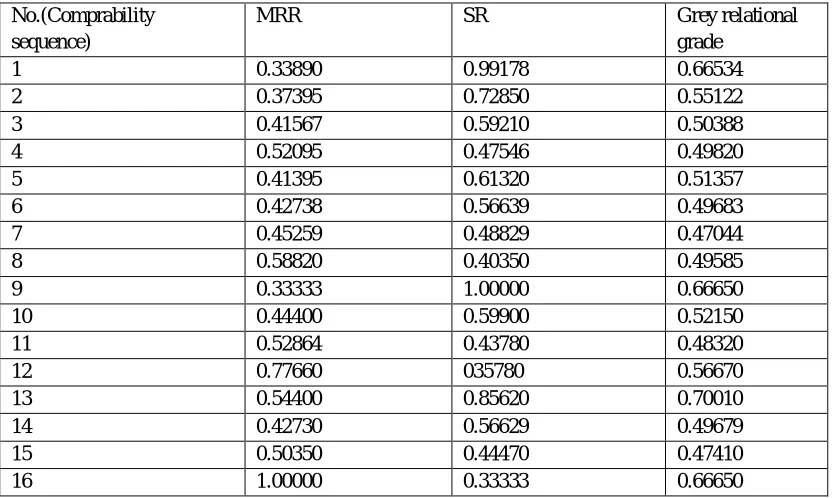
Table 15: The Calculated Grey Relational Coefficient for L16 Comparability Sequences No.(Comprability
sequence)
MRR SR Grey relational
grade
1 0.33890 0.99178 0.66534
2 0.37395 0.72850 0.55122
3 0.41567 0.59210 0.50388
4 0.52095 0.47546 0.49820
5 0.41395 0.61320 0.51357
6 0.42738 0.56639 0.49683
7 0.45259 0.48829 0.47044
8 0.58820 0.40350 0.49585
9 0.33333 1.00000 0.66650
10 0.44400 0.59900 0.52150
11 0.52864 0.43780 0.48320
12 0.77660 035780 0.56670
13 0.54400 0.85620 0.70010
14 0.42730 0.56629 0.49679
15 0.50350 0.44470 0.47410
B. Optimal Level of Process Parameters
Optimization of the multiple performance characteristics can be converted into optimization of single grey relational grade. It is clearly observed from Table15 for grey relational grade, the process parameters setting of experiment no.13 has the highest grey relational grade. Thus, the thirteen no. experiment gave the best multiple performance characteristics among the16 experiments using GRA. For separating out the effect of each process variable on the grey relational grade at different levels, response graph for grey relational grade is constructed using the Taguchi methodology as shown in Fig.7.
230 220
210 200
0.65
0.60
0.55
0.50
126 124
122 120
51 49
47 45
0.65
0.60
0.55
0.50
45 40
35 30
Pe ak current
M
e
a
n
o
f
M
e
a
n
s
Pulse on t ime
Pulse off t ime Se rvo volt age
Main Effects Plot for Means
[image:15.612.115.502.160.402.2]Data Means
Fig.7-Response graph for mean grey relational grade
Normally, the larger the grey relational grade, the better is the multiple performance characteristics. The combination of A4B1C1D2 shows larger value of the grey relational grade for the factors A, B, C and D, respectively. Therefore, A4(230 ampere), B1 (120 µs), C1(45 µs), D2(35), is the optimal parameter combination for multi-machining characteristics .The Table16 shows Responses for means for Grey relational grades and Table 17 shows ANOVA for Grey relational grades.
Table 16: Response Table for Means for Grey Relational Grades
Level Peak Current Pulse on time Pulse off time Servo voltage
1 0.5547 0.6364 0.5780 0.5498
2 0.4942 0.5166 0.5264 0.5576
3 0.5595 0.4829 0.5408 0.5514
4 0.5844 0.5568 0.5476 0.5339
Delta 0.0902 0.1535 0.0516 0.0237
Rank 2 1 3 4
Table 17: ANOVA for Grey Relational Grade
Source DF Seq. SS Adj. SS Adj. MS F P
Current 3 0.017585 0.017585 0.005862 0.96 0.514
Pulse on time 3 0.052450 0.052450 0.017483 2.85 0.206
Pulse off time 3 0.005669 0.005669 0.001890 0.31 0.820
Servo voltage 3 0.001220 0.001220 0.000407 0.07 0.974
Error 3 0.018373 0.018373 0.006124
C. Predicted Optimal Results
The optimal value of the machining characteristics has been predicted using the same procedure as discussed in previous section. ANOVA results given in Table16 depict that the pulse on time (B) and peak current (A) are the most significant factors affecting the grade values under 95% confidence level. Therefore, only most significant process parameters i.e. B and A have been considered to predict the optimal values of machining characteristics.
D. Confirmation Experiment
To find out the validation the results obtained, three confirmation experiments were conducted for each of the response characteristics (MRR) at optimal levels of the process variables. The average values of the characteristics were obtained and compared with the predicted values. The Table 18 show optimum results obtained by GRA.
Table18:Predicted Optimal Values, Confidence Intervals and Results of Confirmation Experiments with GRA.
Response Optimal Set of Parameters Predicted Optimal Value Average value of
Confirmation Experiment
MRR A4,B1,C1,D2 13.600
13.000
SR A4,B1,C1,D2 3.806 3.62
E. Summary of Results
Using Taguchi method, process parameters were optimized individually for MRR and SR. Therefore, process parameters are successfully optimized for individual characteristics using Taguchi method. The optimal setting of process parameters for multiple machining characteristics, using GRA is A4, B1, C1, D2.Using ANOVA, two process parameters namely pulse on time (B), peak current (A) were found significant affecting the grey relational grade, significantly. Therefore, using GRA, process parameters can be successfully optimized for multiple machining characteristics during WEDM of Al Alloy 6061. Table19 summarizes the results for individual and multiple machining characteristics.
Table19: Summary and Comparisonof Results
Method Optimization technique Optimal parameters
Combination
Predicted optimal Value
Individual characteristics optimization
Taguchi method A4,B4,C1,D3(MRR)
A1,B1,C4,D4(SR)
MRR=15.859 SR=3.563 Multiple characteristics
optimization
Grey relational analysis A4,B1,C1,D2 MRR=13.600
SR=3.806
VI. CONCLUSIONS
In this study, Grey relational analysis (GRA) along with Taguchi method was used to optimize the material removal rate (MRR) and surface roughness (SR) for Al alloy 6061. Based on the results and discussions, the following conclusions are made:
A. Using Taguchi method, MRR and SR were optimized individually. Two different optimal settings of process parameters were
found for MRR and SR. The optimal predicted values for MRR and SR are 15.859 mm3/min. and 3.563 µm.
B. Two process parameters namely pulse-on time(Ton)and Peak current(IP) are found the most significant affecting the MRR and SR.
C. In case of GRA, grey relational grade was used as a performance index to determine the optimal combination of process parameters for multiple machining characteristics. In this study, the equal weights were assigned to both the machining characteristics in calculating the grey relational grade. However, with a different set of weights, a different set of optimal parameters for machining characteristics will result.
D. Using GRA, process parameters can be successfully optimized for multiple machining characteristics during WEDM of Aluminium Alloy 6061. The optimal combination of the process parameters, using GRA for multi-machining characteristics is set toA4 (230 ampere), B1 (120 µs), C1 (45 µs), D2 (35 V).
REFERENCES
[1] Hocheng H. Lei WT. Hu HS (1997) Preliminary study of material removal in EDM of SiC/Al. J Mater Process Technol 63:813-818
[3] Mr. Harish kumar Sharma, Mr. Deepak Gupta(2016) “Optimization Of Process [Parameters Of Wire Cut Electronic Discharge Machining”, Global journals blog (http://blog .gjre.org/2016/02/optimization-of-process-parameters-of.html)
[4] Sumit Kumar, S.K Garg and GagandeepChawla(2016) “Experimental Investigation of Effect of Process Parameters on Material Removal Rate during WEDM”, International Journal of Current Engineering and Technology Vol.6, No.1 (Feb 2016).
[5] V. Kumar, K.K. Jangra, V. Kumar(2016) “An experimental study on trim cutting operation using metal powder mixed dielectric in WEDM of Nimonic-90”, Int. J.Ind. Eng. Comput. 7, 2016 135–146.
[6] Ranjan Panda, SambitSagar (2016) “Experimental Analysis And Optimization Of Edm On Aa6061 Using Taguchi Technique” IJERST, ISSN 2277-9655 [7] A.Pramanik, A.K. Basak, “Electrical discharge machining of 6061 aluminium alloy”, Transactions of Nonferrous Metals society of china (ELSEVIER),
25(2015) 2866-2874.
[8] Sivaraman B, Eswaramoorthy C, Shanmugham E.P(2015) “Optimal control parameters of machining in CNC Wire-Cut EDM for Titanium”, Int. Journal of Applied Sciences and Engineering Research, Vol. 4, Issue 1, 2015, ISSN 2277 – 9442.
[9] Rajan Jindal, Deepak Choudhary(2014) “Determination Of The Effect Of Cutting Parameters On Responses During Turning Of AISI H21 Steel Under Dry Machining Condition”, I-manager’s Journal on Mechanical Engineering, Vol. 5-No.1-November 2014.
[10] Rahul M. ChaudharyVimal P. Salot(2014) “ A Review On Parametric Optimization on Die Steel Using Wire Cut EDM”, International Journal for Innovative Research in Science & Technology, Volume 1,Issue 7, December 2014, ISSN (online): 2349-6010.
[11] S. ShivanagaMalleswaraRouthor, Ch. V. S. ParameswaraRao(2014) “Optimization and Influence of Process Parameters for Machining with WEDM”, International Journal of Innovative Research in Science Engineering and Technology, 3(1), 2014.
[12] Anurag Joshi,(2014) “Wire Cut Edm Process Limitations For Tool And Die Steel”, International Journal of Technical Research and Applications e-ISSN: 2320-8163, www.ijtra.com Volume-2, Special Issue 1 (July-Aug 2014), PP. 65-68.
[13] K. Kumar and R. Ravikumar (2013), “Modeling and Optimization of wire edm processes”, International Journal of Modern Engineering Research (IJMER), Vol.3, Issue.3, pp-1645-1648,ISSN:2249-6645.
[14] XIE Bao-Cheng, Wang Yu-kui (2011)Numerical simulation of titanium alloy machining in ED machining process. Trans. Nonferrous Met. Soc. China 21(2011) s434-s439.
[15] S. Sivakiran, C. Bhaskar Reddy, C. Eswara Reddy(2012), “Effect of Process Parameters On Mrr In Wire Electrical Discharge Machining Of En31 Steel”, International Journal of Engineering Research and Application(IJERA) ISSN:2248-9622,Vol.2,Issue 6, pp.1221-1226.
[16] MaanAabidTawfiq, “Effect of Multi-Coats of Cutting Tools on Surface Roughness in Machining AISI 1045 Steel”, Journal of Engineering &Technology,Vol.26, No.12, 2008. ISBN: 978-960-474-049-9, 2008, pp.152-156.
[17] Jangra K., Jain A., Grover S.(2010) Optimization of multiple machining characteristics wire electrical discharge machining (WEDM) punching die using Grey relation analysis, Journal of Science & Industrial Research, 2010; 69: 606–612.
[18] Jangra K., Grover S., Aggarwal A.(2011) Digraph and matrix method for the performance evaluation of carbide compacting die manufactured by wire EDM, Journal of Science & Industrial Research. 2011; 54(5-8): 579–591.
[19] Kumar Anish,KumarVinod(2012)Prediction of Surface Roughness in WEDM Process based on Response Surface Methodology; InterJ.Of Engg.& Tech.2012; 2049-3444.
[20] Sivaraman B, Eswaramoorthy C, Shanmugham E.P(2015) “Optimal control parameters of machining in CNC Wire-Cut EDM for Titanium”, Int. Journal of Applied Sciences and Engineering Research, Vol. 4, Issue 1, 2015, ISSN 2277 – 9442.
[21] P. Abinesh, Dr. K. Varatharajan, Dr. G. Satheesh Kumar(2014) “Optimization of Process Parameters Influencing MRR, Surface Roughness and Electrode Wear During Machining of Titanium Alloys by WEDM”, International Journal of Engineering Research and General Science Volume 2, Issue 4, June-July, 2014ISSN 2091-2730.
[22] D.V. Kashid, S.G. Bhatwadekar, S.B. Sangale, P.R. Kubade(2014) “Investigations of Effect of Process Parameters on Material Removal Rate in Wire-cut Electrical Discharge Machining of Steel Grade EN 9”, International Journal of Emerging Engineering Research and Technology Volume 2, Issue 1, April 2014, PP 31-35.
[23] Noor Zaman Khan, Zahid A. Khan, Arshad Noor Siddiquee&Arindam K. Chanda(2014) “Investigations on the effect of wire EDM process parameters on surface integrity of HSLA: a multi performance characteristics optimization”, Production & Manufacturing Research: An Open Access Journal, 2014 Vol. 2, No. 1, 501–518,
[24] L. Li, X.T. Wei, Z.Y. Li(2014) “Surface Integrity Evolution and Machining Efficiency Analysis of WEDM of Nickel-based Alloy”, Applied SurfaceScience 2014,
[25] GauravSachdeva, RavinderKhanna, ParveenYadav(2013) “Experimental study of H-21 punching dies on wire-cut electric discharge machine using Taguchi’s method”, International Journal of Scientific & Engineering Research,Volume 4, Issue 5, May-2013 ISSN 2229-5518.
[26] M. Durairaj, D. Sudharsun, N. Swamynathan(2013) “Analysis of Process Parameters in Wire EDM with Stainless Steel using Single Objective Taguchi Method and Multi Objective Grey Relational Grade”, 1877-7058 © 2013 The Authors. Published by Elsevier Ltd. Selection and peer-review under responsibility of the organizing and review committee of IConDM 2013 doi: 10.1016/j.proeng.2013.09.163.
[27] Pardeep Gupta, Rajesh Khanna, Rahul Dev Gupta, Neeraj Sharma(2012) “Effect of Process Parameters on Kerf Width in WEDM for HSLA Using Response Surface Methodology”, Journal of Engineering and Technology | Jan-Jun 2012 | Vol 2 | Issue 1, doi: 10.4103/0976-8580.94230.
[28] V. Muthuraman, R. Ramakrishnan, Karthikeyan(2012) “Influence of Process variables on WEDM of Tungsten Carbide Cobalt Metal Matrix Composite”, International Journal on Design & Manufacturing Technologies, 6(2), 2012.
[29] V. S. Gadakh(2012) “Parametric optimization of Wire Electrical Discharge Machining using TOPSIS METHOD”, Advances in Production Engineering and Management 7(3), 2012, 157-164 .
[30] D. SatishKumar, M. Kanthababu, Vajjiravelu, R Anburaj, H. Arul(2011) “Investigation of Wire electrical discharge machining characteristics of Al6063/SiCp composites”, Int J AdvManufTechnol, 56, (2011), 975-986, DOI 10.1007/s00170-011-3242-5.