Identification of Clinically Relevant Staphylococci by Matrix-Assisted
Laser Desorption Ionization–Time of Flight Mass Spectrometry
Naoto Matsuda,a,cMari Matsuda,aShigeyuki Notake,a,bHirohide Yokokawa,cYoshiaki Kawamura,dKeiichi Hiramatsu,aand Ken Kikuchia,c
Department of Infection Control Science, Faculty of Medicine, Juntendo University, Tokyo, Japana; Miroku Medical Laboratory Inc., Saku, Japanb; Department of General Medicine, Faculty of Medicine, Juntendo University, Tokyo, Japanc; and Department of Microbiology, Aichigakuin University, School of Pharmacy, Nagoya, Japand
In clinical microbiology, bacterial identification is labor-intensive and time-consuming. A solution for this problem is the use of
matrix-assisted laser desorption ionization–time of flight mass spectrometry (MALDI-TOF MS). In this study, we evaluated a
modified protein extraction method of identification performed on target plates (on-plate extraction method) with MALDI-TOF
(Bruker Microflex LT with Biotyper version 3.0) and compared it to 2 previously described methods: the direct colony method
and a standard protein extraction method (standard extraction method). We evaluated the species of 273 clinical strains and 14
reference strains of staphylococci. All isolates were characterized using the superoxide dismutase A sequence as a reference. For
the species identification, the on-plate, standard extraction, and direct colony methods identified 257 isolates (89.5%), 232
iso-lates (80.8%), and 173 isoiso-lates (60.2%), respectively, with statistically significant differences among the three methods (
P
<
0.05). In conclusion, the on-plate extraction method is at least as good as standard extraction in identification rate and has the
advantage of a shorter processing time.
M
atrix-assisted laser desorption ionization–time of flight
mass spectrometry (MALDI-TOF MS) has been used to
identify various microorganisms in clinical laboratories,
includ-ing Gram-positive bacteria, Gram-negative bacteria, yeasts, and
even filamentous fungi (
1
,
8
,
10
,
12
,
14
,
16
–
19
,
21
,
22
,
24
). It is a
rapid and inexpensive alternative to molecular identification that
offers equivalent accuracy (
6
). Additionally, complete bacterial
identification by MALDI-TOF MS is more cost-effective than by
conventional methods (
9
,
15
,
22
). Two preparatory methods have
been reported for MALDI-TOF MS-based identification (
1
,
4
,
5
):
the direct colony method and the standard protein extraction
method (standard extraction method). The direct colony method
is performed by picking up colonies from a culture plate and
plac-ing them, as a thin layer of sample, onto the target plate and then
subjecting the matrix to MALDI-TOF MS analysis (
1
). This
method is simple and can be performed rapidly, but it is inferior in
accuracy to the standard extraction method. This deficiency is
particularly evident for Gram-positive organisms because of
in-sufficient cell wall disruption (
1
). The standard extraction
method, in contrast, employs formic acid and acetonitrile to
dis-rupt the cells before they are placed onto the target plate for
MALDI-TOF MS analysis. The standard extraction method
in-volves 2 centrifugation steps and requires approximately
6-fold-more processing time than does the direct colony method.
We evaluated an on-plate extraction method that could be
performed on the target plates without any centrifugation
steps. Our study compared the on-plate extraction method
with both the direct colony and the standard extraction
meth-ods for MALDI-TOF MS-based identification of
staphylococ-cal clinistaphylococ-cal isolates.
MATERIALS AND METHODS
Bacterial isolates.This study used 273 staphylococci of nonduplicate clinical isolates and 14 type and reference strains (Staphylococcus aureus
NCTC 8325,S. epidermidisATCC 14490T,Staphylococcus capitissubsp.
capitis CCUG 7326T, Staphylococcus capitis subsp. ureolyticus ATCC
49326,Staphylococcus haemolyticusATCC 29970T,Staphylococcus
lug-dunensisATCC 43809T,Staphylococcus saprophyticusJCM 2427T,
Staph-ylococcus cohniiATCC 29974T,Staphylococcus hominisATCC 27844T,
Staphylococcus pettenkoferiCCUG 51279T,Staphylococcus schleiferisubsp.
schleiferiATCC 43808T,Staphylococcus schleiferisubsp.coagulansJCM
7470,Staphylococcus warneriATCC 27836T, andStaphylococcus caprae
ATCC 33538T). All strains were stored at⫺80°C until use, precultured for
12 to 24 h, and cultured aerobically overnight on 5% sheep blood agar at 37°C.
Species identification of staphylococci.Isolated species were identi-fied by partial sequencing of superoxide dismutase A (sodA) by using primers d1 and d2, as previously described (20,23). All isolates were considered correctly identified when thesodAsequence yieldedⱖ98% sequence similarity with the closest species sequence in the GenBank da-tabase. ThesodAsequence profiles and the origin of the clinical isolates are presented in the supplemental material.
MALDI-TOF MS.For the direct colony method, bacteria were ap-plied, using sterile toothpicks, as thin films on 96-spot, polished, stainless steel target plates (Bruker Daltonik GmbH, Leipzig, Germany). The bac-teria were then left to dry at room temperature for 1 min. Subsequently, 1.5l of the matrix solution, comprising a saturated␣ -cyano-4-hydro-cinnamic acid (Bruker Daltonik) in 50% acetonitrile (Wako Pure Chem-ical Industries, Osaka, Japan) and 2.5% trifluoroacetic acid (Wako), was
Received6 June 2012Returned for modification4 July 2012 Accepted9 September 2012
Published ahead of print19 September 2012
Address correspondence to Ken Kikuchi, [email protected].
Supplemental material for this article may be found athttp://jcm.asm.org/.
Copyright © 2012, American Society for Microbiology. All Rights Reserved.
doi:10.1128/JCM.01512-12
on May 16, 2020 by guest
http://jcm.asm.org/
applied to the samples and cocrystallized with them at room temperature for 10 min.
For the on-plate extraction method, each strain was applied and dried on the target plate as in the direct colony method. Following this, 0.5l of 70% formic acid (Wako) was mixed with the sample on the plate by pipetting, followed by 0.5l of acetonitrile, and the resultant mixture was dried at room temperature for approximately 10 min. Finally, 1.5l of the matrix solution was applied onto the spot as in the direct colony method. For the standard extraction method, a small sample of each colony was suspended in 300l of distilled water and adjusted at McFarland 2 stan-dard, and 900l of absolute ethanol was added. The suspension was vortexed vigorously and centrifuged at 20,000⫻gfor 2 min. The super-natant was then discarded, and the pellet was dried at 55°C for at least 30 min. Fifty microliters of 70% formic acid was then added and thoroughly mixed by pipetting. Next, 50l of acetonitrile was added, and the sample was centrifuged again at 20,000⫻gfor 2 min. Subsequently, 1l of supernatant was placed onto the target plate and left to dry for approxi-mately 10 min at room temperature. Finally, 1.5l of matrix solution was applied onto the spot, as in the direct colony procedure.
The samples prepared by each method were applied to a MicroFlex LT mass spectrometer (Bruker Daltonik), and the results were analyzed by MALDI Biotyper 3.0 software (Bruker Daltonik). Each measurement was performed only once for each culture.Escherichia coliDH5␣was used as a quality control as recommended by the manufacturer on each experi-ment.
Data analysis.The manufacturer’s recommended log score identifi-cation criteria were used as follows: a score of 2.000 to 3.000 indicated species-level identification, a score of 1.700 to 1.999 indicated genus-level identification, and a score of⬍1.700 indicated an unreliable identifica-tion. Duplicate experiments were performed. For genus- and species-level identification, a less stringent identification criterion was used for analy-sis. If 1 strain attained genus-level identification in the first experiment and species-level identification in the second experiment, genus-level identification was used for analysis. If 2 experiments resulted in different results, such as genus-level identification and unreliable identification, the unreliable-identification result was used. Additionally, the rates for dif-ferent criteria (genus-level, species-level, or unreliable identification) were calculated by the number of different criteria in first and second experiments divided by the total number of isolates. Different results be-tween MALDI-TOF MS and molecular identification were categorized as erroneous identifications. Additionally, when the Biotyper ascertained only genus-level identification (log score, 1.70 to 2.00), probable species identification was estimated in accordance with the log score order.
Dif-ferent species results between the highest log score candidate and molec-ular identification were categorized as discordant results. In the case of such results, the protein signature profile was analyzed. A dendrogram was constructed using the correlation distance measure and the average-linkage algorithm settings of the Biotyper 3.0 software. All processes re-lated to MALDI-TOF MS identification were performed by trained per-sonnel only.
Statistical analysis.Comparisons of genus- and species-level identifi-cations among the 3 preparatory methods were performed using chi-square tests. APvalue of⬍0.05 was considered statistically significant.
RESULTS
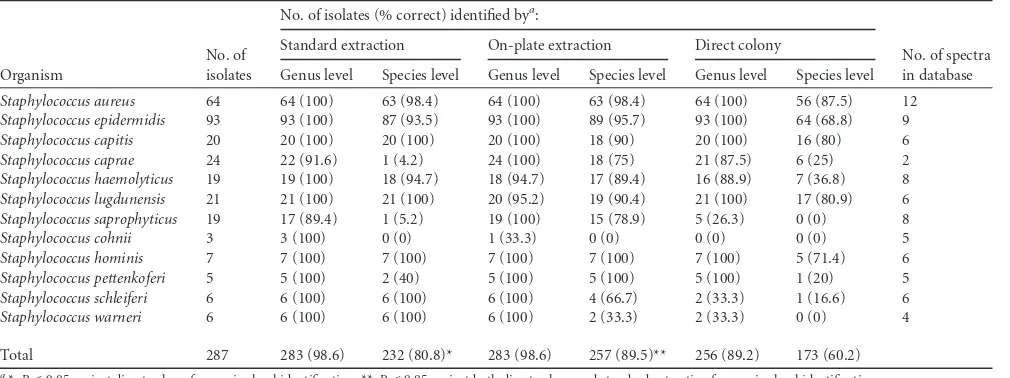
Identification rates for the three different methods.
The
identi-fication rates obtained using the 3 different methods are shown in
Table 1
. The on-plate method identified 283 (98.6%) isolates at
the genus level and 257 (89.5%) isolates at the species level. By
comparison, the standard extraction method identified 283
(98.6%) isolates at the genus level and 232 (80.8%) isolates at the
species level, while the direct colony method identified 256
(89.2%) isolates at the genus level and 173 (60.2%) isolates at the
species level. There were no statistically significant differences in
genus-level identifications between the on-plate method and the
standard extraction method (
P
⫽
0.1545), but a significantly
higher identification rate was achieved by the on-plate method at
the species level than by the standard extraction method (
P
⬍
0.0001). On the other hand, the direct colony method yielded
lower identification rates at the species level than did both the
standard extraction (
P
⬍
0.0001) and on-plate extraction
meth-ods (
P
⫽
0.0450). The rates for different identification criteria in
the first and second experiments were 30 (10.4%), 23 (8%), and 79
(27.5%) for standard extraction, on-plate extraction, and the
di-rect method, respectively (data not shown). In species
identifica-tion, there was a large difference between on-plate extraction and
standard extraction for
S. caprae
(75% and 4.2%, respectively) and
[image:2.585.40.545.76.265.2]S. saprophyticus
(78.9% and 5.2%, respectively). Other strains
have smaller identification rate differences or only a small number
of isolates. The species identification rates for coagulase-negative
staphylococci (CoNS) were 169 (75.8%), 194 (87.0%), and 117
(52.5%) for standard extraction, on-plate extraction, and the
di-rect colony method, respectively.
TABLE 1Comparison of three methods for identification ofStaphylococcusto the genus and species levels
Organism
No. of isolates
No. of isolates (% correct) identified bya:
No. of spectra in database Standard extraction On-plate extraction Direct colony
Genus level Species level Genus level Species level Genus level Species level
Staphylococcus aureus 64 64 (100) 63 (98.4) 64 (100) 63 (98.4) 64 (100) 56 (87.5) 12 Staphylococcus epidermidis 93 93 (100) 87 (93.5) 93 (100) 89 (95.7) 93 (100) 64 (68.8) 9 Staphylococcus capitis 20 20 (100) 20 (100) 20 (100) 18 (90) 20 (100) 16 (80) 6 Staphylococcus caprae 24 22 (91.6) 1 (4.2) 24 (100) 18 (75) 21 (87.5) 6 (25) 2 Staphylococcus haemolyticus 19 19 (100) 18 (94.7) 18 (94.7) 17 (89.4) 16 (88.9) 7 (36.8) 8 Staphylococcus lugdunensis 21 21 (100) 21 (100) 20 (95.2) 19 (90.4) 21 (100) 17 (80.9) 6 Staphylococcus saprophyticus 19 17 (89.4) 1 (5.2) 19 (100) 15 (78.9) 5 (26.3) 0 (0) 8
Staphylococcus cohnii 3 3 (100) 0 (0) 1 (33.3) 0 (0) 0 (0) 0 (0) 5
Staphylococcus hominis 7 7 (100) 7 (100) 7 (100) 7 (100) 7 (100) 5 (71.4) 6 Staphylococcus pettenkoferi 5 5 (100) 2 (40) 5 (100) 5 (100) 5 (100) 1 (20) 5 Staphylococcus schleiferi 6 6 (100) 6 (100) 6 (100) 4 (66.7) 2 (33.3) 1 (16.6) 6 Staphylococcus warneri 6 6 (100) 6 (100) 6 (100) 2 (33.3) 2 (33.3) 0 (0) 4
Total 287 283 (98.6) 232 (80.8)* 283 (98.6) 257 (89.5)** 256 (89.2) 173 (60.2)
a
*,P⬍0.05 against direct colony for species-level identification; **,P⬍0.05 against both direct colony and standard extraction for species-level identification.
on May 16, 2020 by guest
http://jcm.asm.org/
Time required for each method.
The mean times required for
48 duplicate samples (24 strains) in each procedure were 30 min
for the direct colony method, 60 min for on-plate extraction, and
180 min for the standard extraction method.
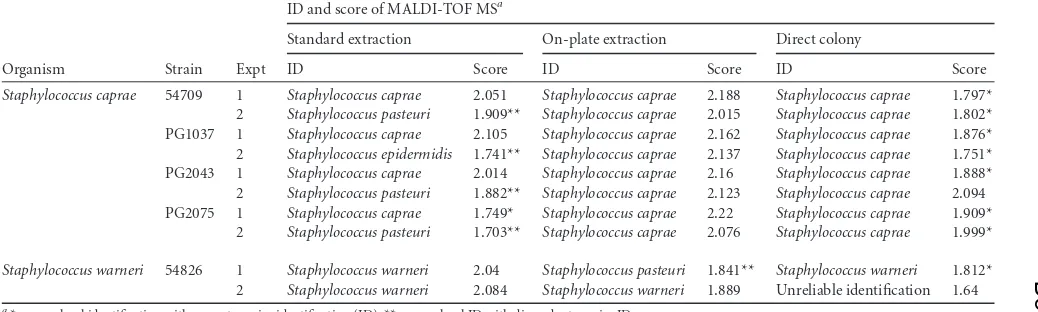
Erroneous or discordant identification.
No erroneous
iden-tifications were made, but 5 discordant results were obtained
(
Table 2
).
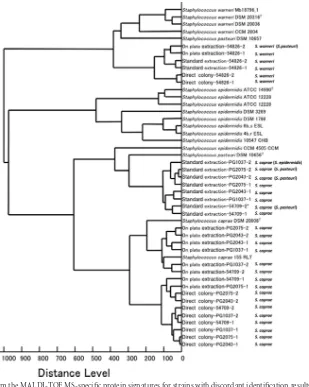
Dendrogram.
A dendrogram was created with the strains that
showed discordant results and related reference strains that were
installed in Biotyper 3.0 (
Fig. 1
). The protein signature profiles of
S. caprae
strains created by the standard extraction method
com-prised a cluster with
S. epidermidis
CCM4505 and
S. pasteuri
DSM
10656
T. In contrast, the profiles obtained by the direct colony and
on-plate extraction methods were closely related to the profile of
S. caprae
DSM 20608
T(
Fig. 1
). The profiles of
S. warneri
54826 as
determined by the 3 methods were clustered into the same group
as the profile of
S. warneri
DSM 20316
T.
DISCUSSION
Since MALDI-TOF MS was first applied for the identification of
microorganisms as early as 1975 (
2
), this system has been
devel-oped for clinical microbiology laboratories as a high-throughput
apparatus (
3
,
4
,
24
). The direct identification of positive blood
cultures by MALDI-TOF MS was recently reported with a species
identification rate of 91% (
13
). Improvements in the Biotyper 3.0
software and its database may change the clinical microbiology
laboratory workflow (
5
,
6
).
For MALDI-TOF MS-based bacterial identification, 2
prepa-ratory methods have been introduced by the manufacturer. One
of these is the direct colony method, which is suited for routine
workflows in the modern clinical microbiology laboratory,
re-quiring a shorter period (less than 30 min for 48 samples) and an
easier procedure. However, the method presents the problem of a
low identification rate, especially for Gram-positive bacteria (
1
,
5
). Bizzini et al. reported species identification rates by the direct
colony method for
Streptococcus agalactiae
as 58%,
Streptococcus
pneumoniae
as 73%,
S. aureus
as 79%, and
S. epidermidis
as 58%,
using MALDI Biotyper 2.0 software (
4
). In this study, we used
MALDI Biotyper 3.0 and achieved only slightly higher rates, i.e.,
87.5% and 68.8%, respectively, for
S. aureus
and
S. epidermidis
by
the direct colony method. Our higher identification rates may be
due to the improvement of the Biotyper version.
Another method, the standard extraction method, has been
used in the construction of a database for Biotyper and has been
recommended by the manufacturer as a reference method for
identifications (
1
,
4
,
7
). In this study, the identification rate of the
standard extraction method was 80.8% at the species level, a better
result than previously reported (
1
). The variability of
identifica-tion rates among different studies may be explained by differences
in growth conditions, sample preparation, number of reference
strains, version of Biotyper software, and study design (
3
). In our
protocol, the standard extraction method consisted of
approxi-mately 13 steps, including completion of 2 rounds of
centrifuga-tion for 2 min each, requiring approximately 180 min for 48
sam-ples. Because this is difficult to automate, the routine use of the
standard extraction method may not be suitable for primary
prep-aration (
1
,
4
). Standard extraction may be more suitable as a
ref-erence method for use when the on-plate method or direct colony
method fails to identify the species.
The on-plate extraction method offers the advantage of a
sim-ple and easy-to-use procedure. It requires only 4 steps and 60 min
for a complete identification of 48 samples. Bacterial
identifica-tion rates achieved with the on-plate extracidentifica-tion method were at
least equal to those achieved using the standard extraction
method. We found that
S. aureus
had a higher identification rate
than CoNS. Further study is needed to identify the cause of this
difference.
The identification rate of
S. caprae
and
S. saprophyticus
by the
on-plate method was shown to be higher than that by the standard
extraction method. The other species showed smaller
identifica-tion differences between the on-plate method and standard
ex-traction methods. This indicates that for some species of
staphy-lococci, the on-plate method may have a better identification rate
than the standard extraction method. Our protocol of complete
drying up of samples for standard extraction at 55°C may provide
an explanation. This method may cause the degradation of
pro-teins, shifting the protein profile used for identification. If we had
chosen a different protocol, such as a dry-up time of 10 min at
room temperature, the total time required for protein extraction
would be shortened, potentially producing a better identification
rate for standard extraction.
[image:3.585.39.558.79.235.2]Furthermore, the on-plate method may be improved as Haigh
et al. reported (
16
). They introduced a method that did not use
TABLE 2Strains with discordant identification by each method
Organism Strain Expt
ID and score of MALDI-TOF MSa
Standard extraction On-plate extraction Direct colony
ID Score ID Score ID Score
Staphylococcus caprae 54709 1 Staphylococcus caprae 2.051 Staphylococcus caprae 2.188 Staphylococcus caprae 1.797* 2 Staphylococcus pasteuri 1.909** Staphylococcus caprae 2.015 Staphylococcus caprae 1.802* PG1037 1 Staphylococcus caprae 2.105 Staphylococcus caprae 2.162 Staphylococcus caprae 1.876* 2 Staphylococcus epidermidis 1.741** Staphylococcus caprae 2.137 Staphylococcus caprae 1.751* PG2043 1 Staphylococcus caprae 2.014 Staphylococcus caprae 2.16 Staphylococcus caprae 1.888* 2 Staphylococcus pasteuri 1.882** Staphylococcus caprae 2.123 Staphylococcus caprae 2.094 PG2075 1 Staphylococcus caprae 1.749* Staphylococcus caprae 2.22 Staphylococcus caprae 1.909*
2 Staphylococcus pasteuri 1.703** Staphylococcus caprae 2.076 Staphylococcus caprae 1.999*
Staphylococcus warneri 54826 1 Staphylococcus warneri 2.04 Staphylococcus pasteuri 1.841** Staphylococcus warneri 1.812* 2 Staphylococcus warneri 2.084 Staphylococcus warneri 1.889 Unreliable identification 1.64 a
*, genus-level identification with correct species identification (ID); **, genus-level ID with discordant species ID.
on May 16, 2020 by guest
http://jcm.asm.org/
acetonitrile, demonstrating a 10.9% improvement in the
genus-level identification rates of various clinical strains (
16
). A shorter
method will be a great help in the installation of
MALDI-TOF-based bacterial identification.
There were 5 discordant results in the data set.
S. caprae
was
identified as
S. pasteuri
and
S. epidermidis
in experiment 2
us-ing the standard extraction method (
Table 2
).
S. warneri
was
identified as
S. pasteuri
in experiment 1 using the on-plate
extraction method. According to results from the MALDI
Bio-typer 3.0 database, the protein profile dendrograms for
stan-dard extractions of 4 strains of
S. caprae
showed clustering with
S. epidermidis
CCM4045 and
S. pasteuri
DSM10656
Tand
sep-aration from the cluster with
S. caprae
DSM 20608
T(
Fig. 1
).
The protein profile of
S. warneri
DSM 20316
Twas closely
re-lated to that of
S. pasteuri
DSM10657 but was separate from
that of
S. pasteuri
DSM10656
T. This discrepancy of phylogeny
between the MALDI-TOF MS profile and the
sodA
sequence
may be correlated with the discordant results obtained in our
experiment. Similarly, the close genetic and protein relatedness
between
S. pasteuri
and
S. warneri
might have caused the
dis-cordant results with
S. warneri
54826.
The MALDI Biotyper 3.0 included only 2 strains of
S. caprae
as
references, compared with 4 strains of
S. warneri
and 9 of
S.
epi-dermidis
(
Table 1
). This small number of reference strains might
have limited the accuracy in identifying
S. caprae
. Indeed, Seng et
al. previously described the correlation between the accuracy of
identification by MALDI-TOF MS and the number of reference
strains (
22
). Similar observations have been reported by several
other researchers (
1
,
18
). Further, Lista et al. showed that
addi-tional reference strains should more accurately represent the
ge-netic diversity of the strain (
19
). Therefore, proper representatives
from various genetic backgrounds for each species should
im-prove the species-level identification rates. Future studies using an
improved and extended database should overcome this issue.
In conclusion, we demonstrated that the on-plate extraction
method offers species identification rates at least equivalent to the
results of the standard extraction method, with advantages in
con-venience and faster processing time, and a significantly better
spe-FIG 1Dendrogram derived from the MALDI-TOF MS-specific protein signatures for strains with discordant identification results, including the profiles ofS. warneri,S. pasteuri,S. epidermidis, andS. capraefrom the MALDI Biotyper 3.0 database. Species names in this study defined bysodAsequence are shown after sample names. Additional species in parentheses are the discordant species identified by MALDI-TOF-based identification. Distance values were relative and normalized to a maximal value of 1,000.
on May 16, 2020 by guest
http://jcm.asm.org/
[image:4.585.139.448.65.452.2]cies identification rate than the direct colony method in
Staphylo-coccus
analysis.
ACKNOWLEDGMENT
This study was supported in part by a grant-in-aid (S0991013) from the Ministry of Education, Culture, Sports, Science, and Technology, Japan (MEXT), for the Foundation of Strategic Research Projects in Private Universities.
REFERENCES
1.Alatoom AA, Cunningham SA, Ihde SM, Mandrekar J, Patel R.2011. Comparison of direct colony method versus extraction method for iden-tification of gram-positive cocci by use of Bruker Biotyper matrix-assisted laser desorption ionization-time of flight mass spectrometry. J. Clin. Mi-crobiol.49:2868 –2873.
2.Anhalt JP, Fenselau C.1975. Identification of bacteria using mass spec-trometry. Anal. Chem.47:219 –225.
3.Benagli C, Rossi V, Dolina M, Tonolla M, Petrini O. 2011. Matrix-assisted laser desorption ionization-time of flight mass spectrometry for the identification of clinically relevant bacteria. PLoS One6:e16424. doi: 10.1371/journal.pone.0016424.
4.Bizzini A, Durussel C, Bille J, Greub G, Prod’hom G.2010. Performance of matrix-assisted laser desorption ionization–time of flight mass spec-trometry for identification of bacterial strains routinely isolated in a clin-ical microbiology laboratory. J. Clin. Microbiol.48:1549 –1554. 5.Bizzini A, Greub G.2010. Matrix-assisted laser desorption ionization
time-of-flight mass spectrometry, a revolution in clinical microbial iden-tification. Clin. Microbiol. Infect.16:1614 –1619.
6.Bizzini A, et al.2011. Matrix-assisted laser desorption ionization-time of flight mass spectrometry as an alternative to 16S rRNA gene sequencing for identification of difficult-to-identify bacterial strains. J. Clin. Micro-biol.49:693– 696.
7.Carbonnelle E, et al.2011. MALDI-TOF mass spectrometry tools for bacterial identification in clinical microbiology laboratory. Clin. Biochem.44:104 –109.
8.Cherkaoui A, et al.2010. Comparison of two matrix-assisted laser de-sorption ionization-time of flight mass spectrometry methods with con-ventional phenotypic identification for routine identification of bacteria to the species level. J. Clin. Microbiol.48:1169 –1175.
9.Dhiman N, Hall L, Wohlfiel SL, Buckwalter SP, Wengenack NL.2011. Performance and cost analysis of matrix-assisted laser desorption ioniza-tion-time of flight mass spectrometry for routine identification of yeast. J. Clin. Microbiol.49:1614 –1616.
10. Dubois D, et al.2010. Identification of a variety ofStaphylococcusspecies by matrix-assisted laser desorption ionization-time of flight mass spec-trometry. J. Clin. Microbiol.48:941–945.
11. Dupont C, et al.2010. Identification of clinical coagulase-negative
staph-ylococci, isolated in microbiology laboratories, by matrix-assisted laser desorption/ionization-time of flight mass spectrometry and two auto-mated systems. Clin. Microbiol. Infect.16:998 –1004.
12. Eigner U, et al.2009. Performance of a matrix-assisted laser desorption ionization-time-of-flight mass spectrometry system for the identification of bacterial isolates in the clinical routine laboratory. Clin. Lab.55:289 – 296.
13. Ferroni A, et al.2010. Real-time identification of bacteria andCandida species in positive blood culture broths by matrix-assisted laser desorption ionization-time of flight mass spectrometry. J. Clin. Microbiol.48:1542– 1548.
14. Friedrichs C, Rodloff AC, Chhatwal GS, Schellenberger W, Eschrich K.
2007. Rapid identification of viridans streptococci by mass spectrometric discrimination. J. Clin. Microbiol.45:2392–2397.
15. Gaillot O, et al.2011. Cost-effectiveness of switch to matrix-assisted laser desorption ionization time of flight mass spectrometry for routine bacte-rial identification. J. Clin. Microbiol.49:4412.
16. Haigh J, Degun A, Eydmann M, Millar M, Wilks M.2011. Improved performance of bacterium and yeast identification by a commercial ma-trix-assisted laser desorption ionization–time of flight mass spectrometry system in the clinical microbiology laboratory. J. Clin. Microbiol.49:3441. 17. Konrad R, et al.2010. Matrix-assisted laser desorption/ionisation time-of-flight (MALDI-TOF) mass spectrometry as a tool for rapid diagnosis of potentially toxigenicCorynebacteriumspecies in the laboratory manage-ment of diphtheria-associated bacteria. Euro Surveill.15(43):pi⫽19699. 18. Lartigue MF, et al.2009. Identification ofStreptococcus agalactiaeisolates
from various phylogenetic lineages by matrix-assisted laser desorption ionization–time of flight mass spectrometry. J. Clin. Microbiol.47:2284 – 2287.
19. Lista F, et al.2011. Reliable identification at the species level ofBrucella isolates with MALDI-TOF-MS. BMC Microbiol.11:267.
20. Poyart C, Quesne G, Boumaila C, Trieu-Cuot P. 2001. Rapid and accurate species-level identification of coagulase-negative staphylococci by using thesodAgene as a target. J. Clin. Microbiol.39:4296 – 4301. 21. Saffert RT, et al.2011. Comparison of Bruker Biotyper matrix-assisted
laser desorption ionization–time of flight mass spectrometer to BD Phoe-nix automated microbiology system for identification of gram-negative bacilli. J. Clin. Microbiol.49:887– 892.
22. Seng P, et al.2009. Ongoing revolution in bacteriology: routine identifi-cation of bacteria by matrix-assisted laser desorption ionization time-of-flight mass spectrometry. Clin. Infect. Dis.49:543–551.
23. Sivadon V, et al.2004. Use ofsodAsequencing for the identification of clinical isolates of coagulase-negative staphylococci. Clin. Microbiol. In-fect.10:939 –942.
24. van Veen SQ, Claas EC, Kuijper EJ.2010. High-throughput identifica-tion of bacteria and yeast by matrix-assisted laser desorpidentifica-tion ionizaidentifica-tion– time of flight mass spectrometry in conventional medical microbiology laboratories. J. Clin. Microbiol.48:900 –907.